HAL Id: hal-00708243
https://hal.archives-ouvertes.fr/hal-00708243v2
Submitted on 14 Mar 2014
HAL is a multi-disciplinary open access
archive for the deposit and dissemination of
sci-entific research documents, whether they are
pub-lished or not. The documents may come from
teaching and research institutions in France or
abroad, or from public or private research centers.
L’archive ouverte pluridisciplinaire HAL, est
destinée au dépôt et à la diffusion de documents
scientifiques de niveau recherche, publiés ou non,
émanant des établissements d’enseignement et de
recherche français ou étrangers, des laboratoires
publics ou privés.
Mixed-norm Regularization for Brain Decoding
Rémi Flamary, Nisrine Jrad, Ronald Phlypo, Marco Congedo, Alain
Rakotomamonjy
To cite this version:
Rémi Flamary, Nisrine Jrad, Ronald Phlypo, Marco Congedo, Alain Rakotomamonjy. Mixed-norm
Regularization for Brain Decoding. Computational and Mathematical Methods in Medicine, Hindawi
Publishing Corporation, 2014, 2014, pp.ID 317056. �10.1155/2014/317056�. �hal-00708243v2�
Mixed-norm Regularization for Brain Decoding
R. Flamarya,∗, N. Jradc, R. Phlypoc, M. Congedoc, A. Rakotomamonjyb,∗
a
Laboratoire Lagrance, UMR7293, Universit´e de Nice, 00006 Nice, France
b
LITIS, EA 4108 - INSA / Universit´e de Rouen, 76000 Rouen, France
c
Gipsa Lab, Domaine Universitaire BP 46, 38402 Saint Martin d’H`eres cedex, France
Abstract
This work investigates the use of mixed-norm regularization for sensor selection in Event-Related Potential (ERP) based Brain-Computer Interfaces (BCI). The classification problem is cast as a discriminative opti-mization framework where sensor selection is induced through the use of mixed-norms. This framework is extended to the multi-task learning situation where several similar classification tasks related to different subjects are learned simultaneously. In this case, multi-task learning helps in leveraging data scarcity issue yielding to more robust classifiers. For this purpose, we have introduced a regularizer that induces both sensor selection and classifier similarities. The different regularization approaches are compared on three ERP datasets showing the interest of mixed-norm regularization in terms of sensor selection. The multi-task approaches are evaluated when a small number of learning examples are available yielding to significant performance improvements especially for subjects performing poorly.
Keywords: Brain Computer Interface, Support Vector Machines, Sensor selection, EEG, sparse methods, Event Related Potential, Mixed norm.
1. Introduction
Brain Computer Interfaces (BCI) are systems that help disabled people communicating with their environ-ment through the use of brain signals [14]. At the present time, one of the most prominent BCI is based on electroencephalography (EEG) because of its low-cost, portability and its non-invasiveness. Among EEG based BCI, a paradigm of interest is the one based on event-related potentials (ERP) which are responses of the brain to some external stimuli. In this context, the innermost part of a BCI is the pattern recognition stage which has to correctly recognize presence of these ERPs. However, EEG signals are blurred due to the diffusion of the skull and the skin [27]. Furthermore, EEG recordings are highly contaminated by noise of
bi-∗Corresponding author
ological, instrumental and environmental origins. For addressing these issues, advanced signal processing and machine learning techniques have been employed to learn ERP patterns from training EEG signals leading to robust systems able to recognize the presence of these events [8, 31, 7, 26, 18, 32]. Note that while some ERPs are used for generating BCI commands, some others can be used for improving BCI efficiency. Indeed, recent studies have also tried to develop algorithms for automated recognition of error-related potentials [16]. These potentials are responses elicited when a subject commits an error in a BCI task or observes an error [17, 9] and thus they can help in correcting errors or in providing feedbacks to BCI user’s.
In this context of automated recognition of event-related potentials for BCI systems, reducing the number of EEG sensors is of primary importance since it reduces the implementation cost of the BCI by minimizing the number of EEG sensor, and speeding up experimental setup and calibration time. For this purpose, some studies have proposed to choose relevant sensors according to prior knowledge of brain functions. For instance, sensors located above the motor cortex region are preferred for motor imagery tasks and while for visual Event Related Potential (ERP), sensors located on the visual cortex are favored [22]. Recent works have focused on automatic sensor selection adapted to the specificity of a subject [19, 23, 35, 31, 10, 21]. For instance, Rakotomamonjy et al. [30] performed a recursive backward sensor selection using cross-validation classification performances as an elimination criterion. Another approach for exploring subset sensors have been proposed by [35], it consists in using a genetic algorithm for sensor selection coupled with an artificial neural networks for prediction. Those methods has been proven efficient but computationally demanding. A quicker way is to estimate the relevance of the sensors in terms of Signal to Noise Ratio (SNR) [31] and to keep the most relevant ones. Note that this approach does not optimize a discrimination criterion, although the final aim is a classification task. Recently, van Gerven et al. [34] proposed a graceful approach for embedding sensor selection into a discriminative framework. They performed sensor selection and learn a decision function by solving a unique optimization problem. In their framework, a logistic regression classifier is learned and the group-lasso regularization, also known as ℓ1− ℓ2 mixed-norm, is used to promote sensor
selection. They have also investigated the use of this groupwise regularization for frequency band selection and their applications to transfer learning. The same idea has been explored by Tomioka et al. [33] which also considered groupwise regularization for classifying EEG signals. In this work, we go beyond these studies by providing an in-depth study of the use of mixed-norms for sensor selection in a single subject setting and by discussing the utility of mixed-norms when learning decision functions for multiple subjects simultaneously. Our first contribution addresses the problem of robust sensor selection embedded into a discriminative frame-work. We broaden the analysis of van Gerven et al. [34] by considering regularizers which forms are ℓ1− ℓq
mixed-norms, with (1 ≤ q ≤ 2), as well as adaptive mixed-norms, so as to promote sparsity among group of features or sensors. In addition to providing a sparse and accurate sensor selection, mixed-norm regulariza-tion has several advantages. First, sensor selecregulariza-tion is cast into an elegant discriminative framework, using for
instance a large margin paradigm, which does not require any additional hyper-parameter to be optimized. Secondly, since sensor selection is jointly learned with the classifier by optimizing an “all-in-one” problem, selected sensors are directed to the goal of discriminating relevant EEG patterns. Hence, mixed-norm regu-larization helps locating sensors which are relevant for an optimal classification performance.
A common drawback of all the aforementioned sensor selection techniques is that selected set of sensors may vary, more or less substantially, from subject to subject. This variability, is due partly to subject specific differences and partly to acquisition noise and limited number of training examples. In such a case, selecting a robust subset of sensors may become a complex problem. Addressing this issue is the point of our second contribution. We propose a Multi-Task Learning (MTL) framework that helps in learning robust classifiers able to cope with the scarcity of learning examples. MTL is one way of achieving inductive transfer between tasks. The goal of inductive transfer is to leverage additional sources of information to improve the performance of learning on the current task. The main hypothesis underlying MTL is that tasks are related in some ways. In most cases, this relatedness is translated into a prior knowledge, e.g a regularization term, that a machine learning algorithm can take advantage of. For instance, regularization terms may promote similarity between all the tasks [15], or enforce classifier parameters to lie in a low dimensional linear subspace [2], or to jointly select the relevant features [29]. MTL has been proven efficient for motor imagery in [1] where several classifiers were learned simultaneously from several BCI subject datasets. Our second contribution is thus focused on the problem of performing sensor selection and learning robust classifiers through the use of an MTL mixed-norm regularization framework. We propose a novel regularizer promoting sensor selection and similarity between classifiers. By doing so, our goal is then to yield sensor selection and robust classifiers that are able to overcome the data scarcity problem by sharing information between the different classifiers to be learned.
The paper is organized as follows. The first part of the paper presents the discriminative framework and the different regularization terms we have considered for channel selection and multi-task learning. The second part is devoted to the description of the datasets, the preprocessing steps applied to each of them and the results achieved in terms of performances and sensor selection. In order to promote reproducible research, the code needed for generating the results in this paper is available of the author’s website1.
2. Learning framework
In this section, we introduce our mixed-norm regularization framework that can be used to perform sensor selection in a single task or in a transfer learning setting.
2.1. Channel selection in a single task learning setting
Typically in BCI problems, one wants to learn a classifier that is able to predict the class of some EEG trials, from a set of learning examples. We denoted as {xi, yi}i∈{1...n} the learning set such that xi∈ Rd is a trial
and yi ∈ {−1, 1} is its corresponding class, usually related to the absence or presence of an event-related
potential. In most cases, a trial xi is extracted from a multidimensional signal and thus is characterized by
r features for each of the p sensors, leading to a dimensionality d = r × p. Our aim is to learn, for a single subject, a linear classifier f that will predict the class of a trial x ∈ Rd, by looking at the sign of the function
f (·) defined as:
f (x) = xTw+ b (1)
with w ∈ Rd the normal vector to the separating hyperplane and b ∈ R a bias term. Parameters of this
function are learned by solving the optimization problem: min w,b n X i Lo(yi, xTi w+ b) + λΩ(w) (2)
where Lo is a loss function that measures the discrepancy between actual and predicted labels, Ω(·) a
regularization term that expresses some prior knowledge about the learning problem and λ a parameter that balances both terms. In this work, we choose Lo to be the squared hinge loss Lo(y, ˆy) = max(0, 1 − y ˆy)2,
thus promoting a large margin classifier.
2.1.1. Regularization terms
We now discuss different regularization terms that may be used for single task learning along with their significances in terms of channel selection.
ℓ2norm. The first regularization term that comes to mind is the standard squared ℓ2norm regularization:
Ω2(w) =
1 2||w||
2
2 (3)
where || · ||2 is the Euclidean norm. This is the common regularization term used for SVMs and it will be
considered in our experiments as the baseline approach. Intuitively, this regularizer tends to downweight the amplitude of each component of w leading to a better control of the margin width of our large-margin classifier and thus it helps in reducing overfitting.
ℓ1 norm. When only few of the features are discriminative for a classification task, a common way to select
the relevant ones is to use an ℓ1 norm of the form
Ω1(w) = d
X
i=1
as a regularizer [4]. Owing to its mathematical properties (non-differentiability at 0), unlike the ℓ2 norm,
this regularization term promotes sparsity, which means that at optimality of problem (2), some components of w are exactly 0. In a Bayesian framework, the ℓ1 norm is related to the use of prior on w that forces its
component to vanish [34]. This is typically obtained by means of Laplacian prior over the weight. However, ℓ1norm ignores the structure of the features (which may be grouped by sensors) since each component of w
is treated independently to the others yielding thus to feature selection but not to sensor selection.
ℓ1− ℓq mixed-norm. A way to take into account the fact that features are structured, is to use a mixed-norm
that will group them and regularize them together. Here, we consider mixed-norm of the form Ω1−q(w) =
X
g∈G
||wg||q (5)
with 1 ≤ q ≤ 2 and G being a partition of the set {1, · · · , d}. Intuitively, this ℓ1− ℓq mixed-norm can be
interpreted as an ℓ1norm applied to the vector containing the ℓq norm of each group of features. It promotes
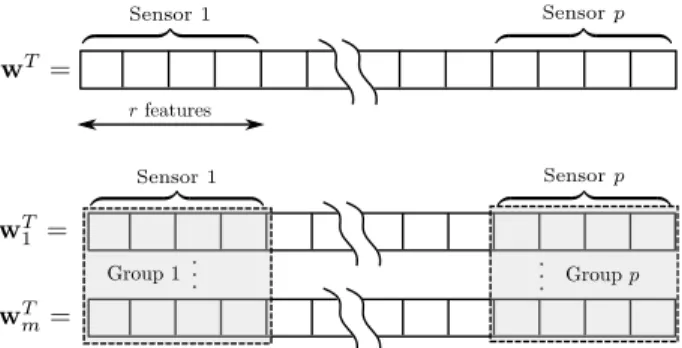
sparsity on each wg norm and consequently on the wg components as well. For our BCI problem, a natural
choice for G is to group the features by sensors yielding thus to p groups (one per sensor) of r features as reported in Figure 1. Note that unlike the ℓ1− ℓ2 norm as used by van Gerven et al. [34] and Tomioka et
al. [33], the use of an inner ℓq norm leads to more flexibility as it spans from the ℓ1− ℓ1 (equivalent to the
ℓ1-norm and leading thus to unstructured feature selection) to the ℓ1− ℓ2 which strongly ties together the
components of a group. Examples of the use of ℓq norm and mixed-norm regularizations in other biomedical
contexts can be found for instance in [28, 25].
Adaptive ℓ1− ℓq. The ℓ1 and ℓ1 − ℓq norms described above, are well-known to lead to grouped feature
selection. However, they are also known, to lead to poor statistical properties (at least when used with a square loss function) [3]. For instance, they are known to have consistency issue in the sense that, even with an arbitrarily large number of training examples, these norms may be unable to select the true subset of features. In practice, this means that when used in Equation (2), the optimal weight vector w will tend to over-estimate the number of relevant sensors. These issues can be addressed by considering an adaptive ℓ1− ℓq mixed-norm of the form [36, 3]:
Ωa:1−q(w) =
X
g∈G
βg||wg||q (6)
where the weights βgare selected so as to enhance the sparsity pattern of w. In our experiments, we obtain
them by first solving the ℓ1− ℓq problem with βg= 1, which outputs an optimal parameter w∗, and by finally
defining βg = 1/||w∗g||q. Then, solving the weighted ℓ1− ℓq problem yields an optimal solution with increased
sparsity pattern compared to w∗ since the β
gaugments the penalization of groups with norm kw∗gkq smaller
Figure 1: Examples of feature grouping for (top) single task and (bottom) multiple task learning.
2.1.2. Algorithms
Let us now discuss how problem (2) is solved when one of these regularizers is in play.
Using the ℓ2 norm regularization makes the problem differentiable. Hence a first or second-order descent
based algorithm can be considered [11].
Because the other regularizers are not differentiable, we have deployed an algorithm [12] tailored for minimiz-ing objective function of the form f1(w) + f2(w) with f1 a smooth and differentiable convex function with
Lipschitz constant L and f2 a continuous and convex non-differentiable function having a simple proximal
operator, i.e. a closed-form or an easy-to-compute solution of the problem: proxf2(v) := argminu
1
2kv − uk
2
2+ f2(u) (7)
Such an algorithm, known as forward-backward splitting [12] is simply based on the following iterative approach,
wk+1= prox1 γf2(w
k− γ∇
wf1(wk)) (8)
with γ being a stepsize in the gradient descent. This algorithm can be easily derived by considering, instead of directly minimizing f1(w) + f2(w), an iterative scheme which at each iteration replace f1 with a quadratic
approximation of f1(·) in the neighborhood of wk. Hence, wk+1is the minimizer of :
f1(wk) + h∇wf1(wk), w − wki +
γ
2kw − w
kk2
2+ f2(w)
which closed-form is given in Equation (8). This algorithm is known to converge towards a minimizer of f1(w) + f2(w) under some weak conditions on the stepsize [12], which is satisfied by choosing for instance
γ = 1
L. We can note that the algorithm defined in Equation (8) has the same flavor as a projected gradient
algorithm which first, takes a gradient step, and then “projects” back the solution owing to the proximal operator. More details can also be found in [5].
For our problem (2), we choose f1(w) to be the squared hinge loss and f2(w) the non-smooth regularizer. The
square hinge loss is indeed gradient Lipschitz with a constant L being 2P
i=1kxik 2
is available in Appendix 4.1. Proximal operators of the ℓ1 and the ℓ1− ℓ2 regularization term can be easily
shown to be the soft-thresholding and the block-soft thresholding operator [4]. The general ℓ1− ℓq norm does
not admit a closed-form solution, but its proximal operator can be simply computed by means of an iterative algorithm [29]. More details on these proximal operators are also available in Appendix 4.3.
2.2. Channel selection and transfer learning in multiple task setting
We now address the problem of channel selection in cases where training examples for several subjects are at our disposal. We have claimed that in such a situation, it would be benefitial to learn the decision functions related to all subjects simultaneously, while inducing selected channels to be alike for all subjects, as well as inducing decision function parameters to be related in some sense. These two hypotheses make reasonable sense since brain regions related to the appearance of a given ERP are expected to be somewhat location-invariant across subjects. For solving this problem, we apply a machine learning paradigm, known as multi-task learning, where in our case, each task is related to the decision function of a given subject and where the regularizer should reflect the above-described prior knowledge on the problem. Given m subjects, the resulting optimization problem boils down to be
min W,b m X t nt X i=1
L(yi,t, xTi,twt+ bt) + Ωmtl(W) (9)
with {xi,t, yi,t}i∈{1...nt} being the training examples related to each task t ∈ 1 . . . m, (wt, bt) being the
classifier parameters for task t and W = [w1. . . wm] ∈ Rd×mbeing a matrix concatenating all vectors {wt}.
Note that the multi-task learning framework applied to single EEG trial classification have already been investigated by van Gerven et al. [34]. The main contribution we bring compared to their works is the use of regularizer that explicitly induces all subject classifiers to be similar to an average one, in addition to a regularizer that enforces selected channels to be the same for all subjects. The intuition behind this point is : we believe that since the classification tasks we are dealing with, are similar for all subjects and all related to the same BCI paradigm, selected channels and classifier parameters should not differ that much from subject to subject. We also think that inducing task parameters to be similar may be more important than enforcing selected channels to be similar when the number of training examples is small since it helps in reducing overfitting. For this purpose, we have proposed a novel regularization term of the form :
Ωmtl(W) = λr X g∈G′ ||Wg||2+ λs m X t=1 ||wt− ˆw||22 (10) where ˆw= 1 m P
twtis the average classifier across tasks and G′ contains non-overlapping groups of
compo-nents from matrix W. The first term in Equation (10) is a mixed-norm term that promotes group regular-ization. In this work, we defined groups in G′ based on the sensors, which means that all the features across
in Figure 1. The second term is a similarity promoting term as introduced in Evgeniou et al. [15]. It can be interpreted as a term enforcing the minimization of the classifier’s parameter variance. In other words, it promotes classifiers to be similar to the average one, and it helps improving performances when the number of learning examples for each task is limited, by reducing over-fitting. Note that λrand λsrespectively control
the sparsity induced by the first term and the similarity induced by the second one. Hence, when setting λs = 0, the regularizer given in Equation (10) boils down to be similar to the one used by van Gerven et
al. [34]. Note that in practice λr and λs are selected by means of a nested cross-validation which aims at
classification accuracy. Thus, it may occur that classifier similarity is preferred over sensor selection leading to robust classifiers which still use most of the sensors.
Similarly to the single task optimization framework given in Equation (2), the objective function for problem (9) can be expressed as a sum of gradient Lipschitz continuous term f1(W) =P
m,n t,i L(·) + λsP m t=1||wt− ˆ w||2
2 and a non-differentiable term f2(W) = λrPg∈G′||Wg||2 having a closed-form proximal operator (see
Appendix 4.2). Hence, we have again considered a forward-backward splitting algorithm which iterates are given in Equation (8).
3. Numerical experiments
We now present how these novel approaches perform on different BCI problems. Before delving into the details of the results, we introduce the simulated and real datasets.
3.1. Experimental Data
We have first evaluated the proposed approaches on a simple simulated P300 dataset generated as follows. A P300 wave is extracted using the grand average of a single subject data from the EPFL dataset described in the following. We generate 11000 simulated examples with 8 discriminative channels containing the P300 out of 16 channels for positive examples. A Gaussian noise of standard deviation 0.2 is added to all signals making the dataset more realistic. 1000 of these examples have been used for training.
The first real P300 dataset we used is the EPFL dataset, based on eight subjects performing P300 related tasks [20]. The subjects were asked to focus on one of the 3×2=6 images on the screen while the one of the images is flashed at random. The EEG signals were acquired from 32 channels, sampled at 1024 Hz and 4 recording sessions per subject have been realized. Signals are pre-processed exactly according to the steps described in [20] : a [1, 8] Hz bandpass Butterworth filter of order 3 is applied to all signals followed by a downsampling. Hence, for each trial (training example), we have 8 time-sample features per channel corresponding to a 1000 ms time-window after stimulus, which leads to 256 features for all channels (32×8=256 features). On the overall, the training set of a given subject is composed of about 3000 trials.
Another P300 dataset, recorded by the Neuroimaging Laboratory of Universidad Aut´onoma Metropolitana (UAM, Mexico) [24], has also been utilized. The data have been obtained from 30 subjects performing P300 spelling tasks on a 6×6 virtual keyboard. Signals are recorded over 10 channels leading thus to a very challenging dataset for sensor selection, as there are just few sensors left to select. For this dataset, we only use the first 3 sessions in order to have the same number of trials for all subjects (≈4000 samples). The EEG signals have been pre-processed according to the following steps : a [2, 20] Hz Chebychef bandpass filter of order 5 is first applied followed by a decimation, resulting in a post-stimulus time-window of 31 samples per channels. Hence, each trial is composed of 310 (10×31) features .
We have also studied the effectiveness of our methods on an Error Related Potential (ErrP) dataset that has been recorded in the GIPSA Lab. The subjects were asked to memorize the position of 2 to 9 digits and to remind the position of one of these digits, operation has been repeated 72 times for each subject. The signal following the visualization of the result (correct/error on the memorized position) was recorded from 31 electrodes and sampled at 512 Hz. Similarly to Jrad et al. [21], a [1, 10] Hz Butterworth filter of order 4 and a downsampling has been applied to all channel signals. Finally, a time window of 1000ms is considered as a trial (training example) with a dimensionality of 16 × 31 = 496.
3.2. Evaluation criterion, methods and experimental protocol
We have compared several regularizers that induce feature/channel selection embedded in the learning algo-rithm, in a single subject learning setting as defined in Equation (2). The performance measure commonly used in BCI Competitions [8] is the Area Under the Roc Curve (AUC). This measure is an estimate of the probability for a positive class to have a higher score than a negative class. It makes particularly sense to use AUC when evaluating a P300 speller as the letter in the keyboard is usually chosen by comparing score returned by the classifier for every column or line. In addition, AUC does not depend on the proportion of positive/negative examples in the data which makes it more robust than classification error rate. Our baseline algorithm is an SVM, which uses an ℓ2 regularizer and thus does not perform any selection. Using an ℓ1
regularizer yields a classifier which embeds feature selection, denoted as SVM-1 in the sequel. Three mixed-norm regularizers inducing sensor selection have also been considered : an ℓ1− ℓ2 denoted as GSVM-2, and
ℓ1− ℓq referred as GSVM-q, with q being selected in the set {1, 1.2, . . . , 1.8, 2}) by a nested cross-validation
stage, and adaptive ℓ1− ℓq norm, with q = 2 denoted as GSVM-a.
For the multi-task learning setting, two MTL methods were compared to two baseline approaches which use all features, namely a method that treats each tasks separately by learning one SVM per task (SVM), and a method denoted as SVM-Full, which on the contrary learns an unique SVM from all subject datasets. The two MTL methods are respectively a MTL as described in Equation (9), denoted as MGSVM-2s and the same MTL but without similarity-promoting regularization term, which actually means that we set λs= 0,
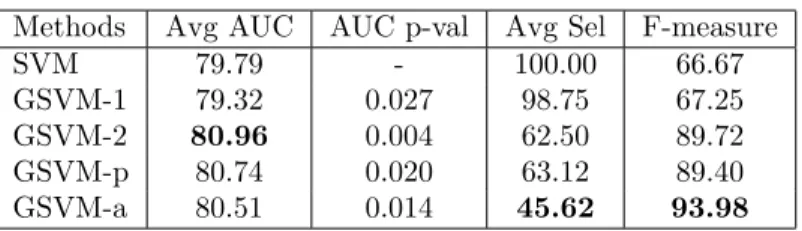
Methods Avg AUC AUC p-val Avg Sel F-measure SVM 79.79 - 100.00 66.67 GSVM-1 79.32 0.027 98.75 67.25 GSVM-2 80.96 0.004 62.50 89.72 GSVM-p 80.74 0.020 63.12 89.40 GSVM-a 80.51 0.014 45.62 93.98
Table 1: Performance results on the simulated dataset : the average performance in AUC (in %), the average percent of selected sensors (Sel) and the F-measure of the selected channels (in %). Best results for each performance measure are in bold. The p-value refers to the one of a Wilcoxon signrank test with SVM as a baseline.
indicated as MGSVM-2. For these approaches, performances are evaluated as the average AUC of the decision functions over all the subjects.
The experimental setup is described in the following. For each subject, the dataset is randomly split into a training set of n = 1000 trials and a test set containing the rest of the trials. The regularization parameter λ has been selected from a log-spaced grid ([10−3, 101]) according to a nested 3-fold cross-validation step
on the training set. When necessary, the selection of q is also included in this CV procedure. Finally, the selected value of λ is used to learn a classifier on the training examples and performances are evaluated on the independent test set. We run this procedure 10 times for every subject and report average performances. A Wilcoxon signed-rank test, which takes ties into account is used to evaluate the statistical difference of the mean performances of all methods compared to the baseline SVM. We believe that such a test is more appropriate for comparing methods than merely looking at the standard deviation due to the high inter-subject variability in BCI problems.
3.3. Results and discussions
We now present the results we achieved on the above-described datasets.
3.3.1. Simulated dataset
Average (over 10 runs) performance of the different regularizers on the simulated dataset are reported in Table 1 through AUC, sensor selection rate and F-measure. This latter criterion measures the relevance of the selected channels compared to the true relevant ones. F-measure is formally defined as
F-measure = 2 |C ∩ C
∗|
|C∗| + |C|
where C and C∗are respectively the set of selected channels and true relevant channels and |·| here denotes the
cardinality of a set. Note that if the selected channels are all the relevant ones, then the F-measure is equal to one. Most of the approaches provide similar AUC performances. We can although highlight that group-regularization approaches (GSVM-2,GSVM-p, GSVM-a) drastically reduce the number of selected channels
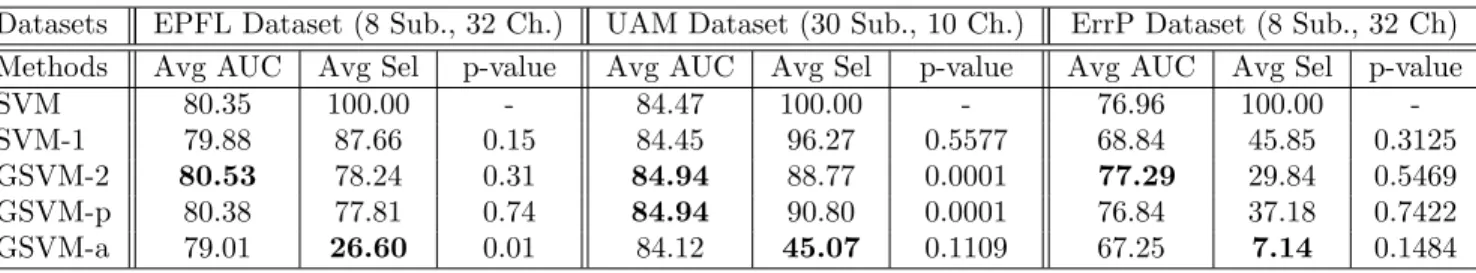
Datasets EPFL Dataset (8 Sub., 32 Ch.) UAM Dataset (30 Sub., 10 Ch.) ErrP Dataset (8 Sub., 32 Ch) Methods Avg AUC Avg Sel p-value Avg AUC Avg Sel p-value Avg AUC Avg Sel p-value
SVM 80.35 100.00 - 84.47 100.00 - 76.96 100.00
-SVM-1 79.88 87.66 0.15 84.45 96.27 0.5577 68.84 45.85 0.3125
GSVM-2 80.53 78.24 0.31 84.94 88.77 0.0001 77.29 29.84 0.5469
GSVM-p 80.38 77.81 0.74 84.94 90.80 0.0001 76.84 37.18 0.7422
GSVM-a 79.01 26.60 0.01 84.12 45.07 0.1109 67.25 7.14 0.1484
Table 2: Performance results for the 3 datasets the average performance (over subjects) in AUC (in %), the average percent of selected sensors (Sel) and the p-value of the Wilcoxon signrank test for the AUC when compared to the baseline SVM’s one. Best performing algorithms for each performance measure are in bold.
since only 62% and 45% of the sensors are selected. A clear advantage goes to the adaptive regularization that is both sparser and is more capable of retrieving the true relevant channels.
3.3.2. P300 Datasets
Results for these datasets are reported in Table 2. For the EPFL dataset, all methods achieve performances that are not statistically different. However, we note that GSVM-2 leads to sensor selection (80% of sensor selected) while GSVM-a yields to classifiers that, on average, use 26% of the sensors at the cost of a slight loss in performances (1.5% AUC).
Results for the UAM dataset follow the same trend in term of sensor selection but we also observe that the mixed-norm regularizers yield to increased performances. GSVM-2 performs statistically better than SVM although most of the sensors (9 out of 10) have been kept in the model. This shows that even if few channels have been removed, the group-regularization improves performances by bringing sensor prior knowledge to the problem. We also notice that GSVM-a performance is statistically equivalent to the baseline SVM one while using only half of the sensors and GSVM-p consistently gives similar results to GSVM-2.
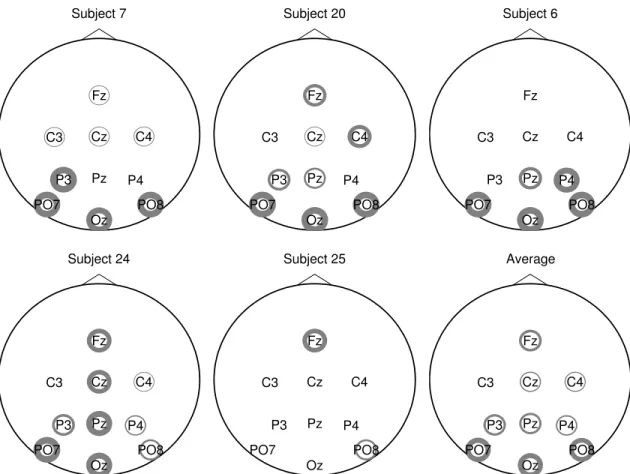
To summarize, concerning the performances of the different mixed-norm regularization, we outline that on one hand, GSVM-2 is at worst, equivalent to the baseline SVM while achieving sensor selection and on the other hand GSVM-a yields to a substantial channel selection at the expense of a slight loss of performances. A visualization of the electrodes selected by GSVM-a can be seen in Figure 2 for the EPFL dataset and in Figure 3 for the UAM dataset. Interestingly, we observe that for the EPFL dataset, the selected channels are highly dependent on the subject. The most recurring ones are : FC1 C3 T7 CP5 P3 PO3 PO4 Pz and the electrodes located above visual cortex O1,Oz and O2. We see sensors from the occipital area that are known to be relevant [22] for P300 recognition, but sensors such as T7 and C3, from other brain regions are also frequently selected. These results are however consistent with those presented in the recent literature [31, 30]. The UAM dataset uses only 10 electrodes that are already known to perform well in P300 recognition problem, but we can see from Figure 3 that the adaptive mixed-norm regularizer further selects some sensors that are
Fp1 Fp2 AF3 AF4 F7 F3 Fz F4 F8 FC5 FC1 FC2 FC6 T7 C3 Cz C4 T8 CP5 CP1 CP2 CP6 P7 P3 Pz P4 P8 PO3 PO4 O1 Oz O2 Subject 2 Fp1 Fp2 AF3 AF4 F7 F3 Fz F4 F8 FC5 FC1 FC2 FC6 T7 C3 Cz C4 T8 CP5 CP1 CP2 CP6 P7 P3 Pz P4 P8 PO3 PO4 O1 Oz O2 Subject 3 Fp1 Fp2 AF3 AF4 F7 F3 Fz F4 F8 FC5 FC1 FC2 FC6 T7 C3 Cz C4 T8 CP5 CP1 CP2 CP6 P7 P3 Pz P4 P8 PO3 PO4 O1 Oz O2 Subject 4 Fp1 Fp2 AF3 AF4 F7 F3 Fz F4 F8 FC5 FC1 FC2 FC6 T7 C3 Cz C4 T8 CP5 CP1 CP2 CP6 P7 P3 Pz P4 P8 PO3 PO4 O1 Oz O2 Subject 6 Fp1 Fp2 AF3 AF4 F7 F3 Fz F4 F8 FC5 FC1 FC2 FC6 T7 C3 Cz C4 T8 CP5 CP1 CP2 CP6 P7 P3 Pz P4 P8 PO3 PO4 O1 Oz O2 Subject 8 Fp1 Fp2 AF3 AF4 F7 F3 Fz F4 F8 FC5 FC1 FC2 FC6 T7 C3 Cz C4 T8 CP5 CP1 CP2 CP6 P7 P3 Pz P4 P8 PO3 PO4 O1 Oz O2 Average
Figure 2: Selected sensors for the EPFL dataset. The line width of the circle is proportional to the number of times the sensor is selected for different splits. No circle means that the sensor has never been selected.
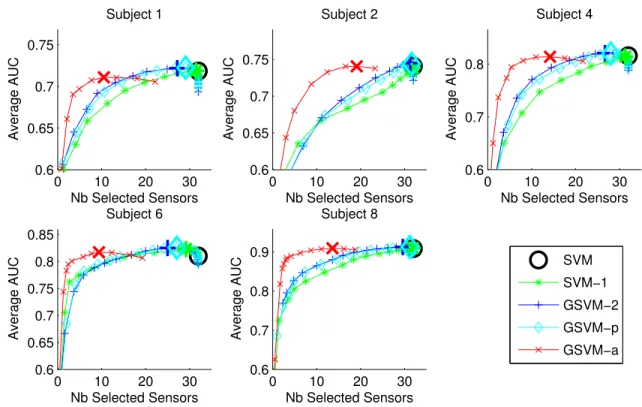
essentially located in the occipital region. Note that despite the good average performances reported in Table 2, some subjects in this dataset achieve very poor performances, of about 50 % of AUC, regardless of the considered method. Selected channels for one of these subjects (Subject 25) are depicted in Figure 3 and interestingly, they strongly differ from those of other subjects providing rationales for the poor AUC. We have also investigated the impact of sparsity on the overall performance of the classifiers. To this aim, we have plotted the average performance of the different classifiers as a function of the number of selected sensors. These plots are depicted in Figure 4 for the EPFL dataset and on Figure 5 for the UAM dataset. For both datasets, GSVM-a frequently achieves a better AUC for a given level of sparsity. For most of the subjects, GSVM-a performs as well as SVM but using far less sensors. A rationale may be that, in addition to selecting the relevant sensors, GSVM-a may provide a better estimation of the classifier parameters leading to better performances for a fixed number of sensors. As a summary, we suggest thus the use of an adaptive mixed-norm regularizer instead of an ℓ1− ℓ2 mixed-norm as in van Gerven et al. [34] when sparsity and
Fz C3 Cz C4 P3 Pz P4 PO7 PO8 Oz Subject 7 Fz C3 Cz C4 P3 Pz P4 PO7 PO8 Oz Subject 20 Fz C3 Cz C4 P3 Pz P4 PO7 PO8 Oz Subject 6 Fz C3 Cz C4 P3 Pz P4 PO7 PO8 Oz Subject 24 Fz C3 Cz C4 P3 Pz P4 PO7 PO8 Oz Subject 25 Fz C3 Cz C4 P3 Pz P4 PO7 PO8 Oz Average
Figure 3: Selected sensors for the UAM dataset. The line width of the circle is proportional to the number of times the sensor is selected for different splits. No circle means that the sensor has never been selected.
3.3.3. ErrP Dataset
The ErrP dataset differs from the others as its number of examples is small (72 examples per subject). The same experimental protocol as above has been used for evaluating the methods but only 57 examples out of 72 have been retained for validation/training. Classification performances are reported on Table 2. For this dataset, the best performance is achieved by GSVM-2 but the Wilcoxon test shows that all methods are actually statistically equivalent. Interestingly, many channels of this dataset seem to be irrelevant for the classification task. Indeed, GSVM-2 selects only 30% of them while GSVM-a uses only 7% of the channels at the cost of 10% AUC loss. We believe that this loss is essentially caused by the aggressive regularization of GSVM-a and the difficulty to select the regularization parameter λ using only a subset of the 57 training examples. Channels selected by GSVM-2 can be visualized on Figure 6. Despite the high variance in terms of selected sensors, probably due to the small number of examples, sensors in the central area seem to be the most selected one, which is consistent with previous results in ErrP [13].
0 10 20 30 0.6 0.65 0.7 0.75 Subject 1 Average AUC Nb Selected Sensors 0 10 20 30 0.6 0.65 0.7 0.75 Subject 2 Average AUC Nb Selected Sensors 0 10 20 30 0.6 0.7 0.8 Subject 4 Average AUC Nb Selected Sensors 0 10 20 30 0.6 0.65 0.7 0.75 0.8 0.85 Subject 6 Nb Selected Sensors Average AUC SVM SVM−1 GSVM−2 GSVM−p GSVM−a 0 10 20 30 0.6 0.7 0.8 0.9 Subject 8 Average AUC Nb Selected Sensors
Figure 4: Performance vs sensor selection visualisation for the EPFL dataset. The large marker corresponds to the best model along the regularization path.
3.3.4. Multi-task Learning
We now evaluate the impact of the approach we proposed in Equation (9) and (10) on the P300 datasets. We expect that since multi-task learning allows to transfer some information between the different classification tasks, it will help in leveraging classification performances especially when the number of available training examples is small. Note that the ErrP dataset has not been tested in this MTL framework, because the above-described results suggest an important variance in the selected channels for all subjects. Hence, we believe that this learning problem does not fit into the prior knowledge considered through Equation (10). We have followed the same experimental protocol as for the single task learning except that training and test sets have been formed as follows. We first create training and test examples for a given subject by randomly splitting all examples of that subject, and then gather all subject’s training/test sets to form the multi-task learning training/test sets. Hence, all the subjects are equally represented in these sets. A 3-fold nested cross-validation method is performed in order to automatically select the regularization terms (λrand λs).
Performances of the different methods have been evaluated for increasing number of training examples per subject and are reported in Figure 7. We can first see that for the EPFL dataset, MGSVM-2 and MGSVM-2s yield a slight but consistent improvement over the single-task classifiers (SVM-Full being a single classifier trained on all subject’s examples and SVM being the average performances of subject-specific classifiers).
0 5 10 0.6 0.7 0.8 0.9 Subject 1 Nb Selected Sensors Average AUC SVM SVM−1 GSVM−2 GSVM−p GSVM−a 0 5 10 0.6 0.7 0.8 0.9 Subject 7 Average AUC Nb Selected Sensors 0 5 10 0.6 0.7 0.8 0.9 1 Subject 20 Average AUC Nb Selected Sensors 0 5 10 0.6 0.7 0.8 0.9 Subject 6 Average AUC Nb Selected Sensors 0 5 10 0.6 0.65 0.7 0.75 0.8 0.85 Subject 24 Average AUC Nb Selected Sensors
Figure 5: Performance vs sensor selection visualisation for the UAM dataset. The large marker corresponds to the best model along the regularization path.
The poor performances of the SVM-Full approach is probably due to the high inter-subject variability in this dataset, which includes impaired patients.
For the UAM dataset, results are quite different since the SVM-Full and MGSVM-2s shows a significant improvement over the single-task learning. We also note that, when only the joint channel selection regularizer is in play (MGSVM-2), multi-task learning leads to poorer performance than the SVM-Full for a number of trials lower than 500. We justify this by the difficulty of achieving appropriate channel selection based only on few training examples, as confirmed by the performance of GSVM-2. From Figure 8, we can see that the good performance of MGSVM-2s is the outcome of performance improvement of about 10% AUC over SVM, achieved on some subjects that perform poorly. More importantly, while performances of these subjects are significantly increased, those that performs well still achieve good AUC scores. In addition, we emphasize that these improvements are essentially due to the similarity-inducing regularizer.
For both datasets, the MTL approach MGSVM-2s is consistently better than those of other single-task approaches thanks to the regularization parameters λr and λsthat can adapt to the inter-subject similarity
(weak similarity for EPFL and strong similarity for UAM). These are interesting results showing that multi-task learning can be a way to handle the problem related to some subjects that achieve poor performances. Moreover, results also indicate that multi-task learning is useful for drastically shortening the calibration time. For instance, for the UAM dataset, 80% AUC was achieved using only 100 training examples (less than 1
Fp1 Fpz Fp2 F7 F3 Fz F4 F8 FT7 FC3 FCz FC4 FT8 C3 Cz C4 TP7 CP3 CPz CP4 TP8 P7 P3 Pz P4 P8 O1 Oz O2 Subject 2 Fp1 Fpz Fp2 F7 F3 Fz F4 F8 FT7 FC3 FCz FC4 FT8 C3 Cz C4 TP7 CP3 CPz CP4 TP8 P7 P3 Pz P4 P8 O1 Oz O2 Subject 3 Fp1 Fpz Fp2 F7 F3 Fz F4 F8 FT7 FC3 FCz FC4 FT8 C3 Cz C4 TP7 CP3 CPz CP4 TP8 P7 P3 Pz P4 P8 O1 Oz O2 Subject 4 Fp1 Fpz Fp2 F7 F3 Fz F4 F8 FT7 FC3 FCz FC4 FT8 C3 Cz C4 TP7 CP3 CPz CP4 TP8 P7 P3 Pz P4 P8 O1 Oz O2 Subject 6 Fp1 Fpz Fp2 F7 F3 Fz F4 F8 FT7 FC3 FCz FC4 FT8 C3 Cz C4 TP7 CP3 CPz CP4 TP8 P7 P3 Pz P4 P8 O1 Oz O2 Subject 7 Fp1 Fpz Fp2 F7 F3 Fz F4 F8 FT7 FC3 FCz FC4 FT8 C3 Cz C4 TP7 CP3 CPz CP4 TP8 P7 P3 Pz P4 P8 O1 Oz O2 Average
Figure 6: Selected Sensors for the ERP dataset. The line width of the circle is proportional to the number of times the sensor is selected. No circle means that the sensor has never been selected.
minute of training example recordings). Note that the validation procedure tends to maximize performances, and does not lead to sparse classifiers for MTL approaches. As shown in Figures 2 and 3, the relevant sensors are quite different between subjects thus a joint sensor selection can lead to a slight loss of performances, hence the tendency of the cross-validation procedure to select non-sparse classifiers.
4. Conclusion
In this work, we have investigated the use of mixed-norm regularizers for discriminating Event-Related Po-tentials in BCI. We have extended the discriminative framework of van Gerven et al. [34] by studying general mixed-norms and proposed the use of the adaptive mixed-norms as sparsity-inducing regularizers. This dis-criminative framework has been broadened to the multi-task learning framework where classifiers related to different subjects are jointly trained. For this framework, we have introduced a novel regularizer that induces channel selection and classifier similarities. The different proposed approaches were tested on three different datasets involving a substantial number of subjects. Results from these experiments have highlighted that the ℓ1− ℓ2regularizer has been proven interesting for improving classification performance whereas adaptive
0 200 400 600 800 1000 0.65 0.7 0.75 0.8 0.85
Performance vs number of training points for EPFL dataset
Average AU C Nb of training points 0 200 400 600 800 1000 0.65 0.7 0.75 0.8 0.85
Performance vs number of training points for UAM dataset
Nb of training points Average AUC SVM GSVM−2 MGSVM−2 MGSVM−2s SVM Full
Figure 7: Multi-task learning performances (AUC) for the EPFL (left plot) and UAM (right plot) datasets for different number of training examples per subject.
0.6 0.65 0.7 0.75 0.8 0.85 SVM GSVM−2 MGSVM−2s SVMFull
AUC performances for the EPFL dataset
0.5 0.6 0.7 0.8 0.9 SVM GSVM−2 MGSVM−2s SVMFull
AUC performances for the UAM dataset
Figure 8: AUC performances comparison with EPFL (left plot) and UAM (right plot) for 500 training examples per subject.
mixed-norm is the regularizer to be considered when sensor selection is the primary objective. Regarding the multi-task learning framework, our most interesting finding is that this learning framework allows, by learning more robust classifiers, significant performance improvement on some subjects that perform poorly in a single-task learning context.
In future work, we plan to investigate a different grouping of the features, such as temporal groups. This kind of group regularization could be for instance used in conjunction with the sensors group in order to promote both feature selection and temporal selection in the classifier. While the resulting problem is still convex, its resolution poses some issues so that a dedicated solver would be necessary.
Another research direction would be to investigate the use of asymmetrical MTL. This could prove handy when a poorly-performing subject will negatively influence the other subject performances in MTL while
improving his own performances. In this case one would like that subject classifier to be similar to the other’s classifier without impacting their classifiers.
[1] Alamgir, M., Grosse-Wentrup, M., Altun, Y., 2010. Multi-task Learning for Brain-Computer Interfaces. In: AI & Statistics.
[2] Argyriou, A., Evgeniou, T., Pontil, M., 2008. Convex multi-task feature learning. Machine Learning 73 (3), 243–272.
[3] Bach, F., 2008. Consistency of the group Lasso and multiple kernel learning. Journal of Machine Learning Research 9, 1179–1225.
[4] Bach, F., Jenatton, R., Mairal, J., Obozinski, G., 2011. Convex optimization with sparsity-inducing norms. In: Sra, S., Nowozin, S., Wright., S. J. (Eds.), Optimization for Machine Learning. MIT Press, pp. 19–53.
[5] Beck, A., Teboulle, M., 2009. A fast iterative shrinkage-thresholding algorithm for linear inverse prob-lems. SIAM Journal on Imaging Sciences 2, 183–202.
[6] Bertsekas, D., 1999. Nonlinear programming. Athena scientific.
[7] Blankertz, B., Lemm, S., Treder, M., Haufe, S., M¨uller, K., 2010. Single-trial analysis and classification of ERP components – a tutorial. NeuroImage 56 (2), 814–825.
URL http://dx.doi.org/10.1016/j.neuroimage.2010.06.048
[8] Blankertz, B., Mueller, K.-R., Krusienski, D., Schalk, G., Wolpaw, J., Schloegl, A., Pfurtscheller, G., del R. Millan, J., Schroeder, M., Birbaumer, N., 2006. The BCI competition III: Validating alternative ap-proaches to actual BCI problems. IEEE Transactions on Neural Systems and Rehabilitation Engineering 14 (2), 153–159.
[9] Buttfield, A., Ferrez, P., Millan, J., 2006. Towards a robust bci: Error potentials and online learning. Neural Systems and Rehabilitation Engineering, IEEE Transactions on 14 (2), 164–168.
[10] Cecotti, H., Rivet, B., Congedo, M., Jutten, C., Bertrand, O., Maby, E., Mattout, J., 2011. A robust sensor-selection method for P300 brain–computer interfaces. Journal of Neural Engineering.
[11] Chapelle, O., 2007. Training a support vector machine in the primal. Neural Comput. 19 (5), 1155–1178. [12] Combettes, P., Pesquet, J., 2011. Proximal splitting methods in signal processing. Fixed-Point
[13] Dehaene, S., Posner, M., Tucker, D., 1994. Localization of a neural system for error detection and compensation. Psychological Science 5 (5), 303–305.
[14] Dornhege, G., Mill´an, J., Hinterberger, T., McFarland, D., M¨uller, K., 2007. Toward brain-computer interfacing. Vol. 74. Mit Press Cambridge, MA.
[15] Evgeniou, T., Pontil, M., 2004. Regularized multi-task learning. In: Proceedings of the tenth Conference on Knowledge Discovery and Data mining.
[16] Falkenstein, M., Hohnsbein, J., Hoormann, J., Blanke, L., 1991. Effects of crossmodal divided attention on late erp components. ii. error processing in choice reaction tasks. Electroencephalography and clinical Neurophysiology 78 (6), 447–455.
[17] Ferrez, P., Mill´an, J., 2007. Error-related eeg potentials in brain-computer interfaces. Towards Brain-Computer Interfacing. MIT Press, Cambridge, Massachusetts.
[18] Gouy-Pailler, C., Congedo, M., Brunner, C., Jutten, C., Pfurtscheller, G., 2010. Nonstationary brain source separation for multiclass motor imagery. IEEE Trans. on Biomedical Engineering 57 (2), 469–478. [19] Hoffman, U., Yazdani, A., Vesin, J., Ebrahimi, T., 2008. Bayesian feature selection applied in a P300
brain–computer interface. In: 16th European signal processing conference.
[20] Hoffmann, U., Vesin, J., Ebrahimi, T., Diserens, K., 2008. An efficient p300-based brain-computer interface for disabled subjects. Journal of Neuroscience Methods 167 (1), 115–125.
[21] Jrad, N., Congedo, M., Phlypo, R., Rousseau, S., Flamary, R., Yger, F., Rakotomamonjy, A., 2011. sw-svm: sensor weighting support vector machines for eeg-based brain–computer interfaces. Journal of Neural Engineering 8, 056004.
[22] Krusienski, D., Sellers, E., McFarland, D., Vaughan, T., Wolpaw, J., 2008. Towards enhanced P300 speller performances. Journal of neuroscience methods 167 (1), 15–21.
[23] Lal, T., Schroder, M., Hinterberger, T., Weston, J., Bogdan, M., Birbaumer, N., Scholkopf, B., 2004. Support vector channel selection in BCI. Biomedical Engineering, IEEE Transactions on 51 (6), 1003– 1010.
[24] Ledesma-Ramirez, C., Bojorges Valdez, E., Y´a˜nez Suarez, O., Saavedra, C., Bougrain, L., Gentiletti, G. G., 2010. An Open-Access P300 Speller Database. In: Fourth International Brain-Computer Interface Meeting.
[25] Liu, A., Hao, T., Gao, Z., Su, Y., Yang, Z., 2013. Non-negative mixed-norm convex optimization for mi-totic cell detection in phase contrast microscopy. Computational and Mathematical Methods in Medicine 2013, 1–10.
[26] M¨uller-Gerking, J., Pfurtscheller, G., Flyvbjerg, H., 1999. Designing optimal spatial filters for single-trial EEG classification in a movement task. Clin. Neurophys. 110, 787–798.
[27] Nunez, P. L., Srinivasan, R., 2006. Electric Fields of the Brain, 2nd Edition. New York: Oxford Univ Press.
[28] Rahimi, A., Xu, J., Wang, L., 2013. ℓp norm regularization in volumetric imaging of cardiac current
sources. Computational and Mathematical Methods in Medicine 2013, 1–10.
[29] Rakotomamonjy, A., Flamary, R., Gasso, G., Canu, S., 2011. lp-lq penalty for sparse linear and sparse multiple kernel multi-task learning,. IEEE Transactions on Neural Networks 22 (8), 1307–1320.
[30] Rakotomamonjy, A., Guigue, V., 2008. BCI competition III: Dataset II - ensemble of SVMs for BCI P300 speller. IEEE Trans. Biomedical Engineering 55 (3), 1147–1154.
[31] Rivet, B., Cecotti, H., Phlypo, R., Bertrand, O., Maby, E., Mattout, J., 2010. EEG sensor selection by sparse spatial filtering in P300 speller brain-computer interface. In: Engineering in Medicine and Biology Society (EMBC), 2010 Annual International Conference of the IEEE. IEEE, pp. 5379–5382.
[32] Salimi-Khorshidi, G., Nasrabadi, A., Golpayegani, M., 2008. Fusion of classic p300 detection methods’ inferences in a framework of fuzzy labels. Artificial Intelligence in Medicine 44 (3), 247–259.
[33] Tomioka, R., M¨uller, K., 2010. A regularized discriminative framework for EEG analysis with application to brain-computer interface. NeuroImage 49 (1), 415–432.
[34] van Gerven, M., Hesse, C., Jensen, O., Heskes, T., 2009. Interpreting single trial data using groupwise regularisation. NeuroImage 46 (3), 665–676.
[35] Yang, J., Singh, H., Hines, E. L., Schlaghecken, F., Iliescu, D. D., Leeson, M. S., Stocks, N. G., 2012. Channel selection and classification of electroencephalogram signals: An artificial neural network and genetic algorithm-based approach. Artificial Intelligence in Medicine 55 (2), 117 – 126.
URL http://www.sciencedirect.com/science/article/pii/S0933365712000292
[36] Zou, H., 2006. The adaptive lasso and its oracle properties. Journal of the American Statistical Associ-ation 101 (476), 1418–1429.
Appendix
4.1. Proof of Lipschitz gradient of the squared Hinge loss
Given the training examples {xi, yi}, the squared Hinge loss is written as :
J = n X i=1 max(0, 1 − yix⊤i w) 2
and its gradient is :
∇wJ = −2
X
i
xiyimax(0, 1 − yix⊤i w)
The squared Hinge loss is gradient Lipschitz if there exists a constant L such that: k∇J(w1) − ∇J(w2)k2≤ Lkw1− w2k2 ∀w1, w2∈ Rd.
The proof essentially relies on showing that xiyimax(0, 1 − yix⊤i w) is Lipschitz itself i.e there exists L′ ∈ R
such that
kxiyimax(0, 1 − yix⊤i w1) − xiyimax(0, 1 − yix⊤i w2)k
≤ L′kw1− w2k
Now let us consider different situations. For a given w1 and w2, if 1 − xTiw1≤ 0 and 1 − xTiw2 ≤ 0, then
the left hand side is equal to 0 and any L′ would satisfy the inequality. If 1 − xT
iw1≤ 0 and 1 − xTiw2≥ 0,
then the left hand side (lhs) is
lhs = kxik2(1 − x⊤i w2) (11)
≤ kxik2(x⊤i w1− x⊤i w2)
≤ kxik22kw1− w2k2
A similar reasoning yields to the same bound when 1 − xT
iw1 ≥ 0 1 − xTiw1 ≤ 0 and 1 − xTiw2 ≥ 0 and
1 − xT
iw2 ≥ 0. Thus, xiyimax(0, 1 − yix⊤i w) is Lipschitz with a constant kxik2. Now, we can conclude
the proof by stating that ∇wJ is Lipschitz as it is a sum of Lipschitz function and the related constant is
Pn
i=1kxik22.
4.2. Lipschitz gradient for the multi-task learning problem
For the multi-task learning problem, we want to prove that the function
m X t=1 n X i=1
L(yi,t, x⊤i,twt+ bt) + λs m X t=1 kwt− 1 m m X j=1 wjk22
is gradient Lipschitz, L(·, ·) being the square Hinge loss. From the above results, it is easy to show that the first term is gradient Lipschitz as the sum of gradient Lipschitz functions.
Now, we also show that the similarity term X t kwt− 1 m m X j=1 wjk22
is also gradient Lipschitz. This term can be expressed as
kwt− 1 m m X j=1 wjk22 = X t hwt, wti − 1 m m X i,j=1 hwi, wji = w⊤Mw where w⊤ = [w⊤
1, . . . , wm⊤] is the vector of all classifier parameters and M ∈ Rmd×md is the Hessian matrix
of the similarity regularizer of the form
M= I − 1 m m X t=1 Dt
with I the identity matrix and Dta block matrix with Dta (t − 1)-diagonal matrix where each block is an
identity matrix I with appropriate circular shift. Dtis thus a (t − 1) row-shifted version of I.
Once we have this formulation, we can use the fact that a function f is gradient Lipschitz of constant L if the largest eigenvalue of its Hessian is bounded by L on its domain [6]. Hence, since we have
kMk2≤ kIk2+ 1 m m X t=1 kDtk2= 2
the Hessian matrix of the similarity term 2 · M has consequently bounded eigenvalues. This concludes the proof that the function w⊤Mwis gradient Lipschitz continuous.
4.3. Proximal operators 4.3.1. ℓ1 norm
the proximal operator of the ℓ1norm is defined as :
proxλkxk1(u) = arg minx
1
2kx − uk
2
2+ λkxk1
and has the following closed-form solution for which each component is [proxλkxk1(u)]i= sign(ui)(|ui| − λ)+
4.3.2. ℓ1− ℓ2 norm
the proximal operator of the ℓ1− ℓ2norm is defined as :
proxλPg∈Gkxgk2(u) = arg minx
1 2kx − uk 2 2+ λ X g∈G kxgk2
the minimization problem can be decomposed into several ones since the indices g are separable. Hence, we can just focus on the problem
min x 1 2kx − uk 2 2+ λkxk2 which minimizer is 0 if kuk2≤ λ (1 − λ kuk2)u otherwise