HAL Id: hal-01179258
https://hal.archives-ouvertes.fr/hal-01179258
Submitted on 22 Jul 2015HAL is a multi-disciplinary open access archive for the deposit and dissemination of sci-entific research documents, whether they are pub-lished or not. The documents may come from teaching and research institutions in France or abroad, or from public or private research centers.
L’archive ouverte pluridisciplinaire HAL, est destinée au dépôt et à la diffusion de documents scientifiques de niveau recherche, publiés ou non, émanant des établissements d’enseignement et de recherche français ou étrangers, des laboratoires publics ou privés.
SOLEX: a tunable monochromatic X-ray source in the
1–20keV energy range for metrology
C Bonnelle, Philippe Jonnard, J.-M André, A Avila, D Laporte, H Ringuenet,
Marie-Christine Lépy, J Plagnard, L Ferreux, J. C. Protas
To cite this version:
C Bonnelle, Philippe Jonnard, J.-M André, A Avila, D Laporte, et al.. SOLEX: a tunable monochro-matic X-ray source in the 1–20keV energy range for metrology. Nuclear Instruments and Methods in Physics Research Section A: Accelerators, Spectrometers, Detectors and Associated Equipment, Elsevier, 2004, 516, pp.594-601. �10.1016/j.nima.2003.09.031�. �hal-01179258�
SOLEX: A TUNABLE MONOCHROMATIC X-RAY SOURCE IN THE 1 - 20 keV ENERGY RANGE FOR METROLOGY
C. Bonnelle , P. Jonnard, J.-M. André, A. Avila, D. Laporte†, H. Ringuenet
Laboratoire de Chimie Physique - Matière et Rayonnement, Université Pierre et Marie Curie, UMR-CNRS 7416, 11 rue Pierre et Marie Curie, F-75231 PARIS Cedex 05, FRANCE
M.C. Lépya), J. Plagnard, L. Ferreux, J.C. Protas
Bureau National de Métrologie / Laboratoire National Henri Becquerel CEA Saclay, F-91191 GIF-SUR-YVETTE Cedex, FRANCE
Abstract
A tunable monochromatic x-ray source covering the 1-20 keV energy range is described. The initial x-ray beam is obtained from a dedicated windowless x-ray tube. The energy selection is performed through a cylindrically bent crystal, used either in the reflection (Johann geometry) or in the transmission (Cauchois geometry) mode, by rotating the crystal holder by a 90° angle. Contrary to conventional geometries where the x-ray tube is fixed, here the direction of the exit beam impinging the x-ray detector is fixed. This setup is shown to be useful for various studies: high-resolution spectrometry, characterization of the response function and the efficiency of detectors and optical components, determination of transmission characteristics of different materials. Observations of the Lα line and Kα doublet from a copper anode are presented, that demonstrate the performance of this new setup.
PACS_1996 : 98-70; 87-64; 06.20-f; 32.70.Jz
Keywords : ray source, monochromator, calibration, curved-crystal spectrometer, X-ray detector
a)Author for correspondence : Marie-Christine Lépy, Laboratoire National Henri Becquerel, CEA Saclay,
F-91191 GIF-SUR-YVETTE Cedex, FRANCE
Tel : 33.1.69.08.24.48 - Fax : 33.1.69.08.26.19 - E-mail: marie-christine.lepy@cea.fr
The interest of using a monochromatic x-ray beam to characterize x-ray detectors and to perform the measurement of various parameters, such as transmission coefficient, reflectivity, has been underlined in numerous papers [1-3]. A new setup, named SOLEX (Source Of Low-Energy X-rays) has been realized with these objectives. It was conceived to fulfill the following criteria:
- it provides monochromatic radiation in the 1 - 20 keV energy range with a stable flux of several hundreds of photons per second at the exit;
- it preserves a constant exit direction, thus keeping the detector under study at the same position.
- it accommodates detectors of various sizes and weights, including or not a temperature regulation device.
- it offers an easy and permanent access.
Such x-ray source working in a large energy range from soft to hard x-rays is not commercially available. This paper describes the particularities of the specific arrangement SOLEX and its advantages for metrology.
It must be noted that such a beam could be obtained by monochromatizing the white radiation emitted by a synchrotron beam line. However, presently, no European synchrotron beam line delivers a monochromatic x-ray radiation in the whole energy range of interest. Moreover, synchrotron facilities offer poor schedule flexibility.
II. Description
The SOLEX facility basically includes a curved-crystal wavelength-dispersive spectrometer that can be switched to either the Johann (reflection mode) or Cauchois (transmission mode) geometry by a simple rotation of the crystal. This arrangement
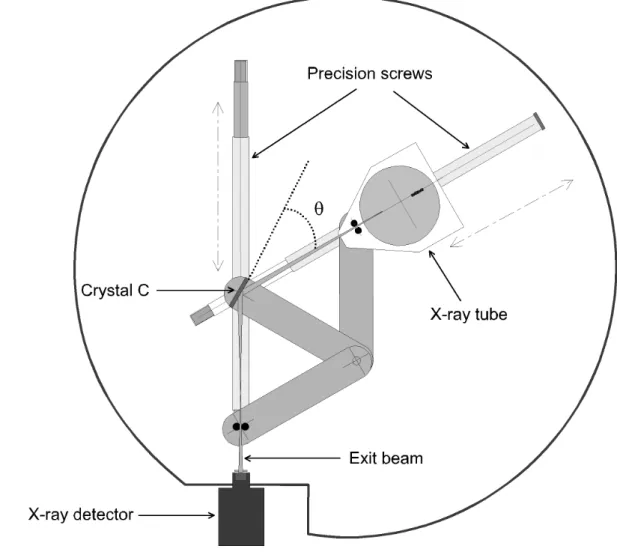
makes possible the obtention of the required large energy range from a same dispersive system. However, unlike these conventional geometries where the tube emits in a fixed direction [4,5], here this is the monochromatic radiation which is produced in a fixed direction. This is realized by installing both the tube and the crystal on a rotating system and by maintaining fixed the detector position, thus enabling the comparison of the characteristics of a wide range of detectors at given wavelengths. The apparatus is made up of four main parts: the x-ray tube, the dispersive crystal, installed on a specific mechanical design forming the spectrometer and the chamber containing the previous three elements. A general schematic view is shown in Fig. 1.
II.1. The x-ray tube
The initial x-ray beam is produced by a windowless x-ray tube especially designed for this application and built by OPEA [6].The electron emitter is a tungsten filament. A high-voltage supply applies 0-50 kV between the anode and the cathode. The current can be adjusted between 0 and 100 mA, stabilized at 10-2. The take-off angle of the exit beam is 6° with respect to the anode surface. Both the copper tube body and the anode are cooled by water circulation. The absence of window allows radiation with energy as low as a few hundreds eV to be emitted without being absorbed. The emitted radiation includes the continuous spectrum due to Bremsstrahlung, whose maximum energy depends on the applied voltage, and the characteristic x-ray lines of the anode material. Different anodes can be used (Cu, Au, Hastelloy C®, ...) that supply initial beams of
various energy distributions, thus providing x-ray lines, used as references for both energy and resolution calibrations.
II.2. The dispersive crystal
The wavelengths of the entire radiation range provided by the x-ray tube are dispersed by a cylindrical bent crystal of radius R. An adjustable slit reduces the size of the
photon beam incident on the crystal and acts as a virtual source situated on the focal, or Rowland, cylinder of radius R/2. An adjustable slit, located on the focal cylinder in the exit direction, gives the image of the source.
The wavelength dispersion follows the Bragg's law: a set of reticular planes hkl selects radiation of wavelength λ in a direction given by the Bragg angle θ, according to the relation:
n λ = 2 dhkl (1-T) sin θ
where dhkl is the spacing of the planes reflecting the incident rays, n is the order of
reflection and T is a correction term taking into account the effect due to the refractive index at the n order.
According to the required energy range, the wavelength selection is made in the reflection mode (Johann geometry), for low photon energies [7], or in the transmission mode (Cauchois geometry), for high photon energies [8]. In the Johann geometry, the reflection is made from the hkl planes parallel to the curved face of the crystal. In this case,
T = 4dhkl 2 n2 !
"2 where δ = 1 - µ and µ is the refractive index.
In the Cauchois geometry, the reflecting planes hkl are perpendicular to the faces of the crystalline sheet or slightly inclined with respect to this direction. Then, T is either equal to zero or very small with respect to unity, and the term (1-T) can be neglected. The change from Johann to Cauchois geometry is realized by rotating the crystal holder by a 90° angle around the axis of the crystal, i.e. the vertical axis passing through the crystal center and parallel to the focal cylinder axis.
Three parameters characterize a crystal spectrometer. The first is the dispersive power, ∆E/∆l = E / (R tan θ), that is to say the linear energy dispersion along the focal circle.
The dispersive power is improved by increasing the radius R and also the Bragg angle θ, i.e. by decreasing the lattice spacing d. The second parameter is the resolving power; it can be written as E/∆E, where ∆E is the width at half intensity maximum of the line seen by the spectrometer when the incident radiation is an infinitely narrow line of energy E. It depends (i) upon diffraction aberrations, i.e. diffraction curve width, the penetration of radiation in the crystal and its imperfections, (ii) upon geometrical aberrations due to the crystal dimensions, the opening of the collimating slits and also (iii) upon technical flaws. The resolving power increases with the dispersive power. Consequently, as the curvature radius is constant, the selection of a crystal with a low d improves the energy resolution. Moreover, for the same crystal, the resolving power varies along the energy range due to the above-mentioned fundamental effects, which in turn, vary with the wavelength. The third characteristic is the reflecting power of the crystal, which defines the reflected intensity, and is one of the parameters involved in the luminosity of the apparatus. The crystal must simultaneously satisfy to these various conditions.
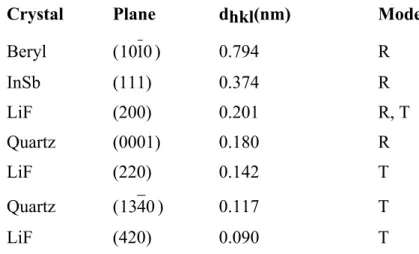
The crystals used to cover the requested energy range are indicated in Table I. They were selected according to their resolution properties and specific qualities, such as high reflectivity, high stability under the operating conditions, availability in appropriate thickness and easiness to be bent. For quartz [9] and LiF, the same slab can be used in reflection and transmission modes.
II.3 The spectrometer
The central part of this setup is the mechanical device that keeps the Bragg condition always satisfied. The relative θ - 2θ motion necessary to maintain this geometrical condition is mechanically the same as reported in Ref. [10]. However, unlike Ref. [10], in our case it is the detector rather than the source that is in a fixed position. Consequently, these are the x-ray source and the crystal that are moved. The x-ray source and its entrance slit, the axis normal to the bent crystal and the exit slit are all connected by radial arms. To achieve a good mechanical stability; the movements of the spectrometer arms take place in the horizontal plane. To compensate the weight of the x-ray tube, this last rests on Teflon skates moving on a sliding way.
The Bragg angle is set by adjusting the distances between the entrance slit and the crystal on the one hand, and the crystal and the exit slit on the other hand. This is achieved using two precision screws, attached to both axes, that are turned by two stepping motors (360 000 steps/revolution), thus moving the two mobile arms. This setup allows to vary the Bragg angle between 15° and 70°. Finally, the crystal orientation can be changed (reflection or transmission) and optimized to achieve the maximum reflectivity by using a third rotation motor.
II.4 The chamber
The x-ray tube and the 0.40 m radius curved crystal spectrometer are placed in a large circular vacuum chamber (diameter: 1 m, height: 0,40 m), whose stainless steel walls (thickness: 10-2 m) serve also as a shield against scattered radiation. To ensure the safe functioning of the windowless tube in the chamber, a very low pressure (10-5 - 10-4 Pa) is required. A low pressure is also necessary for the spectrometer in the soft x-ray range. This is achieved by using two primary pumps relayed by three turbomolecular pumps once the internal pressure is low enough (50 Pa). The turbomolecular pumps are
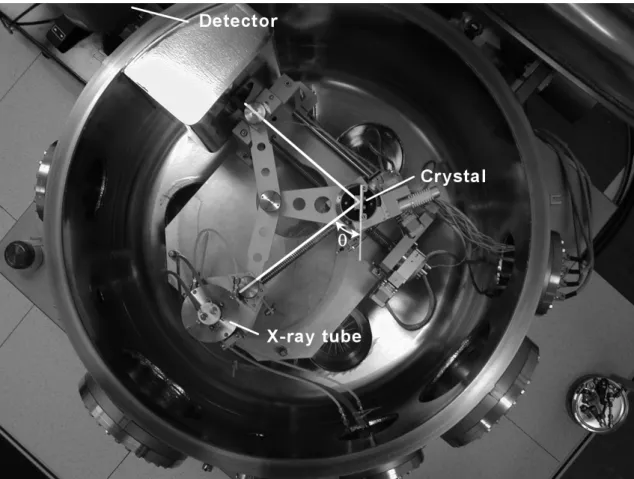
water-cooled and the pressure value is permanently checked. The detector is fixed on the chamber with a flange, its sensitive part being under vacuum behind the exit slit of the spectrometer. An internal view of the vacuum chamber is displayed in Fig. 2.
II.5 The data acquisition and moving control
The whole experiment is controlled by microcomputer using LabVIEW™ software: the command panel controls the pumping, the spectrometer motion, the safety (pressure level, water-cooling, high voltage supply). For each experiment, the first step is the pumping: once the required low-pressure level is reached, the high voltage supply is authorized. Presently, this step is the only manual control: the high voltage and current intensity of the x-ray tube are adjusted by the user. Finally, when the x-ray tube is working, the control unit drives the motors motion and the detector acquisitions. The control unit allows the selection of a specific position or a scanning range, either in motor increment units or, once the setup has been calibrated (see section III.1), directly in eV. Both the number of acquisitions and the counting time are selected by the user, according to the plan of his experiment. Each counting is automatically displayed on the control screen and the whole sequence can be stored on an external file.
III. Performances
Various detectors are connected to the fixed exit of the vacuum chamber. For the first tests, we have used conventional semiconductor detectors (cf. section IV), high purity germanium (HPGe), silicon-lithium (Si(Li)) and silicon-drift detector (SDD) [11] working with moderate cooling provided by Peltier element, avoiding the constraining use of liquid nitrogen. These detectors are used either in counting mode or in energy-dispersive mode. In both cases, the counting rate is dependent on the energy range, the tube high-voltage and current, the luminosity of the spectrometer, i.e. the crystal reflectivity and the band pass width, and the detector efficiency. In the absence of a
characteristic line, a few tens to a few hundreds counts per second are easily obtained at each position of the entire energy range. Thus, studies such as detector response function characterization can be performed from the Bremsstrahlung, i.e. at any given wavelength. When a characteristic x-ray line is selected, the counting rate attains several tens of thousands counts per second.
III.1 Energy calibration and resolution power
For the energy and resolution calibrations, the detector is used in the counting mode and both the tube and the crystal are moved to perform an energy scanning, what gives the emitted spectral distribution. The emitted intensity is a function of the crystal reflectivity. For a given crystal, this function does not affect the connection between the spectrometer position and the energy selection. The calibration is performed by using the characteristic x-ray lines of the anode: for example copper L lines are used around 900 eV (reflection mode, Fig. 3) and K lines in the 8 to 9 keV energy range (transmission mode, Fig. 4). The energy of the lines (in eV) versus the spectrometer position (in motor increments units) gives the calibration factors that can be used later to drive the x-ray source directly in electronvolts.
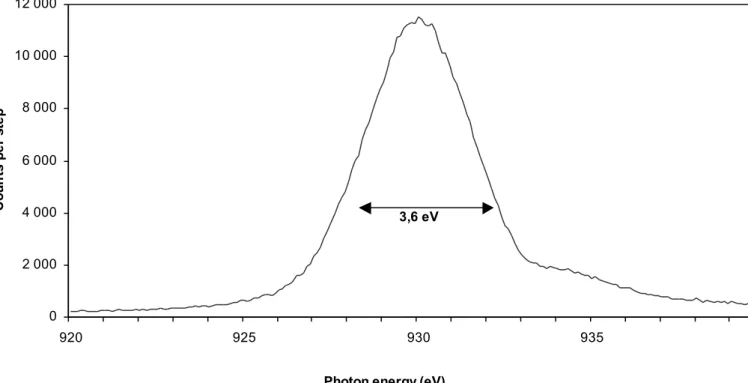
The energy resolution of the source characterizes the monochromaticity of the radiation. It is determined from the broadening of a peak with respect to its true width. An example of the resolution calibration in the low energy range is displayed in Fig. 3: the peak obtained with the beryl crystal in the reflection mode corresponds to the Lα emission of copper, at 930 eV. Its experimental full width at half maximum, Lobs, is 3.6 eV; it includes the Lα emission natural width, Ltrue, estimated as 3.2 eV. By using the formula
convenient for spectrometers with a curved perfect crystal and for x-ray emissions of Lorentzian shape [12], we obtain a resolving power of about 700 in this spectral range. Let us note that the Cu Lα emission is due to the transitions from the Cu 3d valence band. Contrary to the transitions between inner shells, its shape is not Lorentzian and it is not discussed here.
In the reflection mode, one expects that the shape of the instrumental function is close to a rectangle and the main broadening effects are due to the diffraction curve of the supposedly perfect crystal and to the dimensions of the crystal. Thus, for Cu Lα, the resolution could be about 2500. In our present experimental conditions, the instrumental function includes a supplementary term. We assume that it arises from crystal aberrations due to the curvature.
In Fig. 4, we present the Cu Kα1,α2 emissions of copper, at 8048 and 8028 eV, observed with the (1340) quartz in the transmission mode. The energy difference between the Kα2 and Kα1 lines is 20.3 ± 0.1 eV, in agreement with the 2p1/2-2p3/2 spin-orbit splitting. The intensity ratio Kα1/Kα2 is 1.96 ± 0.01 in good agreement with the 1.95 theoretical value. Their full widths at half maximum, Lobs, are respectively 4.5 and 4.9 eV. Their natural widths, Ltrue, are estimated to 2.1 and 2.5 eV. By using the above relation, we obtain a resolving power better than 2000.
In the transmission mode with the reflecting planes perpendicular to the crystal faces and the Bragg angle larger than 30°, the instrumental function is totally dominated by the broadening due to the thickness of the crystal. In our experimental conditions (θ ≈ 41°), this term is larger than the width of the exit slit. Consequently, the broadening is governed by the slit width and the shape of the instrumental function is close to a Gaussian. Indeed, the Cu Kα1 and Kα2 lines can be fitted by Voigt functions (Fig. 4). In this fit, the widths of the Lorentz components are equal to the natural widths
of the Kα1 and Kα2 lines and the widths of the gauss components are respectively 1.5 and 1.6 eV.
III.2 Spectral purity
The spectral purity of the beam reaching a semiconductor detector has been determined by using it in the energy dispersive mode. This measurement allows measuring the intensity of the background relative to that of the main peak, the intensity of eventual harmonics and the presence of parasitic peaks.
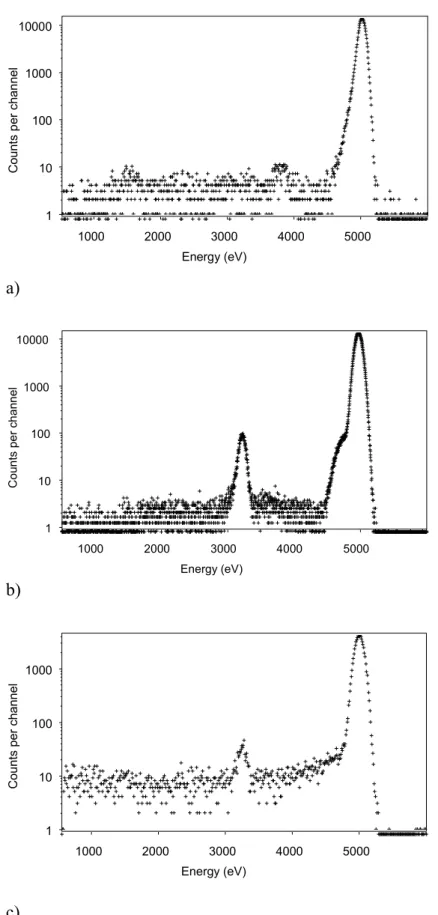
A spectrum corresponding to the 5 keV selected photon energy, obtained from a copper anode excited under 8 keV, dispersed by a (200) LiF crystal and recorded with a high purity germanium detector, is plotted in Fig. 5a. The main peak is superimposed upon a relatively high background, due to non-dispersed scattered radiation reaching directly the detector. This radiation was reduced significantly in a second step, in which the detector was equipped with a lead collimator. However, Pb M fluorescence lines and also a peak due to aluminum still appear (Fig. 5b). The latter was identified as coming from the crystal holder. To improve the spectral purity, the lead collimator was replaced by a copper collimator and the crystal holder was covered with kapton. The resulting spectrum is displayed in Fig 5c. The peak-to-background ratio is now 130. This can be compared to the spectrum obtained at the same energy with the double crystal monochromator of the LURE synchrotron facility, equipped with a very small collimator and the same detector, where the peak-to-background ratio was 150(Fig 5d).
IV. Advantages of SOLEX
The SOLEX monochromatic x-ray source setup includes three running modes allowing performing different studies. First, owing to the source spectral resolution of a few thousands or better, SOLEX can be used as a high-resolution spectrometer. Second, in
selection conditions are planned. For example, the tunable monochromatic radiation is used to characterize the response function of various detectors and optical components and also to determine transmission characteristics of various materials. Last, equipped with a reference detector, the whole system will be used to perform absolute efficiency calibration of x-ray detectors.
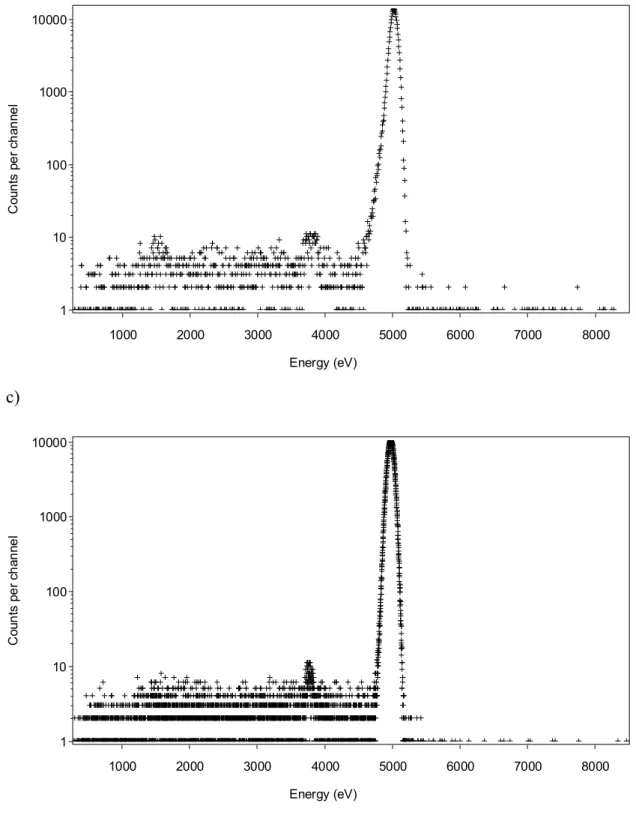
A first qualitative study has been conducted to compare the response function of various detectors. A 5 keV monoenergetic photon beam is supplied from the x-ray tube equipped with the copper anode by using a (200) LiF crystal. At this energy, only Bremsstrahlung is emitted. The experimental energy resolution of the source is a few eV, i.e. some hundredths of the detector resolution (115-150 eV). Thus, the spectrum recorded with the semiconductor detector for the selected incident energy gives the response function of the detector to monochromatic radiation. Such an example is displayed in Figure 6. The exit beam is successively recorded with the HPGe detector (Figure 6a), the Si(Li) detector (Figure 6b) and the SDD (Figure 6c). Resolution, and peak and background shapes can be directly compared. The first two spectra are characterized by a low background. The best resolution is obtained with the HPGe detector (115 eV). The Si(Li) detector resolution is not so good (135 eV) and the peak shows a feature towards the low energy side that requires to be taken into account for the accurate processing of complex spectra. In contrast, the SDD shows a high background and a resolution of only 170 eV, making it convenient for counting measurements but unsuitable for accurate spectrometry requirements.
This first example shows that the luminosity of the tunable monochromatic source SOLEX is high enough to make the comparison of the response function of detectors possible from the Bremsstrahlung, in all the 1-20 keV energy range. These determinations are made in excellent conditions with respect to the purity of the radiation. Metrological studies, in particular concerning the determination of absorption coefficients [13], are in progress with the help of this high flexibility laboratory setup.
Acknowledgements
This paper is dedicated to the memory of Daniel Laporte. The realization of SOLEX has been possible thanks to the financial support from the Bureau National de Métrologie. We are grateful to C. Dulieu, I. Jarrige and J. Thirion for their experimental help.
References
[1] F. Scholze, and G. Ulm, Nucl. Instrum. Methods Phys. Res. A 339, 49 (1994). [2] M.C. Lépy, J. Plagnard, P. Stemmler, G. Ban, L. Beck, and P. Dhez, X-Ray Spectrom. 26, 195 (1997).
[3] F. Scholze, and M. Procop, X-Ray Spectrom. 30, 69 (2001).
[4] C. Bonnelle, F. Vergand, P. Jonnard, J.-M. André, P. Avila, P. Chargelègue, M.-F. Fontaine, D. Laporte, P. Paquier, A. Ringuenet, and B. Rodriguez, Rev. Sci. Instrum. 65, 3466 (1994).
[5] J.-M. André, M. Kefi, A. Avila, P. Couillaux, and C. Bonnelle, Rev. Sci. Instrum. 58, 374 (1987).
[6] www.opea.com.
[7] H.-H. Johann, Z. Phys. 69, 185 (1931). [8] Y. Cauchois, J. Phys. (Fr.) VII, 3, 320 (1932).
[9] E. Obaranova, M. M. Stepanenko, and N. R. Pereira, Rev. Sci. Instrum. 72, 1416 (2001).
[10] C.F. Hague, and D. Laporte, Rev. Sci. Instrum. 51, 621 (1980).
[11] P. Lechner, C. Fiorini, R. Hartmann, J. Kemmer, N. Krause, P. Leutenegger, A. Longoni, H. Soltau, D. Stötter, R. Stötter, L. Struder, and U. Weber, Nucl. Instrum. Methods Phys. Res. A 458, 281 (2001).
[12] Y. Cauchois, and C. Bonnelle, Atomic Inner-Shell Processes, Vol. II, Experimental
Approaches and Applications, edited by B. Crasemann, Academic Press (1975).
Table I: Characteristics of the crystals used in SOLEX. d is the reticular distance. R and
T are the reflection and transmission modes, respectively.
Crystal Plane dhkl(nm) Mode
Beryl (10 ) 10 0.794 R InSb (111) 0.374 R LiF (200) 0.201 R, T Quartz (0001) 0.180 R LiF (220) 0.142 T Quartz (1340) 0.117 T LiF (420) 0.090 T
Figure captions
Figure 1: Top view of the mechanism in the reflection mode. θ is the Bragg angle. C is the center of the crystal; the vertical axis in C is the rotation axis of the crystal.
Figure 2: Top view of the SOLEX apparatus.
Figure 3: Lα emission from the copper anode with the (10 ) beryl crystal in reflection 10 mode. (High voltage = 5 kV, current = 20 mA, photon energy step = 0.1 eV, counting time = 2 s per step).
Figure 4: Kα doublet from the copper anode with the (1340) quartz crystal in transmission mode (dots) fitted by Voigt functions (solid lines). (High voltage = 15 kV, current = 70 mA, photon energy step = 0.1 eV, counting time = 20 s per step).
Figure 5: Energy dispersive spectrum at 5 keV from the copper anode with the (200) LiF crystal in reflection mode. a) initial spectrum; b) detector equipped with a lead collimator; c) detector equipped with a copper collimator and kapton on the crystal holder; d) spectrum obtained at the LURE synchrotron radiation facility.
Figure 6: Response function of various detectors to a 5 keV monochromatic radiation: a) HPGe detector; b) Si(Li) detector; c) SDD.
Figure 1: Top view of the mechanism in the reflection mode. θ is the Bragg angle. C is the center of the crystal; the vertical axis in C is the rotation axis of the crystal.
Figure 3: Lα emission from the copper anode with the (10 ) beryl crystal in reflection 10 mode. (High voltage = 5 kV, current = 20 mA, photon energy step = 0.1 eV,
counting time = 2 s per step). 0 2 000 4 000 6 000 8 000 10 000 12 000 920 925 930 935
Photon energy (eV)
C o u n ts p e r ste p 3,6 eV
Energy (eV) 8 020 8 030 8 040 8 050 8 060 100 200 400 600 800 1000 2000 3000 4000 5000 6000 7000 8000
Figure 4: Kα doublet from the copper anode with the (1340) quartz crystal in transmission mode (dots) fitted by Voigt functions (solid lines). (High voltage = 15 kV, current = 70 mA, photon energy step = 0.1 eV, counting time = 20 s per step).
Co u n ts p e r st e p
Energy (eV) Co un ts p e r ch an ne l 1000 2000 3000 4000 5000 6000 7000 8000 1 10 100 1000 10000 a) Energy (eV) Co un ts p e r ch an ne l 1000 2000 3000 4000 5000 6000 7000 8000 1 10 100 1000 10000 b)
Energy (eV) Co un ts p e r ch an ne l 1000 2000 3000 4000 5000 6000 7000 8000 1 10 100 1000 10000 c) Energy (eV) Co un ts p e r ch an ne l 1000 2000 3000 4000 5000 6000 7000 8000 1 10 100 1000 10000 d)
Figure 5: Energy dispersive spectrum at 5 keV from the copper anode with the (200) LiF crystal in reflection mode. a) initial spectrum; b) detector equipped with a lead collimator; c) detector equipped with a copper collimator and kapton on the crystal holder; d) spectrum obtained at the LURE synchrotron radiation facility.
Energy (eV) C ou nt s p er ch an ne l 1000 2000 3000 4000 5000 1 10 100 1000 10000 a) Energy (eV) Co un ts p e r ch a nn e l 1000 2000 3000 4000 5000 1 10 100 1000 10000 b) Energy (eV) C ou nts pe r ch an ne l 1000 2000 3000 4000 5000 1 10 100 1000 c)
Figure 6: Response function of various detectors to a 5 keV monochromatic radiation: a) HPGe detector; b) Si(Li) detector; c) SDD.