HAL Id: halshs-03215888
https://halshs.archives-ouvertes.fr/halshs-03215888
Preprint submitted on 3 May 2021HAL is a multi-disciplinary open access
archive for the deposit and dissemination of sci-entific research documents, whether they are pub-lished or not. The documents may come from teaching and research institutions in France or abroad, or from public or private research centers.
L’archive ouverte pluridisciplinaire HAL, est destinée au dépôt et à la diffusion de documents scientifiques de niveau recherche, publiés ou non, émanant des établissements d’enseignement et de recherche français ou étrangers, des laboratoires publics ou privés.
Political Cleavages and the Representation of Social
Inequalities in Japan 1953-2017
Amory Gethin
To cite this version:
Amory Gethin. Political Cleavages and the Representation of Social Inequalities in Japan 1953-2017. 2021. �halshs-03215888�
World Inequality Lab – Working Paper N° 2021/10
Political Cleavages
and the Representation
of Social Inequalities in Japan
1953-2017
Amory Gethin
1
Political Cleavages and the Representation of Social Inequalities in Japan, 1953-2017
Amory Gethin†
Abstract
This paper exploits political attitudes surveys conducted between 1953 and 2017 to document long-run changes in the structure of political cleavages in Japan. I analyze the transformation of Japan’s one-party dominant system from the hegemony of the Liberal Democratic Party (LDP) to the disintegration of conservative forces into multiple splinter parties and the rise of a new centrist coalition. Throughout Japan’s contemporary history, persisting divides based upon foreign policy and remilitarization have remained a key axis of democratic conflicts. These divides have coincided with lower-educated voters showing greater support for the LDP and other conservative parties, which have generally advocated expansion of military spending and overseas interventions. The strength of the LDP in postwar decades also relied on a unique coalition of poorer rural areas and business elites, while socialist and communist parties found greater support among urban unionized wage earners. Urbanization, declining rural-urban inequalities, the expansion of education, and the subsequent fragmentation of the party system have put an end to this equilibrium and have been associated with a remarkable “depolarization” of Japan’s political space. I also analyze the long-run transformation of generational divides in relation to changing attitudes to war memory and political parties.
† Paris School of Economics – World Inequality Lab. I wish to thank Kentaro Asai, David Chiavacci, Sébastien Lechevalier, Thanasak Jenmana, Clara Martínez-Toledano, Thomas Piketty, Carmen Schmidt, and Yoshida Toru for their comments and advices. I am also grateful to the teams of the Social Science Japan Data Archive, the Japanese Election Studies, the Comparative Study of Electoral Systems, and the Inter-University Consortium for Political and Social Research for making the data exploited in this paper available.
2
1. Introduction
Following a long tradition in political science, a number of recent studies have used historical post-electoral surveys to document how the changing structure of political cleavages relates to the evolution of income, wealth, and educational inequalities in the long run (see for instance Piketty 2018; Kosse & Piketty 2020; Gethin 2021). One of the objectives of these studies has been to construct unified series on the structure of the vote by income, wealth, education, and other sociodemographic characteristics of voters, to better contextualize the recent rise of identity politics and the dynamics of party systems in light of broader historical transformations.
This paper contributes to this growing body of research by studying the evolution of the structure of political cleavages in Japan between 1953 and 2017. Party identifications in Japan are partly the legacy of its unique democratic transition, which took place under US occupation between 1945 and 1951. This transition, by imposing the renunciation of military buildup and the establishment of US military bases throughout the archipelago, gave to foreign policy and the question of remilitarization an exceptional importance in comparative perspective, perhaps only paralleled by Hong Kong, Taiwan, and South Korea, three other “electoral regimes” where political integration has taken an overwhelming importance in structuring party competition in recent years (Durrer de la Sota & Gethin 2021).
The party system that emerged in the 1950s, opposing conservative parties to socialists and communists, therefore differed significantly from the class-based party systems visible during the same period in Western Europe. While the mobilization of the working class was far from being insignificant, it came with marked oppositions between urban educated elites and poorer rural areas, as well as with divides between generations expressing deep ideological differences in attitudes towards war memory and the colonization of Southeast Asia between 1920 and 1945. In this context, the Liberal Democratic Party (LDP) succeeded in becoming the single dominant party during the entire 1955-1993 period by aggregating a diverse
3
electorate consisting of low-income rural households, lower-educated voters, and business elites.
The political and economic turmoil associated with the “lost decade” of the 1990s coincided with the end of the LDP’s hegemony and a lasting transformation of the party system. Yet, as the analysis of voting behaviors will show, it is in the long run that the structure of Japanese political cleavages changed profoundly. While education has remained a significant determinant of party identification until today, this is not the case of income, union membership, age, or rural-urban location, which have gradually lost most of their explanatory power. This form of “depolarization” of Japan’s political space is paradoxical given the context of growth slowdown, rising inequalities, and job insecurity that has characterized the recent decades. It both reveals and contributes to sustaining the growing dissatisfaction of citizens towards political parties, as evidenced by the decline in electoral turnout visible since the beginning of the 1990s.
I first discuss the transformation of party politics in Japan from the dominance of the LDP to the fragmentation of the party system since the 1990s (section 2). After presenting the data sources used in this paper (section 3), I document in section 4 how urbanization, industrialization and tertiarization have transformed the structure of social inequalities in Japan. I then show how the decline of the LDP has been associated with the persistence of educational divides (section 5), together with a gradual alteration of the rural-urban (section 6), class (section 7), and generational (section 8) cleavages that had structured the Japanese party system in the early postwar decades. Section 9 concludes.
2. Democratization and the Fragmentation of Japan’s Party System
In their seminal study of political attitudes in Japan in 1976, Scott Flanagan and his co-authors document the evolution of cleavage politics in the country since the end of World War II (Flanagan et al. 1991). One of the specificities of Japanese democratization, they argue, is that a variety of factors hindered the development of a class cleavage. When the foundations
4
of contemporary Japanese democracy were laid down at the end of World War II under US occupation, Japan was not at its first democratic experience. A first step towards a democratic system can be traced back to the Meiji era (1868-1912), during which the country experienced with a parliamentary system based on property qualification, comparable to those existing in Europe during the nineteenth century. The 1890 legislative elections had thereby allowed slightly more than one percent of the population to elect representatives to the National Diet.1
Following a series of reforms lowering the tax threshold required to vote, the “Taisho crisis” of 1912 opened a new wave of democratization: the refusal of the Seiyukai party to obey an imperial edict requiring it to collaborate with the conservative minister Katsura Tarō accelerated the extension of political rights. Male universal suffrage was adopted in 1925 and came with the continuation of the two-party system opposing the Minseito and the Seiyukai until 1937. Overall, in the first four decades of the twentieth century, the political mobilization of the masses was however limited by the maintenance of a two-party system featuring these two catch-all parties, which both aggregated the interests of land owners, business elites and bureaucrats. The alternation of these two parties in power, as well as the suppression of communist parties and the minority position of industrial workers, contributed to inhibit class divides.2
The military defeat in 1945 and the US occupation that followed laid down the foundations for democratic competition in the country for several decades. During the occupation, a number of major reforms were conducted, including the promulgation of a new constitution, substantial land redistribution, recognition of labor unions, and guarantees for freedom of
1 See Reischauer (1997), chapter 9. The National Diet is the bicameral legislature of Japan, created in 1889 following the adoption of the Meiji Constitution. It is composed of the House of Representatives and the House of Councillors. The two houses are directly elected since the adoption of the 1947 postwar constitution.
2 Notice however that the Minseito and its predecessor the Kenseikai, were more liberal and labor-oriented than the Seiyukai. The Minseito was also stronger in urban constituencies than the Seiyukai, so that the rural-urban cleavage that dominated postwar Japanese politics was already apparent in the Meiji era. See for instance Ramseyer and Rosenbluth (1993).
5
speech. Among other factors, the land reform conducted between 1946 and 1950 succeeded in reallocating agricultural land to many small independent farmers, eroding class sentiments in rural areas. Large landowners received assets paying a fixed nominal return as compensation, but their value was rapidly devaluated by postwar inflation. The US administration also restructured the big business conglomerates (zaibatsu) that had controlled a significant part of the Japanese economy since the Meiji period. Finally, Japan’s late industrialization also played an important role in limiting the strength of socialist and communist movements. In 1950, still 50 percent of the labor force was engaged in the primary sector, compared for instance to 25 percent in Western Germany. This gave greater salience to the industrial-agrarian cleavage and limited the power of the working class, whose electoral strength would never reach that observed in Western democracies in the 1950s and 1960s (Schmidt 2003). The newly created Japan Socialist Party and Japan Communist Party thus failed to defeat the conservative forces that were in large part inherited from the pre-war era.
While class cleavages were not as significant as in Western democracies, the first twenty years of the postwar democracy were characterized by strong divides over social values. In that respect, Japan’s structure of political competition was quite different from that observed in Western democracies at the same period: “In this confrontation between the conservatives and the leftists, the issue was neither capitalism nor socialism; nor was the underlying cleavage determined by class. Rather, the differences arose from a conflict between the traditional values of emperor worship, emphasis on hierarchy and harmony, and belief in a militarily strong nation – all of which were strongly supported in the prewar era – and the ‘modern’ values of the postwar era of individualism, equality, and fear of military build-up and war.” (Watanuki 1991). This explains why both analysts and voters in Japan have generally preferred to differentiate parties along a “progressive-conservative” scale rather than a “left-right” scale (Jou & Endo, chapter 2). In the economic dimension, finally, by defending the interests of farmers and fishers, building ties with agricultural cooperatives and actively redistributing the fruits of economic growth to rural areas, the Liberal Democratic Party was quick to establish its dominance over the countryside (Chiavacci 2010).
6
One of the remarkable achievements of the LDP, however, was to remain in power despite the major structural changes Japan underwent. In particular, industrialization and urbanization eroded the party’s traditional electoral base, as the share of farmers in the overall population decreased rapidly throughout the second half of the twentieth century. Economic growth played an important role in explaining the party’s adaptation to these transformations. Conservatives were able to avoid political confrontation with socialist and communist parties by emphasizing policies focusing on the economy. Under the “Yoshida Doctrine” promulgated by prime minister Shigeru Yoshida (1946-1947 and 1948-1954), the government focused on postwar reconstruction and modernization. This emphasis on economic development was then pursued under Hayato Ikeda’s (1960-1964) “income-doubling plan” aiming to double personal incomes within ten years, an objective which was reached in only seven. Japan’s exceptional economic growth until the 1990s, together with low income inequality, were important factors enabling the continuation of conservative forces’ success (Kabashima 1984).
At the end of the 1980s, the golden age of economic growth came to an end with the burst of speculative bubbles in real estate and stock markets, which were followed by the “lost decade” of the 1990s, a period of economic stagnation. The economic crisis, together with the multiplication of bribery scandals involving high-ranked LDP politicians, led to the formation of new parties calling for political reforms, such as the Japan Renewal Party (JRP) and the Japan New Party (JNP), both founded by former members of the LDP. The domination of the LDP over Japanese politics ended in 1993, when an eight-party coalition government was formed, headed by JNP leader Hosokawa Morihiro. However, the coalition broke apart as soon as April 1994. What followed was a period of political chaos, with continuous creation, merging, and fragmentation of new progressive and conservative parties. At the beginning of the 2000s, Japanese politics finally seemed to be moving more decisively towards a two-party system, as the Democratic Party of Japan (DPJ) managed to bring together a growing number of politicians from the center-right and the center-left, including former LDP members such as Ichirō Ozawa and Yukio Hatoyama (Jou 2009).
7
In 2009, the DPJ eventually won a majority of seats, based on a program primarily focused on putting an end to LDP dominance, and pushing for political processes, rather than bureaucrats, to play a greater role in policy-making (Yoshida 2016). However, public dissatisfaction with its inability to fight the economic crisis and to implement the policies it had promised, together with perceived mismanagement of the Fukushima nuclear disaster (Kushida 2014), quickly sent the party back to the opposition in 2012. The return of the Liberal Democratic Party’s dominance was confirmed in the last general election of 2017. Taking advantage of the context of the North Korea missile threat, Shinzo Abe called a snap election, and the Democratic Party of Japan separated into two factions, which would themselves undergo further splits and mergers: the Constitutional Democratic Party of Japan, which joined other center-left parties, and the more liberal Party of Hope, which joined the new Democrat Party for the People in 2018. Therefore, the rise of the DPJ in the 2000s did not lead to the stabilization of a two-party system, and opposition to the LDP still seems to be largely unstable and unconsolidated at the time of writing.
Three important differences separating the first party system of the 1955-1993 period to Japan’s “Second Postwar Party System” are also worth mentioning (Hrebenar 2015). First, the 1994 reform of the voting system has changed the rules of the electoral game. Under the old single non-transferable vote (SNTV) system, each constituency elected multiple members of parliament, which encouraged candidate-centered elections and contributed to factionalism as multiple candidates from the same party had to compete in the same district. The reform replaced it by a mixed electoral system with single-member districts, in which about two-thirds of seats are allocated on a first-past-the-post basis (289 in 2017), and about a third of seats are allocated using proportional representation (176 in 2017). This change has encouraged a shift from clientelistic redistribution to programmatic platforms, but the persisting lack of partisan identities in Japan has resulted in weaker linkages between voters and parties and have contributed to make the new party system more volatile (McElwain 2015).
8
Secondly, all governments since 1993 have been coalition governments. In 2009, for instance, the DPJ allied with the SDP and three other small parties, while the LDP has ruled in coalition with the Kōmeitō since 1999. The Kōmeitō, founded in 1964 to promote the interests of the
Soka Gakkai Buddhist religious movement, has received a stable 10 to 15 percent of votes in
most elections since then (see Figure 1). The LDP and Kōmeitō hold vastly different positions on key issues, and were harsh opponents from the 1960s to the 1990s. In particular, while the LDP has championed increased defense spending and attempts to revise the Article 9 “peace clause” of the Constitution, the Kōmeitō’s core principles have on the contrary always been pacifism and social welfare. The LDP-Kōmeitō alliance is based on electoral complementarity rather than policy views: by coordinating nominations in single-member districts, the LDP has been able to gain sufficient seats to form governments, and the Kōmeitō has been able to send members to the Diet in the new electoral system (Liff & Maeda 2019).
Thirdly, the second postwar party system has come with the surge of floating voters, making political outcomes more uncertain and partisan affiliations even more unclear. The share of non-partisans, who do not recognize themselves as either conservative or progressive, increased from 16 percent in 1966 to 60 percent in the early 2000s (Schmidt 2008).* On top of this detachment of voters, parties themselves have also converged in some dimensions of their programs. Just before the 2009 elections, for instance, as much as 69 percent of voters believed that there was no big difference in the policies proposed by the DPJ and LDP (Yoshida 2016). Concomitantly, electoral turnout has decreased significantly since the 1990s, and voters have remained highly disconnected from the political process. In 2012, for instance, opinion polls revealed that half of the Japanese electorate were not interested in the political campaign (Hrebenar & Nakamura 2015).
3. Data Sources and Methodology
I now turn to the analysis of a set of political attitudes surveys conducted in Japan between 1953 and 2017. Contrary to many Western countries, no comparable post-electoral surveys have been conducted in Japan since the beginning of democratization. The first large
9
nationally representative survey on political attitudes, the Japanese National Election Study, dates back to 1967. Two other series of surveys have been conducted since then: the Japanese Election Study of 1976 (JABISS) and the Japanese Election Study (JES) conducted more systematically since 1983 until today. I complete these data sources with a number of other pre- and post-electoral polls.3
While combining these different data sources does allow us to identify a number of interesting long-run evolutions, one should stress that there are important limits in the comparability and quality of the surveys used in this paper. Most surveys have small sample sizes and they do not use comparable questionnaires or sampling methodologies. The Japanese Election Studies are the only surveys collecting detailed data on the sociodemographic characteristics of respondents, while polls only provide a narrow set of characteristics such as age, gender or rural-urban locations. I therefore choose to study decade-to-decade changes and focus on a limited number of variables, which are consistently available throughout our period of interest.
Another difficulty has to do with changes in the party system itself. From the 1950s to 1993, one can clearly oppose the LDP to the progressive Japan Socialist Party and Communist Party. The multiplication of LDP splinter parties from 1993 onwards makes it more complex to identify groups of parties consistently, given that the decline in the share of votes received by the LDP is partially due to pure separation effects as dissident members formed their own political organizations. This is for example the case of the Japan Renewal Party (Shinseitō) founded by 44 LDP members of Parliament in 1993, or of the Your Party (Minna no tō) created in 2009 by Yoshimi Watanabe, former secretary of State. I attempt to account for these party dynamics by grouping together a larger set of conservative parties, including the
3 See appendix Table A1. All the data sources used in this paper are available from the Japanese Social Science Data Archive (SSJDA: https://ssjda.iss.u-tokyo.ac.jp/Direct/). The 1967 Japanese Election Study and the 1976 JABISS are also available from the Inter-university Consortium for Political and Social Research (https://www.icpsr.umich.edu/icpsrweb/). Unfortunately, it was not possible to get access to the first 1984 Japanese Election Study.
10
LDP, the Kōmeitō after 1999, the JNP, the Shinseitō, the New Frontier Party, and the Your Party in the analysis – referred to for simplicity as “LDP and other conservative parties” in what follows. As I show in the appendix, the resulting group of parties has received between 40 and 60 percent of popular votes since 1960, with no clear downward or upward trend over the period.4
4. Japan’s Changing Electorate and the Transformation of Inequality
Before studying the evolution of voting behaviors in the past seventy years, it is important to put these changes into historical perspective, especially given the importance of education, geography and generational divides in accounting for party identifications. As shown in Table 1, there have been substantial transformations in the structure of Japan’s electorate since the end of World War II, with a massive expansion of education, a significant ageing of the population, and a gradual migration of people from rural areas to the cities. The share of the electorate holding university degrees rose from 6 percent in 1953 to 25 percent in the last decade,5 while the share of adults living in towns and villages has decreased from more than one third in the 1960s to only a tenth of the population in the 2010s. Economic development, finally, has boosted life expectancy, which combined with low fertility has transformed Japan into one of the countries in the world with the highest share of elderly citizens. The share of adults older than sixty years old has grown from 11 percent in 1953 to 44 percent in the 2010s, while the proportion of those aged below 40 has decreased from 56 percent to 21 percent.
4 See appendix Figure A1. An exception is the 1953 election for which the LDP did not yet exist, so I group together the Liberal Party (Jiyutō), the Reformist Party (Kaishintō) and independent candidates in opposition to the socialist and communist parties. The results presented in this paper are strongly robust to considering only the LDP, or only the LDP and Kōmeitō.
5 The definition of tertiary education excludes technical colleges, and the analysis focuses on the voting-age population, which explains why the share of university graduates may be lower than the figures provided by international sources such as the OECD.
11
Key to our analysis, economic growth has also coincided with important changes in the structure of social inequalities. First, urbanization has not only increased the share of people living in cities, it has also led to a decline in the rural-urban income gap. The political attitudes surveys used in this paper can only portray this transformation very imperfectly, but they still reveal the extent of the change. In 1967, I estimate that more than 50 percent of the poorest ten percent of Japanese earners lived in rural areas, compared to only 24 percent of the top ten percent. Meanwhile, 6 percent of the poorest decile were urban residents, compared to 28 percent of the top decile. In 2013, by contrast, no significant relationship between rural-urban locations and income was visible: about 45 to 50 percent of both low-income earners and the upper middle-class lived in big cities.6
The relationship between income and education in Japan has remained more persistent over time, but it has still changed in relation to the long-run expansion of education. In 1967, the composition of income groups was tightly linked to education: about 77 percent of low-income earners had not studied beyond primary school, as compared to 40 percent of top ten percent earners. In 2013, there was still a positive and significant correlation between education and income: only 5 percent of adults in the bottom decile were university graduates as compared to over a third of those in the top decile. The higher education level of the majority of the population has however implied a greater concentration of the lower educated at the bottom of the income scale: still about 40 percent of the poorest ten percent were primary educated in 2013, as compared to 19 percent in the second decile and about 6 percent of the tenth decile.7
There have also been substantial changes in overall economic inequalities in Japan. In the 1950s and 1960s, Japan was seen as a highly equal society: thanks to the policies implemented during the occupation and to the social movements that flourished in the 1950s, the “Japanese compromise” of the 1955-1973 period relied on a generally fair distribution of
6 See appendix Figures A5 and A6 for the composition of household income deciles by rural-urban location. 7 See appendix Figures A7 and A8 for the composition of household income deciles by education.
12
economic prosperity. In this context, Japan was generally pictured as embodying a new ideological model, a society freed from the class antagonisms which structured political conflicts in other industrialized countries. This view was in large part constructed and reinforced by the media and the political establishment (Chiavacci 2008), but it did resonate to some extent with the everyday experiences of Japanese citizens.
Since the economic crisis of the 1990s, important changes in the Japanese model have instigated new dynamics. In the context of the crisis, political circles started to question Japan’s social institutions, emphasizing the need to focus on economic recovery rather than on equality of outcomes and opportunities (Chiavacci 2010). More generally, Japan went through a longer-run process of liberalization of its coordinated economy, from the financial liberalization and privatization reforms of Yasuhiro Nakasone (1982-1987) to the flexibilization of the labor market conducted under Prime Ministers Hashimoto (1996-1998), Obuchi (1998-2000), and Koizumi (2001-2006) (Lechevalier 2016). Available evidence points to a rise in income inequality coinciding with these changes: the share of income received by the top ten percent rose from 33 percent in 1980 to 42 percent in 2010, so that inequality in Japan is still lower than in the United States but higher than in Europe (see Piketty 2020, Figure 1.6).
The exact causes of rising inequality are Japan are still debated, but a number of stylized facts have been identified by existing studies. In contrast to the United States, we do not observe a massive enrichment of top incomes, but rather a strong rise in poverty. This increase had multiple interrelated causes, including rising unemployment, an increase in the number of single-headed households, population ageing, a growing number of non-regular workers, a re-segmentation of the Japanese labor market driven by globalization and deindustrialization, lower tax progressivity, and the absence of correcting mechanism such as social welfare or redistribution (Lechevalier 2016b; Tashibanaki 2006). In any case, it is clear that Japan has become an increasingly divided society.
13
5. Education, an Early and Stable Marker of Diverging Values
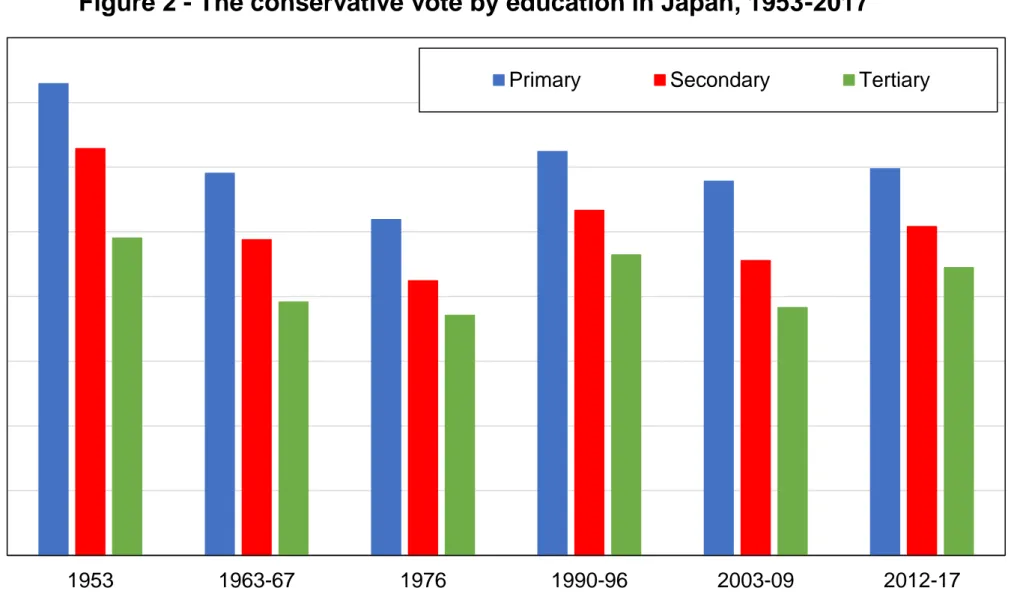
Let us start by documenting the link between education and party choice. Figure 2 shows the share of votes received by the LDP and other conservative parties by education level between 1953 and 2017. Education appears to be a strong and persistent determinant of support for progressive parties. In 1953, more than 70 percent of primary-educated voters supported liberals and reformists compared to less than 50 percent of those holding a university degree. In the 2010s, this gap had slightly decreased but was still significant, with about 60 percent of lower-educated voters voting for the LDP-Kōmeitō coalition compared to less than 45 percent of university graduates. The general expansion of education, combined with this very stable pattern of votes by education level, explains the long-run decline in the overall vote share received by the conservatives, from 75 percent of popular votes in 1953 to 46 percent in 2017.
Figure 3 plots the difference between the share of university graduates voting for conservative parties and the share of voters without a university degree supporting these parties between 1953 and 2017, before and after controlling for the effect of other sociodemographic variables. The gap has decreased significantly but has remained negative throughout the period: tertiary-educated voters used to be more likely to vote for the opposition by 20 percentage points in 1953, and by about 8 percentage points in the 2010s. Accounting for rural-urban location, income, age, gender, employment status and union membership does reduce differences in voting behaviors between education groups and makes the trend slightly flatter in recent decades. As we will see, this is because younger and urban citizens tend to both be more educated and be more likely to vote against the conservatives. Yet, education does still have a significant independent and persistent effect over the entire period.8
8 We show in the appendix that the effect of education is robust to accounting for the changing structure of the population: top 10 percent educated voters have been more likely to vote for conservative parties by 5 to 10 percentage points after controlling for other variables, with no clear trend over the period (see appendix Figures A9 and A20).
14
It is therefore remarkable that in contrast to most Western democracies, where lower-educated voters formed the core electorate of social democratic, socialist, and communist parties in the postwar decades and have now shifted to voting for conservative parties (Piketty 2018; Kosse & Piketty 2020; Toledano & Sodano 2021; Gethin 2021; Bauluz, Gethin, Martínez-Toledano & Morgan 2021; Durrer de la Sota, Gethin & Martínez-Martínez-Toledano 2021), higher-educated voters in Japan consistently supported the progressive opposition to the LDP as early as the 1950s. The very particular process of postwar Japanese democratization can potentially explain this unique pattern. In Europe and the United States, the progression of the welfare state was in large part the outcome of the extraordinary mobilization of the working class; in Japan, social and economic equality was imposed from outside by the United States and reinforced by war destruction. In this particular context, divisions between political parties focused on the question of remilitarization, article 9 of the Constitution, and the role of the emperor, with socialist and communist parties advocating unconditional pacifism and the maintenance of the new democratic order. Such values were at the time much more widespread in cities and among university graduates.
Foreign policy and war memory have not only been core foundations of Japanese democracy: they have remained a key dimension of contemporary political conflicts. This was notably evident from the controversies surrounding the visits of conservative Prime Ministers to the Shinto shrine of Yasukuni, where over a thousand individuals designated as war criminals by the International Military Tribunal for the Far East at the end of World War II are enshrined. Partisan identities therefore remain in part determined by symbolic, memorial, and diplomatic issues today, with opposition parties being more supportive of an official recognition of the war crimes committed by Japan in the 1930s and 1940s, as well as of limitations to military spending or overseas interventions. Prime Minister Shinzo Abe repeatedly acknowledged that rewriting article 9 was one of his most important lifetime political goals, a revision that the Kōmeitō and opposition parties have successfully blocked until now (Liff & Maeda 2019).
15
6. The Persistence and Transformation of Rural-Urban Divides
Highly populated rural areas were at the heart of conservative domination of Japanese politics in the decades following the end of World War II. How have divisions between cities and the countryside changed in the long-run process of urbanization and political change? Figure 4 plots the share of votes received by conservative parties by rural-urban location between 1963 and 2017. The rural-urban cleavage appears to be as strong as that based on education. In the 1960s and 1970s, more than 60 percent of voters living in rural areas supported the LDP compared to less than 50 percent of big cities. Between the 1970s and the 2010s, however, these gaps seem to have declined significantly, as the share of votes received by conservative parties gradually decreased in rural areas while it remained relatively stable in urban areas. Therefore, the long-run decline of the conservatives seems to have been in part driven by rural voters turning towards the opposition.
The declining importance of territorial factors in explaining Japanese politics can be interpreted as the result of both the demographic transition and the ability of the LDP to adapt and diversify its support base accordingly. The conservatives of the postwar decades had managed to maintain their domination in large part thanks to their strong ties in rural constituencies. This was facilitated by tight relationships with agricultural cooperatives, as well as by a patronage system structured by networks linking election candidates and their constituencies, the kōenkai, which allowed the redistribution of the fruits of economic growth from the cities to rural areas (McElwain 2015).
As urbanization inevitably eroded its voting base, the LDP was forced to adapt its policies and political priorities towards the new majority consisting of urban wage earners and professionals if it was to remain in power. This necessary rupture with the past was notably visible in the reforms implemented in the 1990s and 2000s, which put an end to the economic privileges of rural districts. It culminated in the reforms implemented by Junichirō Koizumi at the beginning of the 2000s, including postal privatization and substantial cuts in public work programs, which hurt the rural areas but were popular among the urban youth (Chiavacci
16
2012). Put differently, rapid urbanization implied that the rural-urban cleavage in Japan was to disappear, or unavoidably imply the transition of the LDP from a dominant party to a party representing the interests of an increasingly narrow minority. It was the ability of the LDP to partially reinvent itself and gain significant support among the growing metropolitan areas which enabled it to keep winning elections until today.
7. The Declining Representation of Economic Inequalities
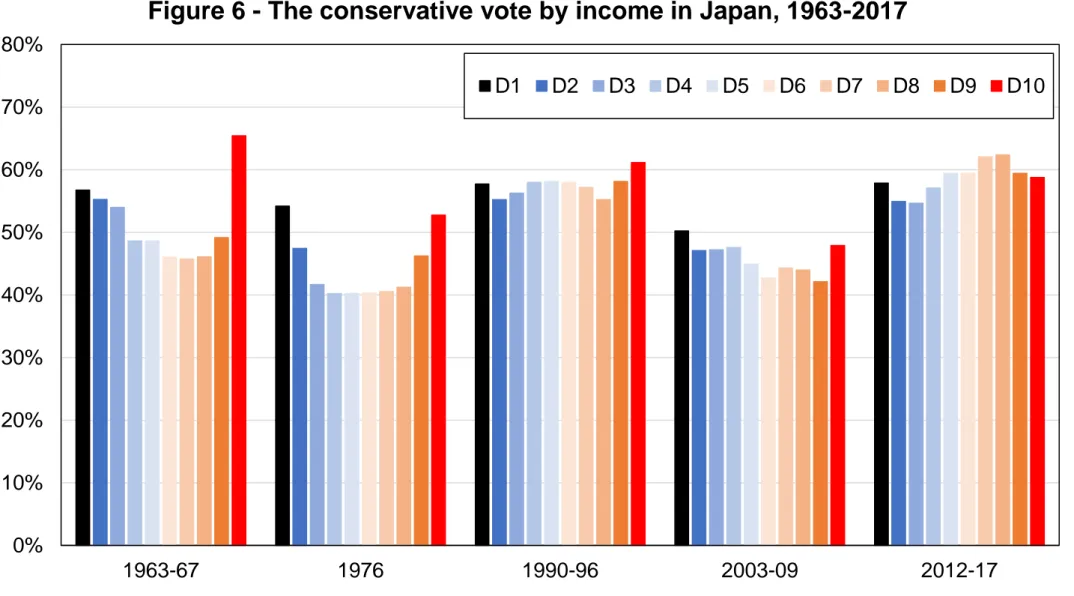
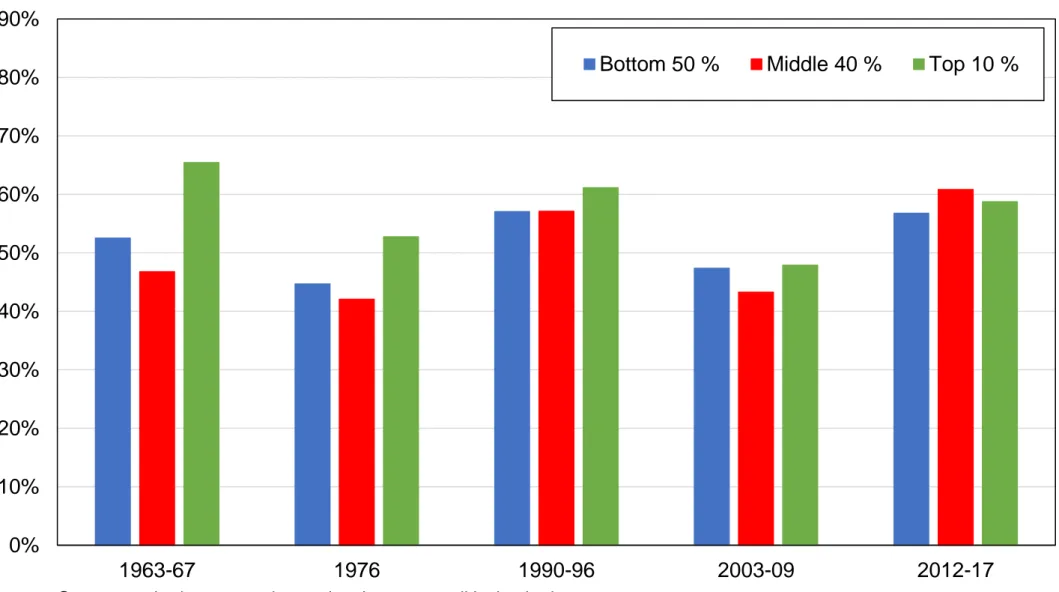
The conservatives’ strength was thus historically driven by mass support in rural areas and among the primary educated, who were significantly poorer than the rest of the population, especially in the early postwar decades. I now turn to explicitly analyzing the role played by economic status. Figure 6 shows the share of votes received by the LDP, the Kōmeitō and other conservative parties by income decile. The relationship between income and vote choice in Japan was clearly non-linear in the 1960s and 1970s. In 1963 and 1967, the ruling party was supported by 65 percent of low-income voters and 70 percent of top ten percent earners, as compared to only 50 percent of voters located at the middle of the income distribution. This pattern directly reflects the very specific structure of Japanese political conflicts crystallized by the 1955 system. The Liberal Democratic Party was, on the one hand, highly successful at receiving large majorities in rural areas, which at the time gathered the majority of the poor. On the other hand, it was also supported by business elites in a context of sustained growth driven by a symbiosis between the State, bureaucrats, and large corporations. Socialist and communist parties, meanwhile, received stronger support from the urban middle class.
While the quality of available data does not allow us to precisely identify the timing of the change, it appears clearly that this relationship gradually vanished at the end of the twentieth century. In 1976, the LDP and Kōmeitō were still relatively more supported by both high-income and low-high-income voters, but this was not the case anymore in the 1990s. Since then, the link between income and support for conservative parties has not shown any consistent pattern: in 2013, the last year for which income is available, support for the LDP, Kōmeitō and Your Party was not significantly different across income groups.
17
Figure 7 shows that this transformation is not driven by other transformations, by showing the difference between the share of top 10 percent earners and the share of bottom 90 percent voting for conservative parties between 1963 and 2017, before and after controlling for location, education, age, gender, employment status, and union membership. The relatively higher support for conservative parties among top earners has gradually disappeared in past decades: in the 1960s, they were more likely to support the LDP and Kōmeitō by about 15 percentage points, compared to almost exactly zero in the 2010s. Controlling for other variables does not significantly affect the level or the trend, which shows that the relative shift of top-income voters from the ruling party to the opposition was also independent from demographic transitions or the decline of the rural-urban cleavage documented in previous sections. While significant declines in the effect of income on party support are visible in a number of developed countries such as the UK (Piketty 2018) or Australia (Gethin 2021), such a complete absence of bias of top income earners towards conservative parties is relatively unique when compared to contemporary Western democracies.
This remarkable depolarization of class divides is also visible when considering other available measures of socioeconomic status. Union members, for instance, were less likely to support the LDP by over 40 percentage points in 1960s compared to only 10 percentage points in the 2010s (see Figure 8).9 The same trend emerges when considering support for the
LDP among wage earners, homeowners (the only highly imperfect measure of wealth available), and individuals self-identifying as belonging to the “upper classes” of society.10 Voting differences across occupational categories similarly seem to have diminished over the past decades: in 1963, for instance, 35 percent of blue collars, 62 percent of the
9 See also appendix Figure A14. Union membership has declined substantially, from about 50 percent in the early 1950s to less than 17 percent in 2019: see Japan Institute for Labour Policy and Training, https://www.jil.go.jp/kokunai/statistics/timeseries/html/g0701_01.html (accessed June 15, 2020).
10 A number of surveys have asked respondents to locate their position in the economic hierarchy from “lower” or “working” class to “upper” or “higher” class, so I combine these scales to derive a simple measure of voters belonging to the “top 10 percent” in terms of subjective class.
18
employed, and 74 percent of farmers voted for the LDP; in 2014 and 2017, farmers were still strongly supportive of the LDP and other conservative parties, but differences across all other occupational categories were almost completely insignificant. I also find no evidence that the rise of part-time workers has led to any new form of political cleavage: in 2017, the shares of managers, full-time wage earners, and part-time wage earners voting for the conservatives were barely distinguishable at 46 percent, 44 percent, and 43 percent respectively.11
These results provide clear evidence that the political representation of inequality in Japan has changed profoundly. Several possible mechanisms may explain this phenomenon. On the one hand, existing progressive parties broadened their electorate by moderating their platform. An example of such moderation was the transformation of the Japan Socialist Party into the Social Democratic Party in 1996, which coincided with the end of the Cold War. On the other hand, new parties created in the 1990s, including the DPJ formed in 1998, arguably took advantage of the 1990s and 2008 economic crises – together with corruption charges within the LDP and general discontent towards neoliberal policies – to benefit from their status of new party and attract the LDP’s traditional electoral base. Dealignment was therefore at least partially the result of the DPJ competing with the LDP on equal grounds by defending similar views on economic and social policy.
8. From Meiji to Millennials: The Decline of Generational Divides
I conclude this paper by looking at the evolution of generational differences in support for the conservatives. Japan’s early postwar party system was strongly structured by conflicts over traditional and modern values, attitudes towards the war and colonization of Asia, and support for peace and democratization. These conflicts had a particularly strong generational component: as much as 90 percent of those aged 60 or above supported the conservatives in 1953.12 Key to these divides were the diverging social experiences the different generations
11 See appendix Tables A3 and A4. 12 See appendix Figure A16.
19
had lived through. Individuals aged 50 or above in 1953 had been brought up during the Meiji era and had witnessed the expansion of the Japanese empire and the success of the first years of the war. In contrast, younger generations had primarily lived through the traumatic experience of military obsession, atomic bombing, and surrender.
As shown in Figures 9, this cleavage seems to have very gradually disappeared. The long-run transition of Japan’s democracy from a dominant party system to a fragmented party system was therefore not only the result of urbanization and educational expansion. It was also driven by the ageing and eventual disappearance of the supporters of the old imperial and military order. Arguably, the transformation of the generational cleavage also contributed to reinforce the decline of other cleavages, as dealignment happened faster among new cohorts.
Figure 10 depicts this transition from another angle by plotting the share of votes received by the conservatives by generation (by decade of birth) between 1953 and 2017. In all elections, a very strong and persistent divide opposed voters enfranchised during the Meiji period to those who started voting in the postwar era. This generational effect, however, has followed a very clear reversal: the 1970s, 1980s, and 1990s generations have been much more likely to vote for conservative parties than those born in the 1940s and 1950s.
At least two complementary factors may explain this transformation. First, age gaps in Japan have never been only about values: they also have had an economic component, as the Japanese welfare state became one of the most elderly-friendly in the developed world. Since the 1980s, pension reforms have eroded redistribution mechanisms from the younger cohorts to the elderly, which might partially explain why new generations are now less biased against the LDP (Aldrich & Kage 2011). Secondly, there is evidence that younger generations have had very different visions of political parties and issue orientations than their elders since the 1990s. In 2012, respondents older than 60 clearly identified strong differences between the LDP and the Japan Communist Party on a progressive-conservative scale, but this was not the case of younger individuals. In fact, the communists were seen as more conservative than the Japan Restoration Party or the Your Party among respondents in their twenties and thirties.
20
This suggests that new generations may be perceiving the party system very differently, notably in terms of reformism rather than progressivism, and may be voting for parties based on their ability to instigate changes rather than on their ideological positions on foreign policy or economic issues. This “poses a momentous challenge to students of Japanese politics: the consensus about party and policy positions, long shared in both academic and journalistic circles, holds true only in the minds of the middle-aged and elderly citizens” (Jou & Endo 2016).
9. Conclusion: The Dealignment and Growing Uncertainty of Japanese Politics
This paper documented the factors underlying the long-run transformation of Japan’s political cleavages. Demographic changes were a key driver of the transition from the dominant party system led by the Liberal Democratic Party to an unstable party system opposing the LDP, the Democratic Party of Japan, and a number of satellite opportunistic parties. Urbanization, educational expansion, and the ageing of the population were powerful transformations pushing the decline in LDP support. Yet, the party was able to remain in power throughout most of this period by broadening its appeal to younger voters, urban areas, and the middle class. The unavoidable implications of this conversion was a dealignment of traditional divides. Concomitantly, and perhaps partly as a result of this adaptation, opposition parties were pushed to moderate their platforms and compete with the LDP on similar proposals.
This declining representation of economic and social identities in Japan is paradoxical given the rise in job precariousness and inequalities since the beginning of the lost decade of the 1990s. Japanese voters have become economically and socially more divided, yet growing inequalities have not been associated with the emergence of a class cleavage. Neither have they been compensated by strong pressures from new left-wing parties to implement the policies required to curb these trends. It is all the more puzzling given that popular support for redistribution in Japan is high in comparative perspective, and is much higher among low-income individuals, two facts that suggest that a clear class-based social cleavage exists (Kambayashi, Lechevalier & Jenmana 2020; see also Gethin 2018, Figure 1.1). Surprisingly,
21
this social cleavage does not seem to have been politicized until today. Quite the contrary: even if the Democratic Party of Japan based part of its appeal on bringing back the “Japanese model” of shared prosperity, its policies were in practice not very different from that of the LDP. In contrast with the Japanese Socialist Party, which was clearly located to the left of the political spectrum, the DPJ was composed of heterogeneous conservative and progressive elements from both the LDP and former opposition parties. Its separation into the Constitutional Democratic Party and the Party of Hope in 2017 revealed the failure of the temporary two-party system which emerged in the 2000s.
Changes in Japan’s political space and rising income inequality since the 1990s also coincided with a significance decrease in political participation: turnout in the general elections of 2014 was the lowest in Japanese contemporary history, reaching 53 percent, and it did not exceed 54 percent in 2017. This is consistent with the hypothesis that ideological depolarization and the declining representation of social cleavages in Japanese politics have led a growing number of voters to lose interest in the democratic process. Will the volatility of Japan’s “Second Postwar Party System” be sustainable? Given the LDP’s capacity to gain back popular support in recent years, whether cleavage structures will come back to what they were until the end of the 1980s or whether Japan’s transition to a “divided society model” will eventually lead to new class-based divides remains an open question.
22
References
D. P. Aldrich and R. Kage, “Japanese Liberal Democratic Party Support and the Gender Gap: A New Approach,” British Journal of Political Science 41, no. 4 (2011): 713–733.
L. Bauluz, A. Gethin, C. Martínez-Toledano, and M. Morgan, “Historical Political Cleavages and Post-Crisis Transformations in Italy, Spain, Portugal and Ireland, 1953-2020” (WID.world Working Paper, 2021).
D. Chiavacci, “From Class Struggle to General Middle-Class Society to Divided Society: Societal Models of Inequality in Postwar Japan,” Social Science Japan Journal 11, no. 1 (2008): 5–27.
D. Chiavacci, “Divided Society Model and Social Cleavages in Japanese Politics: No Alignment by Social Class, but Dealignment of Rural-Urban Division,” Contemporary Japan 22, no. 1 (2010): 47–74.
D. Chiavacci, “Divided Society Model”. See also J. Kingston, Contemporary Japan: History,
Politics, and Social Change since the 1980s (Wiley-Blackwell, 2012), 110-111.
C. Durrer de la Sota and A. Gethin, “Inequality, Identity, and the Structure of Political Cleavages in South Korea, Taiwan, and Hong Kong, 1996-2016” (WID.world Working Paper, 2021).
C. Durrer de la Sota, A. Gethin, and C. Martínez-Toledano, “Party System Transformation and the Structure of Political Cleavages in Austria, Belgium, the Netherlands, and Switzerland, 1967-2019” (WID.world Working Paper, 2021).
S. C. Flanagan, S. Kohei, I. Miyake, B. Richardson, and J. Watanuki, The Japanese Voter (Yale University Press, 1991).
A. Gethin, Cleavage Structures and Distributive Politics (Paris School of Economics, 2018)
A. Gethin, “Political Cleavages, Class Structures, and the Politics of Old and New Minorities in Australia, Canada, and New Zealand, 1963-2019” (WID.world Working Paper, 2021).
23
A. Gethin, C. Martínez-Toledano, and T. Piketty, Political Cleavages and Social Inequalities.
A Study of Fifty Democracies, 1948-2020 (Harvard University Press, forthcoming).
R. J. Hrebenar, “The Second Postwar Party System and the Future of Japanese Politics”, in
Party Politics in Japan, Edited by R. J. Hrebenar and A. Nakamura (Routledge Contemporary
Japan Series, 2015).
R. J. Hrebenar and A. Nakamura, Party Politics in Japan (Routledge Contemporary Japan Series, 2015).
W. Jou, “Electoral Reform and Party System Development in Japan and Taiwan: A Comparative Study”, Asian Survey 49, no. 5 (2009): 759–785.
W. Jou and M. Endo, Generational Gap in Japanese Politics: A Longitudinal Study of
Political Attitudes and Behavior (Palgrave Macmillan, 2016).
I. Kabashima, “Supportive Participation with Economic Growth: The Case of Japan,” World
Politics 36, no. 3 (1984): 309–338.
R. Kambayashi, S. Lechevalier, and T. Jenmana, “Decomposing Preference for Redistribution Beyond the Trans-Atlantic Perspective” (Hitotsubashi University Institute of Economic Research Discussion Paper no. 707, 2020).
F. Kosse and T. Piketty, “Electoral Cleavages and Socioeconomic Inequality in Germany 1949-2017” (WID.world Working Paper, 2020).
K. E. Kushida, “The Fukushima Nuclear Disaster and the DPJ: Leadership, Structures, and Information Challenges During the Crisis,” Japanese Political Economy 40, no. 1 (2014): 29– 68.
S. Lechevalier, The Great Transformation of Japanese Capitalism (Routledge, 2016).
L. Lechevalier, “The ‘Re-segmentation’ of the Japanese Labour Market: Investigating the Impact of Industrial Dynamics” in Social Inequality in Post-Growth Japan: Transformation
24
during Economic and Demographic Stagnation, ed. D. Chiavacci and C. Hommerich
(Routledge, 2016).
A. P. Liff and K. Maeda, “Electoral Incentives, Policy Compromise, and Coalition Durability: Japan’s LDP–Kōmeitō Government in a Mixed Electoral System,” Japanese Journal of
Political Science 20, no. 1 (2019): 53–73.
C. Martínez-Toledano and A. Sodano, “Changing Party Systems, Socio-Economic Cleavages, and Nationalism in Northern Europe, 1956-2017” (WID.world Working Paper, 2021).
K. M. McElwain, “Party System Institutionalization in Japan,” in Party System
Institutionalization in Asia: Democracies, Autocracies, and the Shadows of the Past, ed. A.
Hicken and E. M. Kuhonta (Cambridge University Press, 2015), 74–107.
T. Piketty, “Brahmin Left vs Merchant Right: Rising Inequality & the Changing Structure of Political Conflict (Evidence from France, Britain and the US, 1948-2017)” (WID.world Working Paper, 2018).
T. Piketty, Capital and Ideology (Harvard University Press, 2020).
J. M. Ramseyer and F. M. Rosenbluth, Japan’s Political Marketplace (Harvard University Press, 1993).
E. O. Reischauer, Histoire du Japon et des Japonais (Seuil, 1997).
C. Schmidt, “Social Cleavages, Voter Alignment, and Dealignment in Japan,” Hitotsubashi
Journal of Social Studies 35, no. 2 (2003): 63–77.
C. Schmidt, “Japan’s New Party System: Characteristics and Future Perspectives,” in
Germany and Japan After 1989. Reform Pressures and Political System Dynamics, ed. R.
Czada and K. Hirashima (ISS Research Series no. 33, 2008), 1–22.
T. Tashibanaki, “Inequality and Poverty in Japan,” The Japanese Economic Review 57, no. 1 (2006): 1–27.
25
Watanuki, “Social Structure and Voting Behaviour”, in S. C. Flanagan, S. Kohei, I. Miyake, B. Richardson, and J. Watanuki, The Japanese Voter (Yale University Press, 1991).
T. Yoshida, “L’Alternance de 2009 au Japon : La Mutation d’un Régime de Parti Dominant ?” in Politiques de l’Alternance : Sociologie des Changements de Politiques, ed. P. Aldrin, L. Bargel, N. Bue, and C. Pina (Editions du Croquant, 2016), 137–161.
0%
10%
20%
30%
40%
50%
60%
70%
80%
1945 1950 1955 1960 1965 1970 1975 1980 1985 1990 1995 2000 2005 2010 2015
Share
of
v
ot
es
(%)
Figure 1 - Election results in Japan, 1946-2017
Liberal Democratic Party / Liberals/Democrats (pre-1958)
Japan Socialist Party / Social Democratic Party
Japan Communist Party
Democratic Party of Japan / Constitutional Democratic Party
Komeito / New Komeito
Other conservative parties
Source: author's computations using official election results.
Note: the figure shows the share of votes received by selected political parties or groups of parties in general elections held in
0%
10%
20%
30%
40%
50%
60%
70%
80%
1953
1963-67
1976
1990-96
2003-09
2012-17
Figure 2 - The conservative vote by education in Japan, 1953-2017
Primary
Secondary
Tertiary
Source: author's computations using Japanese political attitudes surveys.
Note: the figure shows the share of votes received by the Liberal Democratic Party (LDP) and other conservative parties by
education level. The conservative vote has been concentrated among primary-educated voters since the 1950s, a cleavage that has persisted until the 2010s.
-25
-20
-15
-10
-5
0
5
10
1953
1963-67
1976
1990-96
2003-09
2012-17
Figure 3 - The educational cleavage in Japan, 1953-2017:
between decline and persistence
Difference between (% of university graduates) and (% non-univ.) voting LDP / Other conservative
After controlling for location
After controlling for location, income, age, gender, employment status, union membership
Source: author's computations using Japanese political attitudes surveys.
Note: the figure shows the difference between the share of university graduates and the share of non-university graduates voting for
the Liberal Democratic Party and other conservative parties, before and after controls. In 1953, university graduates were 20 percentage points less likely to vote conservative, compared to 8 percentage points over the 2012-2017 period.
0%
10%
20%
30%
40%
50%
60%
70%
80%
1963-67
1976
1990-96
2003-09
2012-17
Figure 4 - The conservative vote by degree of urbanization
in Japan, 1963-2017
Towns and villages
Medium-sized cities
Big cities
Source: author's computations using Japanese political attitudes surveys.
Note: the figure shows the share of votes received by the Liberal Democratic Party (LDP) and other conservative parties by
rural-urban location. In 1963-1967, the LDP received 60% of votes in rural areas, compared to 37% in big cities. The difference in conservative votes between cities and rural areas has declined over time.
-22
-20
-18
-16
-14
-12
-10
-8
-6
-4
-2
0
2
4
6
8
10
1963-67
1976
1990-96
2003-09
2012-17
Figure 5 - The decline of the rural-urban cleavage in Japan, 1963-2017
Difference between (% of big cities) and (% of other areas) voting LDP / Other conservative
After controlling for income, education, age, gender, employment status, union membership
Source: author's computations using Japanese political attitudes surveys.
Note: the figure shows the difference between the share of big cities and the share of other cities and rural areas voting for the
Liberal Democratic Party (LDP) and other conservative parties, before and after controls. The vote share received by conservative parties in big cities was 18 percentage points lower than in other cities and rural areas in the 1960s, compared to 6 percentage points in the 2010s.
0%
10%
20%
30%
40%
50%
60%
70%
80%
1963-67
1976
1990-96
2003-09
2012-17
Figure 6 - The conservative vote by income in Japan, 1963-2017
D1
D2
D3
D4
D5
D6
D7
D8
D9
D10
Source: author's computations using Japanese political attitudes surveys.
Note: the figure shows the share of votes received by the Liberal Democratic Party (LDP) and other conservative parties by income
-2
0
2
4
6
8
10
12
14
16
18
20
22
24
26
1963-67
1976
1990-96
2003-09
2012-17
Figure 7 - The conservative vote among top-income earners
in Japan, 1963-2017
Difference between (% of top 10% earners) and (% bottom 90%) voting LDP / Other conservative
After controlling for location, education, age, gender, employment status, union membership
Source: author's computations using Japanese political attitudes surveys.
Note: the figure shows the difference between the share of top 10% earners and the share of bottom 90% earners voting for the
Liberal Democratic Party (LDP) and other conservative parties, before and after controls. In the 1960s, top 10% earners were 16 percentage points more likely to vote conservative, compared to 0 percentage points in the 2010s.
-50
-40
-30
-20
-10
0
10
20
30
40
50
60
70
1963-67
1976
1990-96
2003-09
2012-17
Figure 8 - The depoliticization of inequality in Japan, 1963-2017
Support for the LDP and other conservative parties among upper-class voters
Support for the LDP and other conservative parties among homeowners
Support for the LDP and other conservative parties among wage earners
Support for the LDP and other conservative parties among union members
Source: author's computations using Japanese political attitudes surveys.
Note: the figure shows the difference in the vote share received by the Liberal Democratic Party (LDP) and other conservative
parties between specific categories of voters (upper-class voters, homeowners, wage earners, and union members) and other voters. In the 1960s, upper-class voters were 29 percentage points more likely to vote conservative than the rest of the electorate, compared to 5 percentage points in the 2010s. Upper classes are defined as the top 10% of social classes, based on survey questions on the self-perceived position of respondents on the social ladder.
-25
-20
-15
-10
-5
0
5
10
15
20
25
1953
1963-67
1976
1990-96
2003-09
2012-17
Figure 9 - The reversal of the generational cleavage
in Japan, 1953-2017
Difference between (% of aged less than 39) and (% of aged 40+) voting LDP / Other conservative
After controlling for location, income, education, gender, employment status, union membership
Source: author's computations using Japanese political attitudes surveys.
Note: the figure shows the difference between the share of voters younger than 39 and the share of voters older than 40 voting for
the Liberal Democratic Party (LDP) and other conservative parties, before and after controls. In 1953, voters younger than 39 were 19 percentage points less likely to vote conservative. In the 2010s, they had become 5 percentage points more likely to do so.
0%
10%
20%
30%
40%
50%
60%
70%
80%
90%
100%
1953
1963-67
1976
1990-96
2003-09
2012-17
Figure 10 - The conservative vote and generational renewal
in Japan, 1953-2017
1890
1900
1910
1920
1930
1940
1950
1960
1970
1980
1990
Source: author's computations using Japanese political attitudes surveys.
Note: the figure shows the share of votes received by the Liberal Democratic Party (LDP) and other conservative parties by decade
of birth. In 1953, 89% of voters born in the 1890s voted conservative, compared to 52% of those born in the 1930s. In the 2010s, by contrast, new generations had become more likely to vote conservative than the post-war generations, with 60% of voters born in the 1990s supporting the LDP and other conservative parties.
1953 1963-67 1976 1990-96 2003-09 2012-17 Education Primary 69% 63% 45% 25% 17% 14% Secondary 29% 27% 41% 57% 63% 61% Tertiary 2% 9% 14% 18% 20% 25% Location
Towns and villages 34% 27% 23% 18% 10%
Medium-sized cities 48% 54% 55% 60% 57% Big cities 18% 19% 21% 22% 33% Age 20-39 56% 48% 44% 30% 23% 21% 40-59 33% 37% 42% 47% 38% 35% 60+ 11% 15% 14% 24% 39% 44%
Source: author's computations using Japanese political attitudes surveys.
Note: the table shows the evolution of the structure of the Japanese electorate between 1953 and 2017. This period has been marked
by a strong increase in the general level of education, urbanization, and the ageing of the population. In 2012-2017, 33% of voters lived in big cities and 25% had an university degree.
0%
10%
20%
30%
40%
50%
60%
70%
80%
90%
100%
1945 1950 1955 1960 1965 1970 1975 1980 1985 1990 1995 2000 2005 2010 2015 2020
Share
of
v
ot
es
(%)
Figure
A1 - Election results in Japan by groups, 1946-2017
LDP / Komeito (post-1999) / Other conservative
JSP / DPJ / Other parties
Source: author's computations using official election results.
Note: the figure shows the share of votes received by selected groups of Japanese political parties in general elections
0%
10%
20%
30%
40%
50%
60%
70%
80%
90%
100%
1953
1963-67
1976
1990-96
2003-09
2012-17
Figure A2 - Structure of the electorate by education level
Primary
Secondary
Tertiary
Source: author's computations using Japanese political attitudes surveys.
Note: the figure shows the distribution of education levels of the Japanese adult population and its evolution over time since
0%
10%
20%
30%
40%
50%
60%
70%
80%
90%
100%
1953
1963-67
1976
1990-96
2003-09
2012-17
Figure A3 - Structure of the electorate by age group
20-39
40-59
60+
Source: author's computations using Japanese political attitudes surveys.
Note: the figure shows the distribution of age groups in the Japanese adult population and its evolution over time since the
0%
10%
20%
30%
40%
50%
60%
70%
80%
90%
100%
1963-67
1976
1990-96
2003-09
2012-17
Figure A4 - Structure of the electorate by rural-urban location
Towns and Vilages
Cities
Wards
Source : author's computations using Japanese political attitudes surveys.
Note : the figure shows the distribution of rural-urban locations of the Japanese adult population and its evolution over time
0%
10%
20%
30%
40%
50%
60%
70%
80%
90%
100%
D1
D2
D3
D4
D5
D6
D7
D8
D9
D10
Figure A5 - Rural-urban composition of income groups, 1967
Towns and Vilages
Cities
Wards
Source: author's computations using Japanese political attitudes surveys.