The Trajectory of Dementia in
the UK – Making a Difference
9
th
June 2014
Fraser Lewis, Sarah Karlsberg Schaffer, Jon Sussex,
Phill O’Neill and Lesley Cockcroft
The Trajectory of Dementia in the UK – Making a
Difference
Fraser Lewis, Sarah Karlsberg Schaffer, Jon Sussex, Phill
O’Neill and Lesley Cockcroft
Report for Alzheimer’s Research UK by OHE Consulting
9
thJune 2014
For further information please contact:
Jon Sussex
OHE Consulting, Office of Health Economics
Southside, 105 Victoria Street London SW1E 6QT
United Kingdom
CONTENTS
Key findings ... 1
1. Introduction ... 3
2. Dementia in the UK today ... 4
2.1 What is dementia? ... 4
2.2 How many people are living with dementia? ... 4
2.3 The cost of dementia ... 5
Informal care ... 6
Reduced quality of life ... 6
3. Estimating the future burden of dementia ... 9
3.1 Projection model ... 9
Modelling Approach ... 9
Model 1: Baseline scenario key conceptual features ... 10
Model 2: Delayed onset of dementia ... 10
Model 3: Slowed progression of dementia ... 10
3.2 Data ... 11
3.3 The current trajectory ... 13
Cost implications ... 18
Demand for and supply of informal care ... 21
Quality of life implications ... 23
4. Changing the trajectory of dementia ... 24
4.1 Treatment one: delaying onset ... 24
4.2 Treatment two: slowed progression ... 29
5. Conclusions ... 35
Appendix 1 ... 36
A1. Quality of life ... 36
A1.1 Alternative measures of quality of life ... 36
A1.2 Literature search for quality of life data ... 37
Appendix 2 ... 39
A.2 Higher and lower estimates for changes in trajectory ... 39
A.2.1 Higher estimates for changes in trajectory ... 39
A2.1.2 Slowed progression... 43
A.2.2 Lower estimates for changes in trajectory ... 47
A2.2.1 Delayed onset ... 47
A2.2.2 Slowed progression... 51
KEY FINDINGS
Life expectancy is increasing in the UK. A consequence of this good news is that the numbers of people who are aged over 60 is also increasing.
Age is the biggest single risk factor for developing dementia. Consequently dementia becomes increasingly prevalent as the population ages. In 2014 around 831,000 people in the UK aged 60 and over are living with dementia. Unless we find ways to prevent or cure dementia, the number or people in the
UK aged 60+ who will be living with dementia is projected to double over the next 25 years and to reach 2.0 million by 2050.
The economic cost to the UK of caring for people with dementia is
correspondingly estimated to grow from £23.6 billion in 2014 to a central projection of £59.4 billion by 2050.
Because a large part of the cost of care is the time given up by informal carers to look after their loved ones with dementia, we will need around 1.7 million informal carers by 2050, compared to an estimated 706,000 in 2014.
It is unlikely that the supply of informal care will be able to increase to that extent. In that case the amount of formal social care provided will have to increase yet further, paid for from taxation and out of people’s pockets. However, new interventions to prevent and treat dementia could radically
change this picture.
If we could delay the onset of dementia by two years from 2020 then there would be:
o 19 per cent (383,000) fewer people with dementia by 2050;
o and a consequent need for 325,000 fewer informal carers by 2050. If we could delay onset by five years there would be:
o one third (666,000) fewer people with dementia by 2050;
o and a consequent need for 566,000 fewer informal carers by 2050. An intervention that delays onset of dementia would also generate significant
cost savings to the economy:
o in 2050 dementia would cost the economy 22 per cent less, that is a saving of £12.9 billion in that year (costs of £46.5 billion rather than £59.4 billion), if onset could be delayed by two years;
o in 2050 dementia would cost the economy 36 per cent less, a saving of £21.2 billion in that year (costs of £38.2 billion rather than £59.4 billion), if onset could be delayed by five years.
Under the current trajectory, by 2050, 14 per cent of those living with dementia are expected to be at the severe stage of the disease. This proportion could decrease to eight per cent if a new intervention were found that could slow
disease progression by 25 per cent, and to just two per cent if progression could be slowed by 50 per cent.
Spending longer in milder stages of the disease rather than progressing to more severe stages means major improvements in quality of life.
Because people with severe dementia need far more care than people with milder dementia, slowing the progression of dementia leads to reductions in the total cost of caring for people with dementia.
1. INTRODUCTION
Dementia is a highly prevalent and feared illness. Many hundreds of thousands of people are living with dementia in the UK today and many hundreds of thousands of their families and friends dedicate large amounts of time to looking after them. Dementia has a major impact on quality of life and causes premature death. That impact can be expected to increase as the UK’s older population grows. Medical research provides the only hope of reducing the impact of dementia.
In this report we show how the numbers of people living with dementia is likely to grow in the UK over the coming decades. We estimate the consequences of that for the costs of providing health and social care for people with dementia, and the increasing numbers of people who will be called upon to provide care to their loved ones.
But we also show how if new preventive measures and treatments become available in the next few years they could change that trajectory by:
reducing the numbers of people living with dementia,
slowing the progressive worsening of the disease for individuals, improving the quality of their lives,
lessening the impact on families, and
2. DEMENTIA IN THE UK TODAY
2.1 What is dementia?
Dementia is a term used to describe a group of diseases that affect the brain. The result is progressively worsening cognitive impairment over several (sometimes 10 or more) years and earlier death. Currently around 60,000 people die from dementia each year in the UK (Knapp et al., 2007).
Dementia progressively reduces a person’s ability to understand, remember, reason, communicate and function in daily life as they used to. A person with dementia becomes increasingly dependent on care and much of that care is, in many cases, provided by their spouse, child or other family members or friends. Consequently dementia also brings with it increased health problems for those family or friends who provide the care and support. People with dementia are high users of health care and of formal social care, in addition to the care provided informally by family or friends. The cost of dementia is large in every way.
Alzheimer’s disease (AD) is the single largest cause of dementia and is responsible for around 62 per cent of the total number of people with dementia in the UK. The other main types are vascular dementia and combinations of vascular dementia and AD
(‘mixed dementia’) which together account for around another 27 per cent of people with dementia. The remaining 11 per cent are rarer types such as Lewy body dementia, dementia in Parkinson’s disease and fronto-temporal dementia. (Percentages are for 2005 and taken from: Knapp et al., 2007).
2.2 How many people are living with dementia?
Estimates of the number of people in the UK with dementia vary. The most recent UK study (Matthews et al., 2013) estimated there were 670,000 people aged 65 and over with dementia in 2011. A study by Knapp and colleagues (2007) estimated there were 684,000 people with dementia in the UK in 2005, of whom 669,000 were aged 65 or over. Luengo-Fernandez and colleagues (2010) estimated there were 822,000 people of all ages with dementia in the UK in 2006.
The existence of different estimates of the numbers of people with dementia stems from the absence of a register of people diagnosed with dementia, and the lack of aneffective way to screen the population for the presence of dementia. The prevalence numbers referred to in the previous paragraph are unavoidably estimates, based on surveys of a few thousand people extrapolated up to a national scale or by pooling surveys from a number of different countries and scaling up the result. Consequently it is inevitable that the resulting estimates will differ one from another.
The risk of developing dementia increases greatly with age. For people aged 60-69, the likelihood of having dementia is around one per cent for women and one and a half per cent for men; for those aged 90 or more around a quarter of men and one third of women live with dementia. The UK population is growing, and is projected to continue to grow, especially in the older age groups. The consequence is a steadily growing
increasing number of people with dementia, with the consequent reduction in quality and length of life, increased demand for informal care and increased costs of all kinds of care.
The focus of this report is the rapidly growing UK population aged 60 and over and the occurrence of dementia in that age group. Earlier onset dementia, affecting younger age groups, is less common – though it still affected an estimated 10,000 people under 60 in the UK in 2005 (Knapp et al., 2007; specifically Figure 3.6) – and it will not be impacted by the ageing of the UK population over coming years. Consequently, although it is an important health issue in the UK, we do not consider it further in this report.
Approximately one third of people with dementia live in care homes; two thirds remain in their own homes (Department of Health, 2009). Those who remain at home are to
varying degrees looked after by family members: informal carers. It has been estimated that for every 1,000 people with dementia there are around 850 people acting as
primary carers (Knapp et al., 2007; NICE, 2006). As the number of people with
dementia grows, so too will the need for care, and hence the demand for more people to act as carers. If the supply of informal care is unable to meet this increased demand, then the costs of formal social care will have to increase by even more to fill that gap. Dementia becomes progressively more severe over time and is not reversible. People with more severe dementia not only suffer a worse quality of life, they also require more care and more expenditure to look after them (Mesterton et al., 2010). In the rest of this report we use the common simplification of referring to three worsening stages of
dementia: mild, moderate and severe. In 2005 in the UK around 55 per cent of people with dementia were in the mild stage, 32 per cent had moderate and 13 per cent have severe dementia (Knapp et al., 2007). These percentages are based on the age and sex distribution of the population in 2005 and so would be expected to change in future years given an increasingly older population. The proportion of people in the severe stage of dementia increases with age. A new treatment that could delay progression from mild to moderate to severe dementia would bring improved health to large numbers of people and much reduced costs of care.
2.3 The cost of dementia
The greatest impact of dementia is the progressive destruction of quality of life and the likelihood of an earlier death. But in addition there is an enormous economic cost of providing social care and health care.
A report by Luengo-Fernandez and colleagues for Alzheimer’s Research UK – “Dementia 2010” – provided a detailed estimate of the costs of caring for people with dementia in the UK. They showed that in 2006 dementia was costing the UK economy £23 billion (expressed in 2008 price terms). Within that sum, health care costs were £1.2 billion, social care costs were several times greater at £9.0 billion, but the greatest cost of all was the £12.4 billion value of the time given by unpaid carers to people with dementia. The costs of health care (overwhelmingly provided by the National Health Service) include hospital costs, the costs of medicines and care provided by GPs and community nurses. The social care costs measured by Luengo-Fernandez and colleagues are
principally those of residential and nursing home care. We use their estimates, updated with more recent knowledge about the costs of health and social care, to project the future health care and formal social care costs of dementia as the burden of the condition grows.
The costs of informal care are described in more detail below.
Informal care
Following discussions with a panel of experts, the National Institute for Health and Care Excellence (NICE) in its national costing report put the ratio of informal carers to
dementia patients at 0.85 (NICE, 2006). Independently, Lakey and colleagues (2012) estimated that there were around 670,000 informal carers in the UK which, when combined with their estimates of dementia prevalence, results in a very similar informal carer to patient ratio of 0.84 on average.
Like the total informal caregiving population, informal carers for people with dementia are likely to be female and to be the spouse (Carers UK, 2012). Wimo et al. (2013), in an observational study of patients and carers with Alzheimer’s disease (AD) in three European countries, report the characteristics of carers, stratified by disease severity. They found that of the 526 carers sampled, the average age was around 68 (69 for mild AD, 67 for moderate AD and 69 for severe AD). Around 67 per cent of patients were cared for by their spouse, 26 per cent by their child and seven per cent by another individual. Around 62 per cent of the total sample of informal carers were female. Luengo-Fernandez et al. (2010) estimate that 1.5 billion hours of unpaid care for people with dementia were provided by Britons in 2006, where approximately 34 per cent of the hours were supplied by economically active individuals. Schneider et al. (2002) estimate that the average informal carer spends around 44 hours per week providing care duties. This time is spent on general tasks such as paperwork, household chores, shopping and cooking, and specific tasks such as bathing, dressing and providing transport for the person with dementia. The amount of care required increases greatly as the severity of dementia worsens (Mesterton et al., 2010; Wolstenholme et al., 2002).
Luengo-Fernandez et al.’s informal care cost estimate of £12.4 billion was based on costing hours of care provided by carers who would otherwise be employed at the gender-specific average wage in the UK, and by costing care provided by carers of retirement age or who might be expected not to be in paid work for some other reason at the national minimum wage (Luengo-Fernandez et al., 2010). We follow their
approach here. This approach combines the opportunity cost of informal care provided by people who would otherwise be economically active – adding to the UK’s GDP and paying taxes – with a conservative estimate of what it would cost to replace with paid care staff the hours of care provided by unpaid informal carers who would not otherwise be economically active (because they are past retirement age or for some other reason).
Reduced quality of life
In addition to the economic costs of dementia, as dementia progresses and patients lose cognitive and physical function, the quality of life (QoL) of the patient deteriorates.
Furthermore, the stress and emotional impact of providing care for an individual with dementia can have a significant impact on the QoL of informal carers.
There are several ways of measuring the effects of dementia on QoL. In this report, we use a generic measure called the EQ-5D to represent the quality of life impact on patients and carers1. It is the measure of health related QoL that is recommended by
NICE (2013) when comparing the health impacts of treatments of different diseases. The EQ-5D assesses QoL across five dimensions: mobility, self-care, usual activities,
pain/discomfort and anxiety/depression. Each dimension is rated by the respondent, or by someone on their behalf if they are not in a position to rate themselves, using three levels (no problems, some problems or extreme problems), which leads the respondent to be assigned a “health state”. Each health state is converted into a single summary index, ranging up to a maximum value of 1 (full health), based on a valuation by the general public.
There have been a number of studies aiming to estimate the QoL of people living with dementia, their carers or both. In this report, we use the EQ-5D utility values reported in Mesterton et al. (2010) to describe the impact of dementia in terms of reduced quality of life2. Mesterton and colleagues collected information on the EQ-5D scores of 233 Swedish
patients with Alzheimer’s disease and those of their primary carers. The results of the experiment, stratified by disease severity, are reproduced in Table 1.
Table 1. Quality of life scores from Mesterton et al. (2010)
Mild AD
n=91 Moderate AD n=91 Severe AD n=51
Patient EQ-5D 0.64 0.39 0.24
Carer EQ-5D3 0.80 0.77 0.75
As one would expect, the QoL scores are highest for those with mild Alzheimer’s and lowest for those with severe disease (significant at p<0.01). The same pattern is apparent for the carers but the scores are not statistically significantly different.
These results may be more readily interpreted when they are compared with QoL scores of the general population and with those of people living with other chronic illnesses. Saarni et al. (2006) investigate the impact of 29 chronic diseases on QoL using the EQ-5D approach. The mean QoL score was 0.835 for all respondents and 0.69 for those aged 65 and older. These results suggest that even those in the Mesterton et al. study with only mild Alzheimer’s had, on average, a slightly lower quality of life than the average among their peers, and a considerably lower QoL than someone who was in full health (whose QoL would be measured as 1.00).
The chronic conditions in the Saarni et al. study other than dementia that had the largest negative effect on a person’s quality of life were Parkinson’s disease, anxiety disorders,
1 See Appendix 1, Section A1.1 for a discussion of other measures of QoL.
2 See Appendix 1, Section A1.2 for the literature review methods used to arrive at this study.
3 The exact numbers are not reported in the text; these numbers are estimated from the figure by Shearer et
depressive disorders and arthrosis of the hip and knee. Patients with these diseases had QoL scores of 0.44, 0.68, 0.73 and 0.675, respectively.
The QoL scores for mild, moderate and severe AD reported in Mesterton et al. (2010) were 0.64, 0.39 and 0.24, respectively. Thus moderate and severe Alzheimer’s result in a lower, in many cases much lower, quality of life than any of the other, in themselves severe, conditions reported in Saarni et al. (2006). The mean score for mild Alzheimer’s (0.64) is only slightly higher than that reported for macular degeneration (loss of vision in the centre of the visual field which can lead to blindness). Given the evidence reported in Mesterton et al., we can conclude that dementia has an impact on QoL of patients that is comparable to or worse than the most debilitating chronic conditions.
In addition, the evidence from Saarni et al. (2006) suggests that carers of dementia patients (of all severities) have a QoL below that of the average person aged 30 or over: if we combine all disease severities, the average quality of life of carers is 0.784, similar
to an individual living with hypertension, asthma, psychosis or inflammatory bowel disease.
3. ESTIMATING THE FUTURE BURDEN OF DEMENTIA
3.1 Projection model
Dementia is already a major source of reduced quality and length of life and economic cost. Without effective new treatments or preventive measures this negative impact will steadily grow as the UK population ages. We have modelled how much the impact of dementia can be expected to grow in the UK until 2050. We have then modelled the kind of improvement to that prospect that could be achieved by hypothetical new
interventions to delay the onset and slow the progression of dementia.
Starting from our projections of the future numbers of people with dementia, we combine these with cost-per-patient data and quality of life data to estimate the likely effects on these parts of the overall impact of dementia in the UK over the coming years. We then use the model to estimate what would be the impacts of two hypothetical new dementia interventions, described below, on prevalence, costs, demand for informal care, and quality of life of patients and carers. One type of intervention is assumed to delay the onset of dementia for some years. The other type of intervention is assumed not to delay the onset of dementia but to slow the patient’s progression from mild to moderate and then to severe dementia.
Modelling Approach
The conceptually simplest approach to disease modelling is to use a dynamic state-change methodology. In this approach each individual in the population transitions through “states”, e.g. disease-free to diseased or alive to dead, at known rates. The essential ingredients for such dynamic models are accurate estimates of all rates in the system, for example, the rate per unit time at which an individual will develop dementia (the incidence rate), or the rate per unit time at which an individual will die due to dementia (disease specific mortality rate) or die due to other causes (background mortality rate). Modelling dementia using a dynamic state-change approach is
problematic as this condition is very strongly age and sex dependent, which means that it requires accurate age and sex specific incidence rates, in addition to accurate age specific rates for deaths, immigration and emigration for the UK population for future years (as opposed to cross sectional estimates of future UK population size, which are readily available). However, high quality incidence rate information for dementia is lacking in the literature, although there are good sources of prevalence information. Given the data available (about prevalence but not incidence), a hybrid modelling approach that is part static and part dynamic is most appropriate, as this allows us to anchor the model to the highest quality data available. As detailed in the following section we have reliable sources of estimates of age- and sex-specific prevalence of dementia (Table 2), as well as the proportion of people with dementia in different disease stages (Knapp et al., 2007). We complement this with age specific estimates of life expectancy in people with dementia (Table 3), plus population projections from the ONS and high quality estimates of death rates due to dementia and to other causes, respectively, again from the ONS. Our model utilises these information sources to
optimally predict future numbers of dementia cases under different scenarios. A brief overview of the key aspects of the model as it is applied in different scenarios is given below.
Model 1: Baseline scenario key conceptual features
The baseline model applies known prevalence estimates of dementia to ONS population projections by age for each year from 2012 to 2050, separately for males and females. For the 2011 population we have the ONS mid-year estimates, i.e. actuals rather than projections. A straightforward multiplication then immediately gives us estimates of the number of people with dementia (separately for each age group and males/females) from 2011 to 2050. By additionally applying estimates of the proportions of people in each stage of dementia we can also break these total numbers down into those with respectively mild, moderate or severe dementia.
Model 2: Delayed onset of dementia
We consider the scenario where a new intervention is launched at 2020 that delays the onset of dementia by five (or two) years. To conceptualise this first ignore background (i.e. non-dementia) mortality, in which case this intervention is exactly equivalent to the dementia incidence rate of 69 year olds being what was previously the (lower) dementia incidence rate for 64 year olds. Similarly the rate of deaths from dementia of 69 year olds becomes what was previously the (lower) dementia-specific death rate for 64 year olds. Hence we have not altered the balance of the base case, only changed the age labels, and therefore the total number of people with dementia would remain unaltered from that in the base case - in the absence of background mortality from non-dementia causes. If we now consider the impact of background mortality, then the population of people with dementia must be less than in the base case as by shifting the age labels (e.g. upwards by five years) for each person, they are now subject to higher background mortality rates than previously.
Hence the onset-delaying intervention must reduce the total number of dementia cases compared to the baseline. This conceptual framework is implemented numerically by applying a shifted prevalence distribution of dementia (e.g. shifted by five years) to the ONS population projections (e.g. which already implicitly include increased mortality at older ages).
Model 3: Slowed progression of dementia
In this scenario we consider an intervention that slows the progression of dementia so that the duration of each stage of dementia lengthens by 25 per cent or 50 per cent. The impact of the progression-slowing intervention is conceptually different from that of the delayed-onset intervention. The dementia incidence rate in the progression-slowing scenario is the same as in the base case. But now, due to extended life expectancy, we must have an increased population of people with dementia.
This conceptual approach is implemented numerically using an iterated approach combined with reference to the baseline case in each year. The key point is that in comparison with the baseline case we are ‘avoiding’ dementia deaths each year due to an extended life expectancy of those living with the condition. If we consider 2020, the first year of implementation of the new intervention, then in this year in the baseline case a number of people with dementia would have died. We know what this number was and how many were male/female and how many were in each age group. Using age specific life expectancy estimates, we can then compute the number of extra years each one of these people - who would have previously died from dementia - now survives.
3.2 Data
In order to project dementia prevalence in the UK to 2050, we populate the model with the following data:
Dementia prevalence by age, sex and disease stage for those aged 60 and over; Population projections by age and sex, from the year 2011 to the year 2050; Mortality, including dementia associated mortality, by age and sex;
Survival times for people with dementia (used to estimate the amount of time spent in each stage of the model).
In light of the uncertainty surrounding current dementia prevalence figures, we proceed with an upper estimate, a lower estimate and the mean of those two estimates of current prevalence for the analysis. This results in upper and lower bounds as well as mean estimates for the various outcomes projected by the model.
The upper estimates of prevalence among those aged 60 and over are taken from Luengo-Fernandez et al. (2010), which used the number of dementia cases reported in Hofman et al. (1991) as its basis. The lower estimates of dementia prevalence are taken from a recent study by the Cognitive Function and Ageing Collaboration (Matthews et al. 2013). These figures are based on interviews with over 15,000 individuals aged 65 and older in Cambridgeshire, Newcastle and Nottingham. Because this study did not include the population aged 60 to 64, we have estimated lower end 60-64 year-old prevalence rates based on the relationship between prevalence at age 60-64 and prevalence at age 65-69 as in Hofman et al. (1991), combined with the prevalence rates from 65 onwards reported by Matthews et al. (2013). Table 2 sets out the prevalence rates of dementia by age group and sex that underlie our model.
The population projections by age and sex used in the model are the ONS 2012-based figures for England, Wales, Scotland and Northern Ireland5. The statistics for mortality
by age and sex, including dementia associated mortality, are taken from the ONS estimates for England and Wales6, the Vital Events data published by the General
5 See ONS (2013) at: http://www.ons.gov.uk/ons/taxonomy/index.html?nscl=Population+Projections#tab-data-tables
6 See ONS (2012a) at: http://www.ons.gov.uk/ons/rel/vsob1/mortality-statistics--deaths-registered-in-england-and-wales--series-dr-/2011/index.html
Register Office for Scotland7 and the data collected by the Northern Ireland Statistics and
Research Agency8.
Table 2. Prevalence rates of dementia by age and sex
60-64 65-69 70-74 75-79 80-84 85-89 90-94 95+ Females upper 0.47% 1.10% 3.86% 6.67% 13.50% 22.76% 32.25% 36.00% mean 0.62% 1.45% 3.18% 6.44% 11.50% 20.43% 33.63% 35.50% lower 0.77% 1.80% 2.50% 6.20% 9.50% 18.10% 35.00% 35.00% Males upper 1.58% 2.17% 4.61% 5.04% 12.12% 18.45% 32.10% 31.58% mean 1.23% 1.69% 3.81% 5.12% 11.36% 15.63% 24.60% 24.34% lower 0.87% 1.20% 3.00% 5.20% 10.60% 12.80% 17.10% 17.10%
Sources: Hofman et al. (1991), Luengo-Fernandez et al. (2010), Matthews et al. (2013).
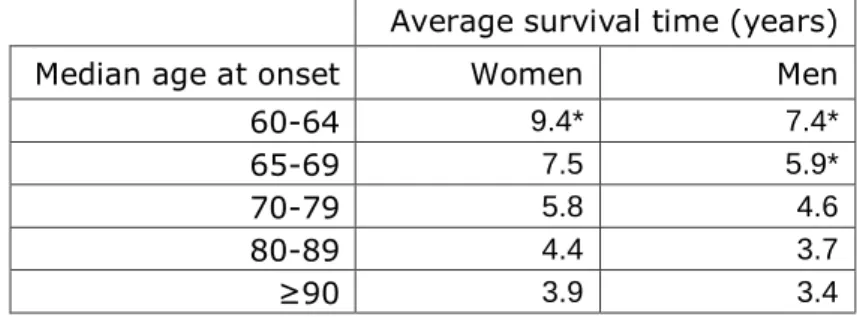
To estimate the rate at which individuals with dementia progress from stage to stage through the model, we use the evidence in Xie et al. (2008) on survival times (in years) by sex and median age at onset (see Table 3).
Table 3. Median survival times of dementia cases based on Xie et al. (2008)
Average survival time (years)
Median age at onset Women Men
60-64 9.4* 7.4*
65-69 7.5 5.9*
70-79 5.8 4.6
80-89 4.4 3.7
≥90 3.9 3.4
* Figures estimated by authors.9
Moving to the estimates of unit costs, we follow the methods used in Luengo-Fernandez et al. (2010) and update their findings to the most recent year available. The economic costs fall under the three headings: NHS care (includes primary care, A&E attendance, outpatient care, inpatient care and medicines), social care (includes nursing home care and residential care) and informal care.
7 See GROS (2012) at: http://www.gro-scotland.gov.uk/statistics/theme/vital-events/general/ref-tables/2011/index.html
8 See NISRA (2012) at: http://www.nisra.gov.uk/demography/default.asp14.htm
For NHS care, we use the 2011/12 Department of Health Reference Costs (Department of Health, 2012) and the Unit Costs of Health and Social Care collected by the Personal Social Services Research Unit (PSSRU) for 2012 (PSSRU, 2012). The PSSRU data give an estimate of the total cost of long term care which is then weighted by the proportions living in nursing and residential homes (found in Laing, 2013). For the cost of medicines, we use the Prescription Cost Analysis data up to the latest year available, 2011 (NHS Information Centre, 2011).
Following Luengo-Fernandez et al. (2010), we calculate the costs of informal care as follows. We use the gender specific average wage from the 2012 Annual Survey of Hours and Earnings for economically active carers and the national minimum wage (£6.19 in 2012) for economically inactive carers (ONS, 2012b). The proportions of carers who are assumed would otherwise be economically active is taken from Luengo-Fernandez et al. (2010), which was in turn based on Schneider et al. (2002). This information is
combined with data on the average number of hours of unpaid care per carer, taken from Schneider et al. (2002).
3.3 The current trajectory
We estimate that there are approximately 831,000 (range 745,000 to 917,000) people aged 60 and over living with dementia in the UK in 2014. The lower end of the range is estimated based on the Matthews et al. (2013) prevalence figures and the upper estimate is based on those from Luengo-Fernandez et al. (2010). Table 4 shows the mean, upper and lower estimates of numbers of people with dementia by sex and severity of disease.
Table 4. Estimated numbers of people (thousands) with dementia in the UK in 2014, by sex and dementia severity
‘000s
Upper estimate Mean estimate Lower estimate Male Female Male Female Male Female
Mild 210 300 180 281 150 263
Moderate 118 176 101 166 84 156
Severe 41 71 35 68 29 64
Total 369 548 316 515 263 482
Source: Authors’ estimates.
The majority of people living with dementia in 2014 have the mild stage of the condition (55 per cent) and around 62 per cent are female. By far the most common type of dementia is Alzheimer’s disease, followed by vascular dementia (see Figure 1).
Figure 1. Characteristics of dementia cases in 2014
Source: Authors’ calculations and Knapp et al. (2007).
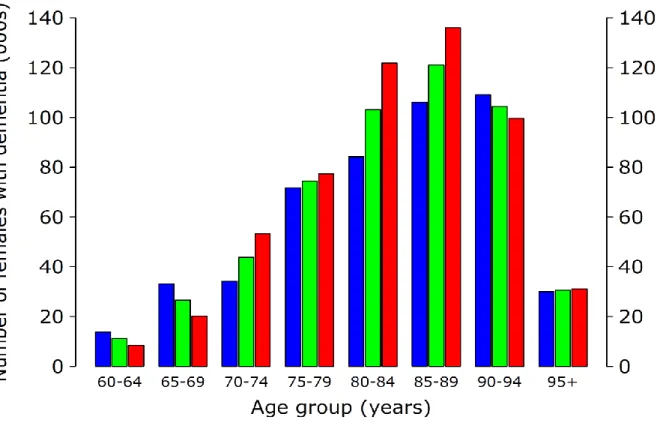
Figures 2a, and 2b show the prevalence of all stages of dementia in the UK in 2014 by sex and age group. The proportion of people with the disease rises dramatically with age.
Figure 2a. Prevalence of dementia in 2014 for males in the UK population aged 60 and over
Figure 2b. Prevalence of dementia in 2014 for females in the UK population aged 60 and over
The UK, like many other countries across the world, is experiencing an ageing
population. Figure 3 shows that in 2011, there were around 6.5 million men and just under eight million women aged over 60 in the UK. The ONS projections (ONS, 2013) suggest that the size of the older population will rise substantially to around 11 million men and 12.5 million women by 2050. This increase is proportionally larger than the rises expected for other population groups over the same period.
Figure 3. The ageing population in the UK: thousands aged 60+
Source: ONS (2013).
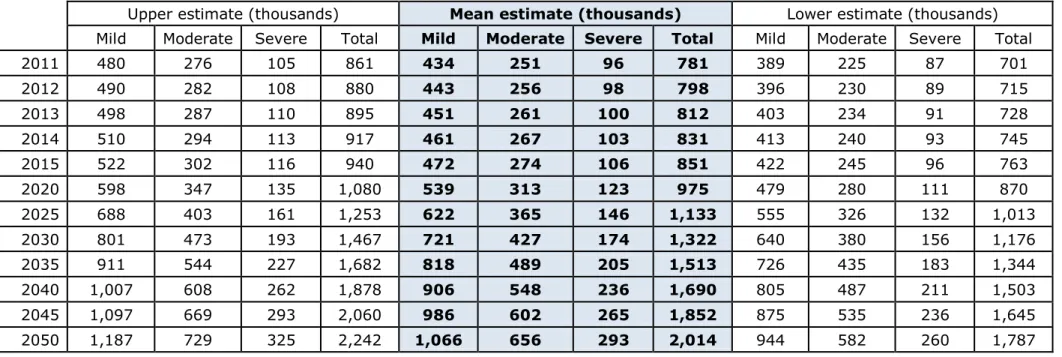
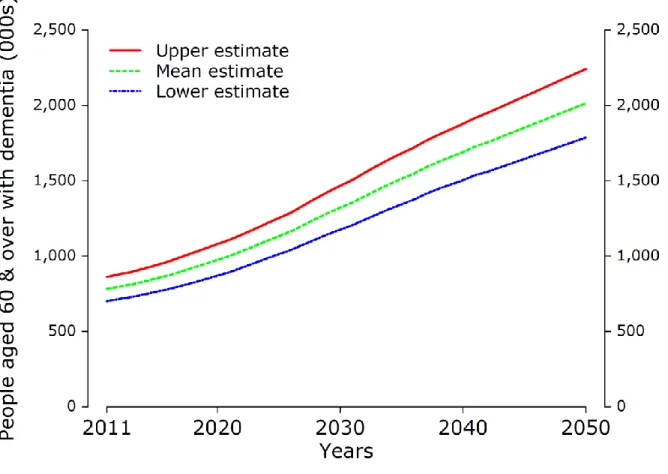
As the population ages, a greater proportion of people in the UK will be living with dementia and more of the country’s resources will be required to care for them. Using the data and model described above, we estimate that if there is no significant change to the trajectory of prevalence, then the numbers of people living with dementia in the UK will more than double over the next 30 years so that there will be approximately 2.0 million people living with dementia in the UK by 2050 (range 1.8-2.2 million). See Table 5 and Figure 4. The lower end of this projected range is comparable to but a little higher than that of Lakey et al. (2012), who estimated that there will be around 1.7 million people with dementia in the UK by 2051.
Table 5. Number of people with dementia in the UK, 2011-2050
Upper estimate (thousands) Mean estimate (thousands) Lower estimate (thousands)
Mild Moderate Severe Total Mild Moderate Severe Total Mild Moderate Severe Total
2011 480 276 105 861 434 251 96 781 389 225 87 701 2012 490 282 108 880 443 256 98 798 396 230 89 715 2013 498 287 110 895 451 261 100 812 403 234 91 728 2014 510 294 113 917 461 267 103 831 413 240 93 745 2015 522 302 116 940 472 274 106 851 422 245 96 763 2020 598 347 135 1,080 539 313 123 975 479 280 111 870 2025 688 403 161 1,253 622 365 146 1,133 555 326 132 1,013 2030 801 473 193 1,467 721 427 174 1,322 640 380 156 1,176 2035 911 544 227 1,682 818 489 205 1,513 726 435 183 1,344 2040 1,007 608 262 1,878 906 548 236 1,690 805 487 211 1,503 2045 1,097 669 293 2,060 986 602 265 1,852 875 535 236 1,645 2050 1,187 729 325 2,242 1,066 656 293 2,014 944 582 260 1,787
Figure 4. The current trajectory of dementia, 2011 to 2050
Source: Authors’ estimates.
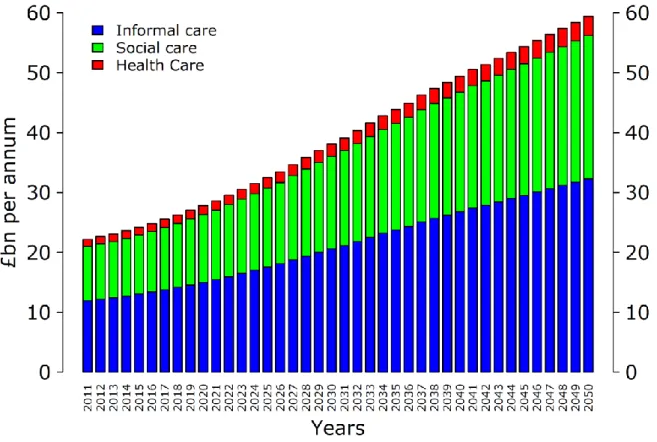
Cost implications
The marked increase in numbers of people expected to have dementia by 2050 has important economic implications. Figure 6 displays our cost projections from 2011 to 2050 based on the mean projection of numbers of people living with dementia. The model projects that, given the current trajectory of the disease, the total annual economic cost of dementia in the UK will more than double from about £23.6 billion in 2014 to £59.4 billion by 2050 (see Figure 5 and Table 6; note that all monetary values in this report are expressed in 2011 price terms). Of the total mean estimate for the 2050 economic cost of £59.4 billion, £3.2 billion would be NHS costs and £24.0 billion would be formal social care costs. But the majority of the economic costs are the costs of informal care: a mean estimate of £32.3 billion by 2050. But this assumes that a supply of informal care on that scale would be forthcoming.
The costs of caring for people with dementia increase as the disease becomes more severe. We have built this effect into our projections of total cost based on the evidence on health care and formal social care costs published in Wolstenholme et al. (2002) and the hours of care required from informal carers that were found by Mesterton et al. (2010).
Figure 5. Projected costs of dementia (2011 prices), mean
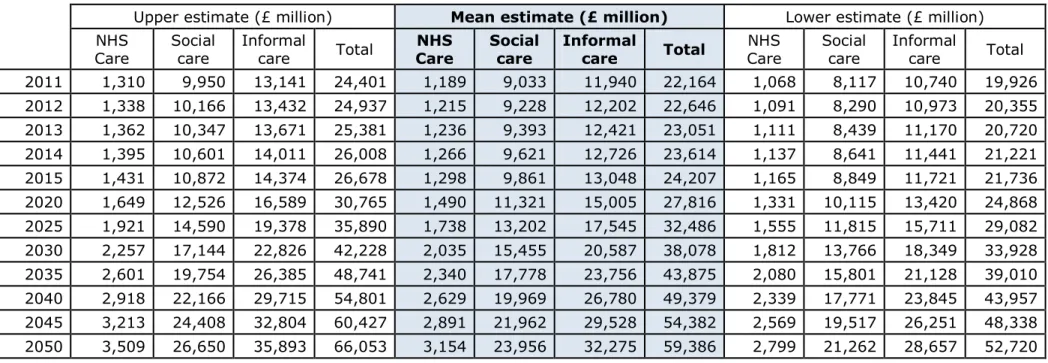
Table 6. Costs of dementia (£ million in 2011 prices) by year and type of cost
Upper estimate (£ million) Mean estimate (£ million) Lower estimate (£ million) NHS
Care Social care Informal care Total Care NHS Social care Informal care Total Care NHS Social care Informal care Total 2011 1,310 9,950 13,141 24,401 1,189 9,033 11,940 22,164 1,068 8,117 10,740 19,926 2012 1,338 10,166 13,432 24,937 1,215 9,228 12,202 22,646 1,091 8,290 10,973 20,355 2013 1,362 10,347 13,671 25,381 1,236 9,393 12,421 23,051 1,111 8,439 11,170 20,720 2014 1,395 10,601 14,011 26,008 1,266 9,621 12,726 23,614 1,137 8,641 11,441 21,221 2015 1,431 10,872 14,374 26,678 1,298 9,861 13,048 24,207 1,165 8,849 11,721 21,736 2020 1,649 12,526 16,589 30,765 1,490 11,321 15,005 27,816 1,331 10,115 13,420 24,868 2025 1,921 14,590 19,378 35,890 1,738 13,202 17,545 32,486 1,555 11,815 15,711 29,082 2030 2,257 17,144 22,826 42,228 2,035 15,455 20,587 38,078 1,812 13,766 18,349 33,928 2035 2,601 19,754 26,385 48,741 2,340 17,778 23,756 43,875 2,080 15,801 21,128 39,010 2040 2,918 22,166 29,715 54,801 2,629 19,969 26,780 49,379 2,339 17,771 23,845 43,957 2045 3,213 24,408 32,804 60,427 2,891 21,962 29,528 54,382 2,569 19,517 26,251 48,338 2050 3,509 26,650 35,893 66,053 3,154 23,956 32,275 59,386 2,799 21,262 28,657 52,720
21
Demand for and supply of informal care
Figure 6 illustrates the projected trajectory of the number of informal carers who would be needed, if there were no change in the ratio of carers to people with dementia.
According to our mean estimate, there are around 831,000 people aged 60 and over who are living with dementia in the UK in 2014. Assuming a ratio of 0.85 carers to patients (NICE, 2006), this implies that there are around 706,000 informal carers currently. For this ratio to remain stable over the coming years, the number of informal carers would have to more than double to 1.7 million by 2050, when we estimate that there will be about 2.0 million people with dementia if there is no significant change to treatment options.
Figure 6. Number of informal carers required, 2011 to 2050
Source: Authors’ estimates.
However, there are reasons to expect that the supply of people available to provide informal care may not grow as rapidly as the projected increase in numbers of people with dementia. Declining fertility rates over past decades mean that the number of people available to care for elderly dependents, relative to the numbers of those dependents, is decreasing, assuming the characteristics of carers remain unchanged (Clarke, 1995). During the period 1985 to 2010, the median age of the UK population increased from 35.4 years to 39.7 years (ONS, 2012c); people aged 85 and older constitute the fastest growing age group in England (Pickard, 2008).
22 Future cohorts of older people will be composed of a larger proportion of childless
individuals, meaning that the burden of care will have to be carried elsewhere. Combined with improvements in male life expectancy (and thus a fall in the proportion of widows), this is likely to result in a shift away from informal care supplied by the younger
generation towards more care provided by spouses (ONS, 2005).
In addition, there has been a rapid decline in the proportion of older people living with their adult children and a large increase in the number living alone. In 1971, 41 per cent of women aged 85 years and over in England and Wales lived in multigenerational
households; by 1991, this had fallen to 21 per cent (Grundy, 2000). These developments may be partially explained by cultural changes such as increases in the divorce and separation rates. In addition, increased education and higher employment rates of women among younger generations mean that there are fewer people available to provide unpaid care. Other changes to social structure such as urbanisation and
globalisation mean that children are more likely to live further away from their parents and are less able to act as informal carers (Demey et al., 2013).
These trends have led to forecasters projecting a “tipping point” for care, where the numbers of older people needing care will begin to exceed the numbers of family
members available to provide the care (Carers UK, 2010). Pickard (2008; 2013) projects the supply and demand of informal care for older people provided by their adult children in England to 2041. Under a number of assumptions, Pickard predicts that the demand for unpaid care will begin to surpass supply by 2017 and that the gap between demand and supply will increase in later years. The Institute for Public Policy Research has recently highlighted the issue raised by Pickard (McNeil and Hunter, 2014).
Concerning the future “care gap” for dementia patients specifically, there is a lack of UK evidence. However, a report for Alzheimer’s Australia forecasts an increasingly large discrepancy between the total number of hours of informal care required by dementia patients and hours available by those who provide it (Access Economics, 2009). The authors forecast that the supply will grow by an average of one per cent per year until 2029, whereas demand will grow by an average of four per cent. They predict that this will lead to a shortfall of a total of more than 1.6 million hours of informal care in the year 2029.
Pickard (2008) estimates that in order for supply to keep pace with demand, the probability of an individual supplying care to older parents must increase by around 60 per cent by around the year 2041. The Alzheimer Society of Canada estimates that in their country, where they are facing demographic changes similar to those in the UK, individuals will spend triple the number of hours providing informal care for dementia patients in 2038 than they did in 2008 (Alzheimer Society of Canada, 2010).
The supply of informal care is determined not only by the demand for it and the
availability of spouses, relatives and others willing and able to provide care, but also by institutional factors. The latter include the availability and cost of formal care and the extent to which that is funded publicly. Karlsberg Schaffer (2013) found that widening the provision of publicly-funded domiciliary care in Scotland led to a small increase in the supply of informal care, as the previous arrangement had incentivised some families to
23 seek publicly funded care home places for their relative rather than provide care at their own expense in the person’s home. Given continuing political pressure to restrain public spending, such arrangements seem unlikely to spread to the rest of the UK.
Furthermore, the Government’s proposals to cap private spending on personal care may discourage substitution of informal for formal care, at least for the more severely ill people with dementia.
To meet the future demand for informal dementia care in the UK, either the groups of people that currently provide informal care must increase their supply or other groups must opt into informal care. If this does not happen to a sufficient extent, the alternative is a substitution between informal and formal care, meaning that the excess demand would have to be paid for by the taxpayer or private individuals paying for professional care.
Quality of life implications
As shown in Table 5, we estimate that if there is no change to the current trajectory of the disease, then by 2050 there will be in the UK 1,066,000 (range 944,000-1,187,000) people with mild dementia, 656,000 (582,000-729,000) people with moderate dementia and 293,000 (260,000-325,000) people with severe dementia. Combining the mean projections with the quality of life data from Section 2.3 of this report, we therefore estimate that in the UK in 2050 there will be around 1,066,000 people living with an average quality of life of 0.64 as a result of mild dementia, 656,000 people with average quality of life equal to 0.39 due to moderate dementia, and 293,000 people with an average quality of life of 0.24 due to severe dementia, as measured by the EQ-5D (where 1 is equivalent to full health and 0 is equivalent to death).
This implies that by 2050 there would be around 949,000 people in the UK (those with moderate or severe dementia) living with a quality of life burden that is on average more severe than for people living with Parkinson’s disease (0.44), heart failure (0.585) or stroke (0.63). In addition, the estimated 1,066,000 people with mild dementia in 2050 will have an average quality of life similar to that of an average patient with macular degeneration (0.63), diabetes (0.67) or anxiety disorders (0.68).
Mesterton et al. (2010) report similar quality of life estimates for carers for patients at all disease stages (around 0.77 using the EQ-5D measure). Therefore, assuming as before that the ratio of informal carers to patients remains 0.85 to 1 (NICE, 2006), and using the information in Saarni et al. (2006), we estimate that the average quality of life of the approximately 1.7 million informal carers required by 2050 would be similar to that of a person with cancer (average quality of life = 0.74), depression (0.73), migraine (0.81) or asthma (0.77).
24
4. CHANGING THE TRAJECTORY OF DEMENTIA
Although there are medicines that help to manage the behavioural and cognitive symptoms of dementia, there is currently no cure or means of preventing its
development. Even modest delays to the onset and progression of dementia could bring major benefits (Brookmeyer et al., 2007). To illustrate the scale of benefit that might be achieved, we discuss how the trajectory of dementia could change in the event of the development of two hypothetical interventions: one that would delay onset of the disease and one that would slow its progression. We report the likely effects of such interventions on the prevalence of dementia in the UK and the consequent impacts on quality of life, economic cost and the demand for informal carers.
4.1 Treatment one: delaying onset
The first hypothetical intervention we examine would delay onset of the disease, meaning that people would experience a greater number of disease-free years before developing dementia. We model two different scenarios: a two year delay to onset and a five year delay to onset. In both these scenarios we assume:
once someone has the disease, the average rate of progression from one disease stage to the next remains unchanged;
the new treatment first becomes available in 2020;
implicitly, that a protocol is developed to identify individuals with MCI and/or other dementia risk characteristics, which is then used to target the population to receive the new onset-delaying intervention;
there is not instantaneous 100 per cent take-up of the new treatment but rather a progressive and steady increase in uptake of the treatment over five years up to a maximum uptake of 80 per cent of people who would go on to become dementia patients.
We do not assume 100% uptake even after five years as it is unlikely that all future dementia patients could be successfully identified in advance by any new intervention. Therefore, in 2020, for example, one fifth of 80 per cent of people who would go on to become dementia patients receive treatment, which is equal to 16 per cent of the total possible. In 2021, 32 per cent receive treatment. By 2024, and each year from then on, 80 percent are assumed to be treated.
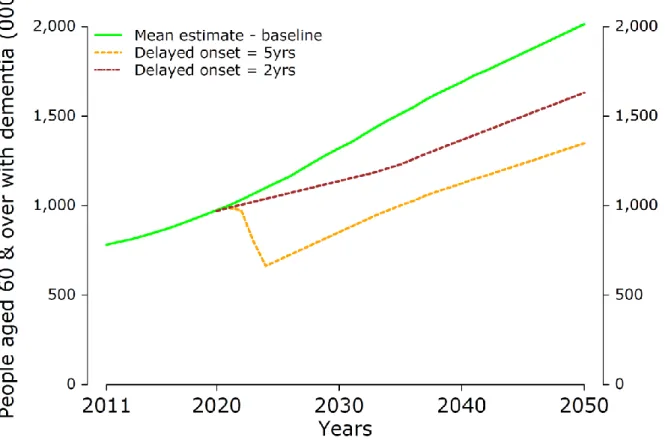
Figures 7 shows how the trajectory of dementia can be expected to change if there were a treatment to delay onset, presenting the results for the mean projection of prevalence of dementia. Results for the higher and lower prevalence projections can be found in Appendix 2. We see that an intervention that delays the onset of dementia by two years would result in an immediate slowing in the growth in the number of people with
dementia, as there would be an initial period during which there would be fewer new cases of the disease arising. After maximum uptake is achieved, the trajectory of the disease would then resume an upward path, but at lower levels than in the baseline projection. A treatment that could delay onset by five years would have an even more dramatic effect, leading to an initial fall in the total numbers of people with dementia,
25 before an upward growth path is resumed, at a much lower absolute number of people with dementia in a given year.
This means that if it were possible to delay onset by two years, then by 2050 there would be around 383,000 fewer people having to live with dementia in the UK: 1.63 million people with dementia as opposed to the 2.01 million projected by the baseline model. If it were possible to delay onset by five years, the dementia population would be even lower in 2050, at 1.35 million people, which is 666,000 fewer people with dementia than in the projection without the new onset-delaying intervention.
Figure 7. Delaying the onset of dementia by 2 or 5 years, mean projections
Source: Authors’ estimates.
Figure 8 shows the proportions of people in the mild, moderate and severe stages of dementia for the baseline trajectory and for the two variants of the intervention to delay onset. The areas of the pie charts are proportional to the projected sizes of the dementia populations in 2050. From Figure 8, we see that in 2050 the proportions of people in the mild stage of dementia would increase slightly as a result of either of the delayed onset interventions, and the proportions in the moderate and severe stages of dementia would fall slightly, compared with the baseline projection.
The smaller numbers of people with dementia at all stages would mean that there would be many fewer people living with dementia at each stage of the disease and
26 consequently many fewer people living with the severely reduced quality of life described in Section 2.3 above. In other words, an intervention that delays the onset of dementia would greatly improve the lives of hundreds of thousands of people by freeing them from dementia for years.
Figure 8. Severity of the dementia population in 2050, with delayed onset
2050 current trajectory 2050 onset delayed by two years
2050 onset delayed by five years
Source: Authors’ estimates.
Figures 9a and 9b show how greatly the costs associated with caring for people with dementia would fall given an intervention that delays onset of the disease two years or five years. Our mean estimate is that the total annual costs of dementia to the UK would be £46.5 billion in 2050 given the treatment to delay onset by two years, and £38.2 billion given the treatment to delay onset by five years. This can be contrasted to the £59.4 billion estimated in the baseline case without the new treatment, which is shown
27 by the line on each graph. (The impact on costs of delaying onset in the cases of the upper and lower prevalence rates is shown in Appendix 2).
Thus an intervention that delays the onset of dementia by two years would reduce the costs of dementia by 22 per cent in 2050. An intervention that delays the onset of dementia by five years could reduce costs by 36 per cent in 2050.
Figure 9a. Costs by year and type of cost, with delayed onset of 2 years, mean projections
28 Figure 9b. Costs by year and type of cost, with delayed onset of 5 years, mean projections
Source: Authors’ estimates.
Delaying the onset of the disease would also mean there would be a significant fall in the number of unpaid carers needed (see Figure 10). If an intervention were to delay onset by two years we would need around 325,000 fewer informal carers in the UK in 2050; and if it delayed onset by five years, we would need around 566,000 fewer informal carers; compared with the 1.71 million carers needed in the baseline projection. The quality of life of hundreds of thousands of people would be improved by no longer being required to provide daily care to a loved one with dementia.
29 Figure 10. Effect of delayed onset on demand for informal carers, mean
projections
Source: Authors’ estimates.
4.2 Treatment two: slowed progression
The second hypothetical intervention we model is one that would slow the progression of dementia, meaning that people with dementia would spend greater lengths of time in the mild stage before progressing to moderate dementia, and more time in the moderate stage before progressing to severe dementia. Again we model two variants of the intervention: slowing progression by 25 per cent and by 50 per cent, respectively. Thus each person treated would on average spend 25 or 50 per cent longer with mild
dementia before progressing to moderate than they would otherwise have done if untreated, and 25 or 50 per cent longer with moderate dementia before progressing to the severe stage of the disease.
In both variants we assume:
onset of dementia is not delayed, but progression to more severe states takes longer after onset;
the treatment is provided to patients in all stages of dementia (mild, moderate and severe) and slows progression of the disease in all stages;
30 there is a progressive and steady increase in uptake of the new treatment over
five years up to a maximum uptake of 80 per cent of dementia patients. The impact on the total number of people living with dementia of these hypothetical progression-slowing treatments is shown in Figure 11. With the treatment there would be slightly more people in total living with dementia in 2050 than there would be without the treatment, because the average survival time of people with the condition would increase. But many fewer of them in any given year would be in the severest stage of dementia, meaning that their average quality of life would be much improved. Using the mean prevalence estimates, the total population of people with dementia in the UK in 2050 would increase from around 2.01 million in the baseline projection to around 2.15 million (with 25 per cent progression delay) or around 2.28 million (with 50 per cent progression delay).
Figure 11. Slowing the progression of dementia by 25 per cent or 50 per cent, mean projections
Source: Authors’ estimates.
People would on average be experiencing a milder stage of dementia, as shown by Figure 12. The treatment that slows the progression of dementia would mean that there would be a larger proportion of dementia patients in the mild stage of the disease and a much smaller proportion in the severe stage. (The areas of the pie charts are
31 per cent slowed progression of dementia, the proportion of patients with the severest stage of the disease in 2050 would fall from 14 per cent in the baseline projection to eight per cent. With 50 per cent slower progression, the result would be just two per cent of dementia patients being in the severest stage in 2050. Given the rapid decline in quality of life as patients move from one stage of the disease to another, a shift towards spending longer in the milder stages would mean that the damage to people’s quality of life of would be much less, and far fewer people would experience the severe state at all.
Figure 12. Severity of the dementia population in 2050, with slowed progression
2050 current trajectory 2050 slowed progression by 25% trajectory
2050 slowed progression by 50% trajectory
Source: Authors’ estimates.
In terms of the quality of life measures discussed earlier (in Section 2), spending a year in mild dementia rather than moderate improves the patient’s quality of life from 0.39 to 0.64 on average, and leads to a slight improvement in their informal carer’s quality of life too (Mesterton et al., 2010). Spending a year in moderate dementia rather than the severe stage of the disease also significantly improves a patient’s quality of life, by the
32 same measure, from 0.24 to 0.39 on average. Again this also implies a slight
improvement in the quality of life of hundreds of thousands of carers.
The greater proportion of people in the mild stage of dementia would also mean that the annual costs of caring for a person with dementia would be significantly lower on
average. Figures 13a and 13b show that if progression of dementia were to be slowed by 25 per cent, then the total costs of dementia would be around £57.6 billion in 2050 (mean projection) compared with £59.4 billion in the absence of that treatment. Given a treatment that slows progression of the disease by 50 per cent, we estimate the total costs would be around £55.2 billion in 2050. This is a reduction in total cost of £4.2 billion relative to the baseline case cost estimate of £59.4 billion.
Figure 13a. Costs by year and type of cost, with slowed progression of 25%, mean projections
33 Figure 13b. Costs by year and type of cost, with slowed progression of 50%, mean projections
Source: Authors’ estimates.
The increase in the total prevalence of dementia associated with slowing progression of the disease would be associated with a proportional increase in the total number of carers needed, as shown in Figure 14, but fewer hours of care would be needed from each informal carer on average owing to the lower average severity of illness. Our model shows that compared with the baseline projection of around 1.71 million carers needed by 2050, around 1.82 million informal carers would be required in 2050 in the case of the 25 per cent progression slowing treatment, and around 1.93 million carers if progression were slowed by 50 per cent. But milder dementia on average means that each informal carer would on average need to provide many fewer hours of care.
34 Figure 14. Effect of slowed progression on demand for informal carers, mean projections
35
5. CONCLUSIONS
It is good news that life expectancy has increased so much in the UK. One of the consequences is that the proportion of the population aged over 60 is increasing.
Dementia becomes increasingly prevalent with age. Consequently the numbers of people living with dementia will grow unless we are able to find ways to prevent or cure the disease. As the number of people with dementia grows, so too do the costs of caring for them. As evidence shows, people with dementia require higher health care costs. The impact on social care costs is even greater, and the majority of social care costs fall on unpaid ‘informal’ carers – usually the spouse or a child of the person with dementia.
Using the ONS projection for the growth of the UK population to 2050, we estimate that the numbers of people living with dementia will more than double from today’s levels: up from 831,000 (mean estimate) in 2014 to 2,014,000 by 2050. Consequently the damage to quality of life that dementia brings, the need for informal carers and the costs of providing formal social care and health care would all more than double too. The
economic costs of providing social care and health care, including the very large costs of the time of informal carers, would rise from around £23.6 billion today to £59.4 billion by 2050 (in constant 2011 price terms).
Changing this trajectory requires new preventive measures and new treatments. We have modelled the impact of a hypothetical new intervention capable of delaying the onset of dementia, by two years or by five years. The result would be 19 per cent or 33 per cent (383,000 or 666,000) fewer people with dementia in the UK in 2050
respectively and annual economic costs by then that are £12.9 billion and £21.2 billion pounds lower, respectively, than they would be without that new treatment. This is equivalent to costs being 22-36 per cent lower than they otherwise would be.
A treatment capable of delaying progression of dementia, but not delaying its onset, would lead to an increase in the numbers of people living with dementia but deliver major improvements in quality of life. Many fewer people would ever experience severe dementia, which has by far the worst impact on the quality of life of patients and of their carers. A treatment that could slow dementia progression by 25 per cent would reduce the number of people with the severe form of the disease from 14 per cent to eight per cent in 2050. This reduces to just two per cent having severe dementia if it were possible to slow progression of the disease by 50 per cent. The costs of care, and the number of hours of informal care an individual needs are far lower at milder stages of dementia. Our estimates show that there would be a slight fall in projected total costs in 2050 if progression of dementia could be slowed, even though there would be more people living with the disease.
36
APPENDIX 1
A1. Quality of life
A1.1 Alternative measures of quality of life
This report uses the EQ-5D to measure health-related quality of life (QoL) for people with dementia and their carers. However, there are several other instruments available for this purpose. Some are disease-specific, meaning they are used only for measuring QoL in people with dementia, and others are generic, meaning the same scale is used for patients with any condition.
A benefit of using a generic scale is that it allows researchers to compare the QoL of patients with different diseases. This is useful in health technology assessment (HTA), where decision-makers may wish to measure the cost-effectiveness of a treatment for dementia relative to a treatment for another condition. Generic measures are also useful in the context of this report: they allow us to consider the QoL of patients and carers using a scale that permits comparisons with qualities of life experienced in other familiar disease states.
However, instruments that are designed specifically for people with dementia are more sensitive to changes in the aspects of QoL that are closely related to dementia, e.g. “social interaction” or “awareness of self”. Disease-specific measures may therefore be more reliable in the comparison of two dementia treatments or in policy evaluation. It is regarded as best practice to use both a generic and dementia specific measure of QoL for patients, although this can have high administration costs and place a higher burden on respondents (Smith et al., 2005, p.7).
Another important feature of QoL instruments for dementia is whether the respondents are the people with dementia themselves (patient-reported utility) or the carers (proxy-reported utility). The nature of the disease – cognitive decline and memory loss – means that patients may give an inaccurate report of their own quality of life. Ideally,
researchers would collect information from both the patient and the carer, as in Jönsson et al. (2006). In that paper, the authors found that the patient-reported utility of people with Alzheimer’s disease was consistently higher than the proxy-reported utility across all disease states, in other words people with AD did not consider themselves as badly off as their carers viewed them to be.
The EQ-5D is by far the most widely used generic QoL scale and it is described in Section 2.1.2. We therefore move now to a discussion of disease-specific measure of quality of life. Smith et al. (2005) perform a literature search and provide a critical review of the following eight disease-specific QoL instruments for patients with dementia:
1. Progressive Deterioration Scales (PDS) 2. Dementia Quality of Life Instrument (DQoL) 3. Quality of Life in Alzheimer’s Disease (QoL-AD) 4. Alzheimer’s Disease Related Quality of Life (ADRQL) 5. Quality of Life Assessment Schedule (QoLAS)
6. Community Dementia Quality of Life Profile (CDQLP) 7. Pleasant Events Schedule – Alzheimer’s Disease (PES-AD)
37 8. Quality of Life in Dementia Scale
The authors rate the psychometric properties of the instruments, including reliability, validity, content and respondent burden (Smith et al. 2005, p. 13). In addition, a new instrument, DEMQOL, is demonstrated. For illustration, we describe the QoL-AD, one of the measures rated most highly by Smith et al. and others (Scholzel-Dorenbos et al. 2012, for example).
In the QoL-AD, 13 domains (physical health, energy, mood, living situation, memory, family, marriage, friends, self, ability to do chores, ability to do things for fun, money and life as a whole) are rated on a four-point scale, where 1 is poor and 4 is excellent (Ready and Ott, 2003, p. 5). Therefore, the maximum score is 52 and the minimum score is 13. The survey can be completed by both patients and proxies – the
recommended method for combining the two scores is to multiply the patient score by 2, adding the proxy score and dividing by 3. This gives twice as much weight to the
patient’s own score as to the proxy’s score. The questionnaire takes an average of 10 minutes to administer to patients and less than that to caregivers (Logsdon et al., 2002a).
A1.2 Literature search for quality of life data
We began the literature review by searching Google Scholar for papers describing the various instruments available for measuring QoL in dementia patients. This led to the discovery of the study by Smith et al. (2005), which discusses generic instruments as well as providing the critical review of disease-specific instruments described above. We also found the study by Shearer et al. (2012), which discusses generic measures only and a paper by Ready and Ott (2003), which discusses disease-specific measures only. The next step was to perform a literature search for each QoL instrument. For each measure, we sought to identify papers that reported quality of life outcomes for dementia patients by disease severity and including patients of all severities. Other desirable features were
UK (or similar) setting; large sample size; recent data; and
inclusion of both patient- and proxy-reported outcomes.
At the end of this process, we had identified six suitable papers (see Table A1). Of these papers, Serrano-Aguilar et al. (2006) and Mesterton et al. (2010) reported quality of life outcomes for the carers as well as the patients, using the same scale (the EQ-5D in both cases).
38
Table A1. Papers identified in quality of life literature review
Paper QoL Instrument
Andersen et al. (2004) EQ-5D
Jonsson et al. (2006) EQ-5D; QoL-AD Karlawish et al. (2008) EQ-5D
Logsdon et al. (2002b) QoL-AD Mesterton et al. (2010) EQ-5D Serrano-Aguilar et al. (2006) EQ-5D
As both papers have roughly equal sample sizes (237 and 233 respectively) but Mesterton et al. was written more recently, we use evidence on QoL of patients and carers as reported in that paper. Another advantage of using Mesterton et al. (2010) is that the authors report cost data for the same sample, which is useful for informing other parts of our model.
Although, given the literature search, we conclude that Mesterton et al. (2010) is the most appropriate paper to inform the model, there are a number of caveats:
1. The authors report only proxy-reported EQ-5D scores for the patients. As the literature shows that proxy-reported scores tend to be lower than
patient-reported scores, we might consider these scores to represent a “lower bounded” estimate of QoL. We consider the inclusion of QoL outcomes for the patients and carers on a common scale as more important than the inclusion of patient-reported outcomes.
2. The patients have Alzheimer’s disease only (no other types of dementia). 3. The data are not from the UK.
4. Best practice would be to use a paper that reports both generic and disease-specific outcomes, e.g. Jönsson et al. (2006). However, as with the lack of patient reported outcomes (point 1), carer QoL outcomes were considered a more
39
APPENDIX 2
A.2 Higher and lower estimates for changes in trajectory
The following charts plot the results for changes in the trajectory of disease based on first the higher and then the lower prevalence assumptions respectively.
A.2.1 Higher estimates for changes in trajectory
The following charts plot the results for changes in the trajectory of disease based on the higher prevalence assumption.
A2.1.1 Delayed onset
Figure A2.1. Impact on numbers living with dementia of delaying onset by 2 or 5 years
40 Figure A2.2. Impact on costs of delaying onset by 2 years
41 Figure A2.3. Impact on costs of delaying onset by 5 years
42 Figure A2.4. Impact on demand for informal carers of delaying onset by 2 or 5 years