RESEARCH OUTPUTS / RÉSULTATS DE RECHERCHE
Author(s) - Auteur(s) :
Publication date - Date de publication :
Permanent link - Permalien :
Rights / License - Licence de droit d’auteur :
Bibliothèque Universitaire Moretus Plantin
Institutional Repository - Research Portal
Dépôt Institutionnel - Portail de la Recherche
researchportal.unamur.be
University of Namur
Influence of the surrounding environment in re-naturalized -barrel membrane proteins.
Lopes Rodrigues, Maximilien; Triguero, J; Torras, J; Perpète, Eric; Michaux, Catherine;
Zanuy, D; Aleman, C
Published in:
Biophysical chemistry
DOI:
10.1016/j.bpc.2017.12.003
Publication date:
2018
Document Version
Publisher's PDF, also known as Version of record
Link to publication
Citation for pulished version (HARVARD):
Lopes Rodrigues, M, Triguero, J, Torras, J, Perpète, E, Michaux, C, Zanuy, D & Aleman, C 2018, 'Influence of
the surrounding environment in re-naturalized -barrel membrane proteins.', Biophysical chemistry, vol. 234, pp.
6-15. https://doi.org/10.1016/j.bpc.2017.12.003
General rights
Copyright and moral rights for the publications made accessible in the public portal are retained by the authors and/or other copyright owners and it is a condition of accessing publications that users recognise and abide by the legal requirements associated with these rights. • Users may download and print one copy of any publication from the public portal for the purpose of private study or research. • You may not further distribute the material or use it for any profit-making activity or commercial gain
• You may freely distribute the URL identifying the publication in the public portal ?
Take down policy
If you believe that this document breaches copyright please contact us providing details, and we will remove access to the work immediately and investigate your claim.
Contents lists available atScienceDirect
Biophysical Chemistry
journal homepage:www.elsevier.com/locate/biophyschem
In
fluence of the surrounding environment in re-naturalized β-barrel
membrane proteins
Maximilien Lopes-Rodrigues
a,b,c,1, Jordi Triguero
a,1, Juan Torras
a,b, Eric A. Perpète
c,
Catherine Michaux
c, David Zanuy
a,⁎, Carlos Alemán
a,b,⁎⁎aDepartament d'Enginyeria Química, EEBE, Universitat Politècnica de Catalunya, C/Eduard Maristany, 10-14, 08019 Barcelona, Spain
bBarcelona Research Center for Multiscale Science and Engineering, Universitat Politècnica de Catalunya, C/Eduard Maristany, 10-14, 08019 Barcelona, Spain cLaboratoire de Chimie Physique des Biomolécules (CPB), Unité de Chimie Physique Théorique et Structurale, University of Namur, Rue de Bruxelles, 61, 5000 Namur, Belgium
H I G H L I G H T S
•
Theβ-barrel porin structure strongly depends on the surrounding environ-ment.•
Ion transport and protein aggregation are also affected by the environment.•
Aqueous solution induces a strong destabilization of the protein.•
The detergent bilayer preserves the porin structure as is found bacteria membranes.•
Detergent solutions are advantageous since they partially protect the porin structure.G R A P H I C A L A B S T R A C T
A R T I C L E I N F O
Keywords: Bioinspired membrane Detergent bilayer Lipid bilayer Membrane protein Molecular dynamicsA B S T R A C T
Outer-membrane porins are currently being used to prepare bioinspired nanomembranes for selective ion transport by immobilizing them into polymeric matrices. However, the fabrication of these protein-integrated devices has been found to be strongly influenced by the instability of the β-barrel porin structure, which depends on surrounding environment. In this work, molecular dynamics simulations have been used to investigate the structural stability of a representative porin, OmpF, in three different environments: (i) aqueous solution at pH = 7; (ii) a solution of neutral detergent in a concentration similar to the critical micelle concentration; and (iii) the protein embedded into a neutral detergent bilayer. The results indicate that the surrounding environ-ment not only alters the stability of theβ-barrel but affects the internal loop responsible of the ions transport, as well as the tendency of the porin proteins to aggregate into trimers. The detergent bilayer preserves the structure of OmpF protein as is found bacteria membranes, while pure aqueous solution induces a strong destabilization of the protein. An intermediate situation occurs for detergent solution. Our results have been rationalized in terms of protein⋯water and protein⋯detergent interactions, which makes them extremely useful for the future design of new generation of bioinspired protein-integrated devices.
https://doi.org/10.1016/j.bpc.2017.12.003
Received 27 November 2017; Received in revised form 20 December 2017; Accepted 23 December 2017 ⁎Corresponding author.
⁎⁎Correspondence to: C. Alemán, Departament d'Enginyeria Química, EEBE, Universitat Politècnica de Catalunya, C/Eduard Maristany, 10-14, 08019 Barcelona, Spain.
1Both authors contributed equally to this study.
E-mail addresses:[email protected](D. Zanuy),[email protected](C. Alemán).
Biophysical Chemistry 234 (2018) 6–15
Available online 02 January 2018
0301-4622/ © 2017 Elsevier B.V. All rights reserved.
1. Introduction
Outer-membrane porins (OMPs) of Gram-negative bacteria are transmembrane proteins allowing the bacterial cells to interact with their environment through passive diffusion across their outer mem-branes of water, ions, or small hydrophilic molecules (< 600 Da) across their outer membranes [1–3]. OMPs are β-barrel structures usually forming homotrimeric water-filled pores. The porin channel is partially blocked by a loop (L3) folded inside theβ-barrel, which consequently affects the size of the solutes that can traverse the channel. Moreover, porins exhibit ion selectivity, e.g. Escherichia coli OmpF and Pseudo-monas aeruginosa OpP438 are cation- and anion-selective porins, re-spectively[4,5]. Many efforts have been carried out in order to un-derstand the dynamics of these porins in their natural environment. Yet, the inner complexity of amphiphilic systems showed that atomistic details are far from being understood. Dynamic studies under non-physiological ionic strength showed that both the variable dielectric behavior in the lipid–water interface and the trimeric nature of the functional porin influences the ionization states of the acid residues constituting the L3 loop. Nonetheless structural differences were smaller than expected when D121 was tested under both potential states, whereas all comparisons were made on a crystal structure ob-tained at 77 K[6].
In recent studies we have explored the very remarkable technolo-gical potential of several devices based on the coupling of OMPs to polymeric nanomembranes [7,8]. Firstly, we functionalized a sup-porting matrix made of poly(N-methylpyrrole) (PNMPy) with aβ-barrel OMP, Omp2a from Brucella melitensis, that forms channels and pores [7]. The OMP was successfully immobilized onto the PNMPy surface forming a hydrophilic, electroactive and biocompatible bio-interface promoting the passive transport of ions. More recently, we have fabri-cated bioinspired free-standing nanomembranes (FsNMs) for selective ion transport by immobilizing the Omp2a β-barrel protein inside na-noperforations created in flexible poly(lactic acid) (PLA) nanomem-branes[8]. The functionalization of the nanoperforations caused effects similar to those observed in biological nanomembranes[8].
The complex nature of OMPs, their poor solubility in aqueous so-lutions, and their instability in presence of charged surfactants severely complicated the fabrication of the above mentioned protein-integrated devices[7,8]. As a result, the preservation of the Omp2a nativeβ-barrel structure was crucial since the structure and function of OMPs are drastically affected by environmental conditions[7,8,9–12]. The pro-blem was partially solved using a recently reported methodology[13], which promoted Omp2a refolding using neutral detergents, in parti-cular n-dodecylβ-D-maltoside (DDM). As a major step to improve the
production and efficiency of bioinspired OMP-based devices, under-standing the effects induced by the environmental conditions in the structural stability and characteristic nanofeatures of these proteins is essential.
In this work we examine the impact of solvation medium in the structure of a representative OMP by using atomistic molecular dy-namics (MD) simulations. The crystal structure of Omp2a is un-fortunately not yet available, and a similarity criterion has been used to select a comparable OMP. Three different situations have considered: (i) the OMP in aqueous solution at pH = 7; (ii) the OMP in aqueous solution with a number of DDM molecules corresponding to the critical micelle concentration (CMC) typically found for neutral detergents; and (iii) the OMP protein embedded in a DDM bilayer, which mimics the lipid environment typically found in cellular membranes.
2. Materials and methods
All MD simulations were carried out using the NAMD 2.9 program [14] and the Amber potential energy function [15]. The numerical parameters for the selected OMP protein (next section) were taken from Amber99 force-field[16]. Water molecules were represented using the
TIP3P model [17], while parameters for DDM compatible with the Amber force-field were taken from the literature[18]. No algorithm was used to force the bond lengths at their equilibrium distances, whereas atom pair distance cut-offs were applied at 14.0 Å to compute the van der Waals interactions. To avoid discontinuities in this energy component, the van der Waals energy term was forced to slowly con-verge to zero by applying a smoothing factor from a distance of 12.0 Å. Beside electrostatic interactions were extensively computed by means of Ewald summations. The real space term was defined by the van der Waals cut-off (14.0 Å), while the reciprocal space was computed by interpolation of the effective charge into a charge mesh with a grid thickness of 10 points per volume unit[19].
Due to its fast convergence, the weak coupling method[20]was used to heat the system and to rapidly equilibrate its pressure and temperature around 1 bar and 298 K, respectively. The relaxation times used for the coupling were 1 and 10 ps for temperature and pressure, respectively. For final relaxation and for all production runs, both temperature and pressure were controlled by the Nose–Hoover piston [21]combined with the pistonfluctuation control of temperature im-plemented for Langevin dynamics [22]. Pressure was kept at 1.01325 bar, the oscillation period was set at 400 fs while the piston decay time was set at 100 fs. The piston temperature was set at the same value as the thermostat control, 298 K, which used a damping coeffi-cient of 2 ps. The integration step was 2 fs in all simulations.
Before the relaxation and production steps described in the Results section, models were thermalized and equilibrated using a model-de-pendent four-step process. Such processes, which applied keeping the protein frozen, can be summarized as follows:
- Model for the OMP in aqueous solution at pH = 7: 1) 2 × 10⁵steps of energy minimization; 2) 1 ns of NVT MD at 500 K; 3) 0.4 ns of NVT MD at 298 K; and 4) 0.5 ns of NPT MD at 298 K and 1.01325 bar.
- Model for the OMP in aqueous solution with a number of DDM molecules corresponding to the CMC: 1) 1.5 × 10⁴steps of energy
minimization; 2) 1 ns of NVT MD at 800 K; 3) 0.6 ns of NVT MD at 298 K freezing the positions of the detergent molecules; and 4) 0.5 ns of NPT MD at 298 K and 1.01325 bar keepingfixed the po-sitions of the detergent molecules.
- Model for the OMP embedded in a DDM bilayer: 1) 1 × 10⁴steps of energy minimization; 2) 0.6 ns of NVT MD at 800 K; 3) 1 ns of NPzzT
(i.e. only the box length in the z-direction was allowing to such that the Pzzcomponent of the pressure tensor was equal to the imposed
pressure) at 500 K and 1.01325 bar freezing the positions of the detergent molecules; and 4) 0.75 ns of NPzzT at 298 K and
1.01325 bar enabling the movement of the detergent molecules. In order to ensure our results reproducibility, additional production MD simulations were performed considering as starting points models obtained using the same procedures described above but introducing small changes at the equilibration step. The length of these additional production trajectories ranged from 30 to 40 ns, depending on the model. As results were very similar to those described in the Results and Discussion section, these production trajectories were not enlarged.
The gmx sasa program contained within the GROMAC package was used to compute the SASA[23]for all production trajectories. 3. Results and discussion
3.1. Selection, construction and equilibration of the models
As mentioned in the Introduction section, the 3D structure of Omp2a protein, which was used in our previous experiments[7,8,13], remains unknown. Consequently, thefirst step of the modeling study was to select an alternative OMP in the Protein Data Bank (PBD), which collects the experimentally-determined structures of proteins.Table 1
summarizes important characteristics of OMPs from Gram-negative bacteria that present greater similarity with Omp2a. From this list, OmpF with PDB code of 3K19[24]has been selected as the most ap-propriate due to its likeness with Omp2a in terms of function, structural and chemical constitution, and membrane location. The OmpF trans-membrane protein, which is active as a trimer for ion transport and contains a 16-strandedβ-barrel, share with Omp2a the ability to refold by addition of ~ 1.5 mM DDM [13,25]. Furthermore, Omp2a is con-stituted by 367 amino acids, which is close to the 340 amino acids of OmpF. Although the ion permeability and ion selectivity through the OmpF channel have been investigated using MD simulations[26–29], the impact of the environment on its structural stability has not been studied yet.
Once the OmpF was selected as representative OMP, the following three models were constructed:
(i) The OmpF immersed in a box with 56,711 explicit water mole-cules, 116 Na+and 104 Cl−explicit ions (i.e. 100 mM NaCl
con-centration), which represents an aqueous solution at pH = 7. (ii) The OmpF in a solution made of 50,660 explicit water molecules,
116 Na+and 104 Cl−explicit ions, plus 62 DDM molecules.
(iii) The OmpF embedded in a bilayer formed by 884 DDM molecules, which in turn is immersed in a bath of 45,940 explicit water mo-lecules.
Models described in (i), (ii) and (ii), are hereafter denoted (OmpF)aq, (OmpF)DDM and (OmpF)bl, respectively, and involve
170,353, 157,222 and 209,644 explicit particles. The (OmpF)aq and
(OmpF)DDMmodels were constructed by placing one protein molecule
in its crystal structure, 3K19 [24], at the center of a 120 × 120 × 120 Å3 simulation box fulfilled with previously
equili-brated (1 atm and 298 K) explicit water molecules. The charge of all
potential titratable residues wasfixed to values corresponding to neu-tral pH (i.e. all Asp and Glu side chains were negatively charged, while Lys and Arg side groups were represented in their positively charged forms). Then, the ions required to neutralize charged protein side chains, as well as to reach the desired anionic strength (i.e. 116 Na+
and 104 Cl−) were added to each simulation box. For (OmpF)DDM, 62
DDM molecules were randomly added, avoiding any overlap with the protein atoms. Finally, water molecules in steric conflict were deleted. The DDM bilayer included in the (OmpF)blmodel was prepared using
the PACKMOL program[30]. The rest of the construction process was identical to that described for the other models, except the simulation box dimensions set to 125 × 125 × 150 Å3.
Table 1
Major characteristics of the OMPs found in the PDB for comparison with non-crystallized Omp2a.
Omp28 Maltoporin OmpG PagP Omp32 OmpA OmpF Omp2a
PDB code 2R2C 1MAL 2IWW 1THQ 2FGR 2KOL 3K19 –
Number of amino acids 183 421 281 170 332 216 340 367
Number of β-strands 10 18 14 10 16 8 16 16
Function Receptor Porin Porin Enzyme Porin Structural Porin Porin
Functional form Monomer Trimer Monomer Monomer Trimer Dime Trimer Trimer
The red box enhances the comparison between the selected protein, OmpF, and Omp2a.
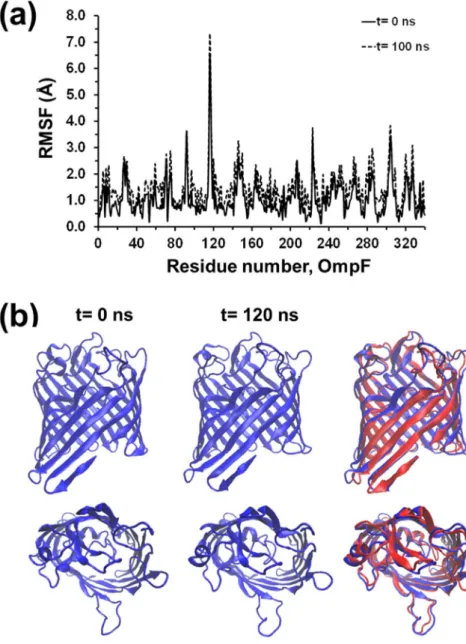
Fig. 1. Residue-based Cα-RMSFs for OmpF after relaxation in several environments compared to the crystal structure.
Fig. 2. (a) Evolution during the production trajectory of the Cα-RMSD of the three si-mulated models compared to the crystal structure. (b) Frequency of the secondary structure motifs for the OmpF protein in the crystal structure in the snapshot used as starting point of the production run (relaxed model corresponding to t = 0 ns) and in the last snapshot of the production run (t = 100 or 120 ns) for the three simulated models.
M. Lopes-Rodrigues et al. Biophysical Chemistry 234 (2018) 6–15
3.2. Relaxed models
MD simulations on (OmpF)aq, (OmpF)DDMand (OmpF)blwere
per-formed using the Amber99 force-field[16]. After thermal and structural equilibration using the careful protocols described in the Methods section, the structure of each system was relaxed by applying 5.5 ns of NPT MD. After this short MD simulation, the root mean square devia-tion (RMSD) of the atomic posidevia-tions with respect to the crystal structure was obtained for the three models. The RMSD, which was obtained using the Cα atoms, was 3.58, 1.82 and 1.26 Å for (OmpF)aq,
(OmpF)DDMand (OmpF)bl, respectively, reflecting that the environment
can significantly affect the main features of the crystallized β-barrel architecture, even during the relaxation step.
To assess the location of the major distortions along the backbone of the constituting residues, the root mean squarefluctuations (RMSF) of the individual Cαatoms from the protein relaxed in the different en-vironments was measured with respect to their positions in the crystal (Fig. 1). As it can be seen, the largestfluctuations occur at the same positions in all cases, albeit (OmpF)aqRMSFs are significantly higher
than their (OmpF)DDMand, especially, (OmpF)blcounterparts. In
gen-eral, the Cα-RMSF in the (OmpF)DDMand (OmpF)blstructures display
lowfluctuation for all residues, with a maximum of 3 Å in the most distorted regions, which are mainly located at loops. Meanwhile, (OmpF)aqexhibits several regions with Cα-RMSFs > 4 Å, with a
max-imum of 11.4 Å at the center of the helical tract comprising residues 159–171, evidencing important local distortions. These results are fully consistent with the previously presented RMSD values. The next sub-section provides details about the structural evolution of the different regions of the protein during the MD production runs, for which the relaxed structures of the three models were used as starting points of 120 ns trajectories for (OmpF)aqand (OmpF)DDMmodels and of 100 ns
for (OmpF)bl. The first 10 ns of trajectory was omitted for statistical
analyses.
3.3. OmpF in aqueous solution at pH = 7: (OmpF)aqmodel
Fig. 2a displays the time evolution of the Cα-RMSD in the (OmpF)aq
model, calculated with respect to the crystal structure. The RMSD in-creases from 3.58 to 3.86 Å after a 120 ns trajectory, the mean value averaged over the whole production run being 3.75 ± 0.23 Å. While this relatively small variation of Cα-RMSD (< 0.3 Å) would suggest that the protein does not undergo important distortions along the Fig. 3. For the (OmpF)aqproduction trajectory: (a) Residue-based Cα-RMSFs for OmpF protein at the beginning (relaxed structure at t = 0 ns) and at the end (t = 120 ns) of the simu-lation; and (b) Axial and equatorial (top and bottom, respec-tively) views of the protein at the beginning (left) and at the end (middle) of the simulation. The superposition of the protein structures at the end of the simulation (blue) and in the crystal (red) are displayed in the right column. The light green dashed circle shows that residues 72–78, which form a loop in the crystal, adopt a helical conformation in the model. The light blue dashed rectangles display some loops whose spatial orientations in the model differ from those in the crystal. (For interpretation of the references to color in thisfigure legend, the reader is re-ferred to the web version of this article.)
production run, comparison between the Cα-RMSFs at the beginning and at the end of the production run reflects the opposite. More spe-cifically, the protein experiences a significant structuration with re-spect to the initial structure during the production trajectory. As illu-strated byFig. 3a, thefirst part of the protein undergoes a distortion with respect to the relaxed structure. Thus, the level of alteration in-creases in the regions that were already deformed during the relaxation process. In contrast, the second half of the protein stabilizes with re-spect to the crystal and the degree of distortion decreases for many secondary motifs. The combination of such distinctive behaviors ex-plains the relatively small increment in Cα-RMSD during the production trajectory (Fig. 2a).
By using the DSSP program [31], the secondary structure of the protein has been characterized in terms of β-strand (βS), loops and turns (L + T), and helices (H). The results found for thefirst and last snapshot of the production simulation are compared with the crystal in Fig. 2b. The progressive reduction in weight ofβSs and Hs (i.e. 13% and 4%, respectively, after 120 ns) and the corresponding increment of L + Ts (17%), which becomes the most populated motif with respect to the crystal structure, is fully consistent with the destabilization of the first half of the protein identified by Cα-RMSF. However, a detailed
inspection of the snapshots indicates that the extension of such
structural destabilization is greater than that indicated in the secondary structure analysis. Indeed, some loops of the crystallized proteins transform into regular secondary motives during the production tra-jectory. This is illustrated byFig. 3b where the protein structures at the beginning and at the end of the production MD are displayed along the crystal structure. For example, the region comprised between 9 and 12 residues forms a disorganized loop in the crystal, but adopts a well-defined helical conformation (light green dashed circle inFig. 3b) that re-orients and grows during the simulation. Another source of desta-bilization corresponds to the loops, which exhibit spatial orientation completely different from that of the crystal, at both the beginning and end of the simulation. This is also illustrated by few punctual results depicted inFig. 3b (light blue dashed rectangles).
3.4. OmpF in a detergent solution: (OmpF)DDM
The Cα-RMSD for the (OmpF)DDMsimulation increases slowly and
gradually from 1.82 to 2.30 Å during 44 ns (Fig. 2a). After this, it grows to 3.18 Å in ~ 1 ns, and at the end of the 120 ns trajectory, the Cα -RMSD is 3.63 Å, with an average value of 3.44 ± 0.16 Å in the 45-to-120 ns time interval. This Cα-RMSD trends indicate that, during thefirst part of the production trajectory (i.e. 44 ns), the protein remains in a Fig. 4. For the (OmpF)DDMproduction trajectory: (a) Residue-based Cα-RMSFs for OmpF protein at the beginning (relaxed structure at t = 0 ns) and at the end (t = 120 ns) of the simu-lation; and (b) Axial and equatorial (top and bottom, respec-tively) views of the protein at the beginning (left) and at the end (middle) of the simulation. The superposition of the protein structures at the end of the simulation (blue) and in the crystal (red) are displayed in the right hand column. Light blue and the green circles, which correspond to the loops contained in the 68–76 and 142–152 segments, respectively, reflect the dis-crepancy between the simulated and crystal structures. (For in-terpretation of the references to color in thisfigure legend, the reader is referred to the web version of this article.)
M. Lopes-Rodrigues et al. Biophysical Chemistry 234 (2018) 6–15
conformation similar to that in the crystal, before undergoing a very fast destabilization.Fig. 4a compares the Cα-RMSFs at the beginning and the end of the production run. It shows that the zones delimited by residues 68–76 on the one hand and 142–152 on the other hand almost exclusively concentrate the observed destabilization, while the rest of protein exhibits moderate or even low distortions with respect to the relaxed structure used as starting point.
The comparison of populations associated toβS, L + T and H sec-ondary motifs highlights the remarkable similarity between the simu-lated and the crystal structures (Fig. 2b). Indeed, in this case the most destabilized regions fundamentally correspond to poorly organized L + T patterns. In clear, L + T preserve their disordered state, though their structure differs from that found in the crystal. These features are illustrated inFig. 4b, which reflects the large discrepancies between the loops in the crystal and those formed at the end of the production run (e.g. the light blue and the green circles correspond to the loops con-tained in the 68–76 and 142–152 segments, respectively). Essentially, these results reveal that detergent molecules do not prevent changes in the spatial orientation of the intrinsically disordered loops, whereas they clearly exert some protective effect in βS and H regular motifs, as previously proven in the parent porin Omp2a[13].
3.5. OmpF embedded in a bilayer: (OmpF)bl
The average Cα-RMSD in (OmpF)blis 1.65 ± 0.13 Å after 100 ns
(Fig. 2a), which represents an increment of < 0.4 Å with respect to the relaxed structure. This suggests that the detergent bilayer protects the protein, thus preserving the structure observed in the crystal. This stability is confirmed byFig. 5a, which plots the Cα-RMSF for the initial structure and the last snapshots with respect to the crystal structure. Only six residues (92, 116–118, 223 and 304), which are located at turn or bend-regions in the crystal structure, present a RMSF higher than 3.5 Å. Indeed, differences between the simulated and crystal structures only involve a few L + T motifs (Fig. 5b). Accordingly, the bilayer provides global stability not only to theβS and H motifs but also to the structurally disordered L + T (Fig. 2b).
3.6. Analysis of the protein⋯water and protein⋯detergent interactions Fig. 6a compares the evolution with time of the solvent accessible surface areas (SASA) of the protein for (OmpF)aq, (OmpF)DDM and
(OmpF)bl models. In aqueous solution the SASA rapidly stabilizes
around an average value of 182 ± 3 nm2. This behavior, which is fully
consistent with the RMSD profile discussed above (Fig. 2a), indicates a Fig. 5. For the (OmpF)bl production trajectory: (a) Residue-based Cα-RMSFs for OmpF protein at the beginning (relaxed structure at t = 0 ns) and end (t = 120 ns) of the simulation; and (b) Axial and equatorial (top and bottom, respectively) views of the protein at the beginning (left) and at the end (middle) of the simulation. The superposition of the protein structures at the end of the simulation (blue) and in the crystal (red) are displayed in the right hand column. (For interpretation of the references to color in thisfigure legend, the reader is re-ferred to the web version of this article.)
10% increment with respect to the SASA of the crystal structure (164 nm2). Consequently, one can draw the hypothesis that the
dis-tortions reflected by both the Cα-RMSD and Cα-RMSF profiles (Figs. 2a
and3a) are related to the attractive protein⋯water interactions, re-sulting in a higher exposition of the residues.
The average SASA value obtained from the (OmpF)DDMtrajectory is
178 ± 2 nm2for thefirst 44 ns, then decreasing to 174 ± 2 nm2for
the interval between 44 and 120 ns. Comparison of these variations with the results observed for (OmpF)aqindicates that during thefirst
44 ns the protein is more protected in the detergent solution than in pure water. After such period of time, the SASA reduction to reach a value closer to the crystal structure might apparently look anomalous since simultaneously both the Cα-RMSD and Cα-RMSF increase. However, complementary analyses in which the SASA of protein to-gether with DDM molecules, as well as of the DMM molecules alone
(OmpF + DDM and DDM, respectively, inFig. 6b) highlight such un-expected response. Indeed, the exposition to water of both OmpF + DMM and DDM decreases after 44 ns, indicating that the structure of the protein changes to achieve the maximum protein⋯detergent con-tact. Thus, detergent molecules induce localized distortions at the L + T regions maximizing the hydrophobic contacts, whereasβS and H motifs, which are stabilized by intramolecular protein⋯protein inter-actions, preserve their stable structures.
Finally, the SASA of the protein calculated using the (OmpF)bl
tra-jectory fluctuates around its average value, 172 ± 2 nm2 (Fig. 6a),
which deviates by < 5% from the value obtained for the crystal-lographic structure. This behavior is fully consistent with the small Cα -RMSD (Fig. 2a) and Cα-RMSF (Fig. 5a) found for the protein inside the detergent bilayer.Fig. 6c, which represents the evolution of the SASA values for OmpF + DDM, reflects very small fluctuations around the average value, 513 ± 1 nm2, evidencing the structural stability of the Fig. 6. (a) Evolution during the production trajectories of the SASA for the three OmpF
examined models. For the (b) (OmpF)DDMand (c) (OmpF)blmodels, the SASA evolution with time of the protein together with DDM molecules and of the DMM molecules alone (OmpF + DDM and DDM, respectively) are also displayed. In (c) the protein⋯detergent contact surface has been estimated as the difference between the OmpF + DDM SASA and the DDM SASA.
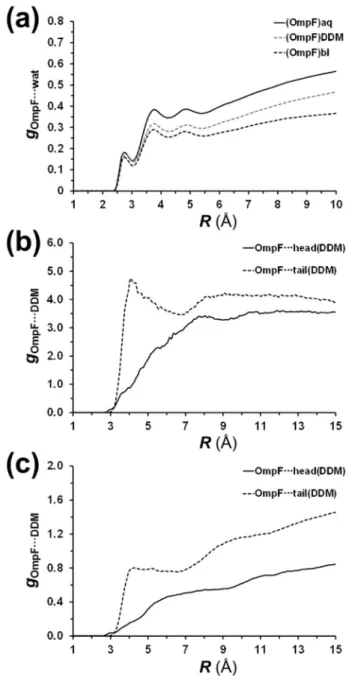
Fig. 7. Distribution functions for the following pairs of atoms: (a) non-hydrogen atoms from OmpF and oxygen atoms from water for (OmpF)aq, (OmpF)DDM and (OmpF)bl models; (b) non-hydrogen atoms from OmpF and non-hydrogen atoms of maltosyl (OmpF⋯head) or last atom of the dodecyl tail (OmpF⋯tail) for the (OmpF)DDMmodel; and (c) non-hydrogen atoms from OmpF and non-hydrogen atoms of maltosyl (OmpF⋯head) or last atom of the dodecyl tail (OmpF⋯tail) for the (OmpF)blmodel.
M. Lopes-Rodrigues et al. Biophysical Chemistry 234 (2018) 6–15
bilayer. Moreover, the protein⋯detergent surface contact, which was estimated as the difference between the SASA values of OmpF + DDM and DDM alone (i.e. removing the protein) for each snapshot (Fig. 6c), exhibitsfluctuations similar to those observed for the Cα-RMSD.
The interactions between the OmpF protein and water molecules have been analyzed by calculating the pair distribution function be-tween non‑hydrogen OmpF atoms and water oxygen atom, gOmpF-wat
(Fig. 7a). For all models, three peaks have been detected corresponding to directly interacting (R≈ 2.8 Å) and ordered (R ≈ 3.8 and 4.9 Å) water molecules. The first peak is mainly associated to hydrogen bonded water molecules, while the second and third peaks correspond to the second and third hydration shells (i.e. solvent molecules hy-drogen bonded to the water offirst and solvation shell, respectively). On the top of that, the number of water molecules interacting with the
protein decreases as follows: (OmpF)aq > (OmpF)DDM≫ (OmpF)bl.
Obviously, this can be attributed to the fact that in the (OmpF)aqmodel
the protein is completely immersed in aqueous solution, while in the (OmpF)DDMmodel some detergent molecules tend to be located in
po-sitions close to the protein (see below). Finally, in the (OmpF)blmodel,
the OmpF is embedded in a detergent bilayer and the only protein re-gions accessible to water molecules correspond to the edges of the β-barrel.
On the other hand, OmpF⋯detergent interactions have been ex-amined considering the head and the tail of the DDM molecules. More specifically, the pair distribution functions between non-hydrogen OmpF atoms and the oxygen atom connecting the two rings of the maltosyl group (gOmpF-head) or the last carbon atom of the dodecyl tail
(gOmpF-tail) are represented in Fig. 7b and c for (OmpF)DDM and
(OmpF)blmodels, respectively. The lack of peaks in gOmpF-headprofiles
reflects the absence of preferential interactions between the protein and the maltosyl group, which is consistent with the fact that heads of the DDM molecules are mainly oriented towards the aqueous environment. On the contrary the gOmpF-tailprofiles display a peak centered at 4.05 Å
both for (OmpF)DDMand (OmpF)bl. That is consistent with the
forma-tion of stabilizing lipophilic interacforma-tions between the tails of the DDM molecules and the protein. The formation of such attractive interactions is fully coherent with the SASA results discussed above (Fig. 6), and explains the stabilizing effects experimentally observed when mem-brane proteins are combined with detergents[13].
3.7. Analysis of the L3 and L2 loops
OmpF forms aqueous voltage-gated channels that span the outer membrane, allowing the diffusion of small polar molecules. Its crystal structure reveals that eight long irregular loops named L1-L8 connect the antiparallelβ-strands[24]. L3 is particularly long (33 residues) and folds inside the protein channel defined by the β-barrel, thus restricting its accessibility. This was reported to constrain the pore dimension from a theoretical 23 Å to 7 × 11 Å2[24], allowing the passage of
mole-cules < 600 Da, with slight preferences for those bearing a positive charge. In short, L3 controls the pore diameter, modulating the solute transport (Fig. 8a).
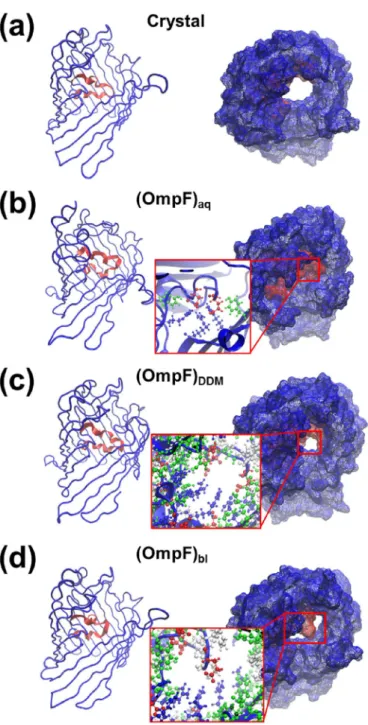
In spite of the L3 loop internal location, analysis of the MD pro-ductions trajectories revealed that its conformation depends on the external environment. This is reflected inFigs. 8 and 9, which represent both the structure of the loop and the pore for each model and the temporal evolution of the Cα-RMSD considering 105–127 residues (i.e. the central and most relevant residues of L3), respectively. The Cα -RMSD averaged along the whole (OmpF)aq, (OmpF)DDMand (OmpF)bl
trajectories is 4.67 ± 0.23, 2.70 ± 0.37 and 3.05 ± 0.70 Å, respec-tively. Early mutation studies proved that conformational changes in L3 Fig. 8. Views of the disposition L3 loop, represented in red, in the protein model (left)
and representation of the pore (right) in the (a) OmpF crystal and in the last snapshot of the (b) (OmpF)aq, (c) (OmpF)DDMand (d) (OmpF)blproduction trajectories. (For inter-pretation of the references to color in thisfigure legend, the reader is referred to the web version of this article.)
Fig. 9. Evolution during the production trajectory of the Cα-RMDF for the L3 loop (re-sidues 105–127) in the three models compared to the crystal structure.
do not affect β-barrel structure or the surface exposed loops[32,33]. Although simulations results on (OmpF)DDMand, especially, (OmpF)bl
models corroborate this fact, the reverse is apparently derived from (OmpF)aq results. Thus, the average Cα-RMSD obtained for the
(OmpF)aq, which is the highest one, is probably due to the poor stability
of thebarrel in water, suggesting that structural alterations in the β-barrel induce very important conformational changes in the loop. Overall, these variations close the pore (Fig. 8b), preventing the passage of any chemical specie. Indeed, the network of hydrogen bonding in-teractions and salt bridges formed among the guanidinium group of three Arg residues (42, 82 and 132), the hydroxyl moiety of two Tyr residues (40 and 106), and the carboxylate of Glu and Asp (117 and 121, respectively) is responsible for the complete closure of the pore (Fig. 8b, inset).
On the other hand, the L3 motif in (OmpF)DDMand (OmpF)blmodels
also exhibits differences with respect to the crystal (Fig. 9). More spe-cifically, the pore remains partially opened in (OmpF)DDMand (OmpF)bl
models (Fig. 8c and d, respectively). In these cases the very high
stability of theβ-barrel partially restricts the amount of hydrogen bonds and salt bridges formed inside the cavity, even though the dimension of the pore is strongly affected by the re-arrangements of the L3 loop. In the (OmpF)DDM model, the L3 motif surrounds the cavity, reducing
considerably the dimension of the pore to 5 × 8 Å2in (Fig. 8c). In the bilayer, L3 crosses the cavity and forms several salt bridges between the side chains of Arg, Asp and Glu residues (Fig. 8d, inset). This splits the original pore into two smaller ones with approximate dimensions 3 × 3 and 3 × 6 Å2.
The L2 loop (residues 66–80) plays a crucial role in the stability of the OmpF. In bacteria membranes the OmpF porin is associated to homotrimers, each subunit including a hollowβ-barrel. These homo-trimers are unusually stable due mostly to the hydrophobic interactions between β-barrels. Furthermore, L2 connects one subunit to its neighbor by latching into its channel. More specifically, residue E71 on L2 is integrated into an ionic network and forms salt bridges as well as hydrogen bonds with R100 and R132 on the channel wall of the ad-jacent subunit. Although in this work production trajectories involve a singleβ-barrel subunit, analysis of the L2 flexibility or rigidity provides important information about the influence of the environment in the trimer-stabilization mechanism[34].
As it can be seen inFig. 10a, in the crystal L2 projects sideways to dips into the pore of the adjacentβ-barrel. However, this disposition is completely different from those achieved at the end of the production trajectories. The Cα-RMSD profile calculated for the (OmpF)aq model
using residues 66–80 (Fig. 10b) indicates that in aqueous solution the loop exhibits largefluctuations, even though it remains at the external side of theβ-barrel (Fig. 10a). Thus, the Cα-RMSD shows a large var-iation within the range 3–9 Å, with the maximum and minimum values of 14.5 and 2.1 Å, respectively. Accordingly, the aqueous environment not only affects the stability of the β-barrel but also enhances the al-ready intrinsicflexibility of L2, the latter favoring the dissociation of the characteristic homotrimer.
A completely different patterns appear in the (OmpF)DDMmodel, in
which the L2 loop folds over itself partially entering inside theβ-barrel (Fig. 10a). This drastic rearrangement of the loop occurs after ~ 44 ns (Fig. 10b), simultaneously to the global re-structuring of the protein. Once the re-arrangement happened, the L2 loop needs ~ 13 ns to ac-commodate into the new position. After this, it remains stable, as shown by the small Cα-RMSDfluctuations along the time interval between 57 and 120 ns. Overall, the analysis of the evolution of L2 in the detergent solution indicates that, after the initial protection effect exerted by DDM molecules, this environment promotes structural changes much more pronounced than thefluctuations observed in aqueous solution. These results are fully consistent with electrophoretic association stu-dies recently reported for the Omp2a porin [8]. Consequently, the homotrimeric form was found to be much less populated than the monomeric one in a detergent solution, and the low self-association capacity in this environment can be attributed to the protein⋯de-tergent interactions, which induce conformational changes in L2, sig-nificantly affecting the homotrimer stability.
Finally, the conformation of L2 is preserved in the detergent bilayer (Fig. 10a). The Cα-RMSD averaged along the whole (Omp2F)bl
trajec-tory is 2.44 ± 0.41 Å only (Fig. 10b), evidencing that the bilayer protects the loop from undesirable re-arrangements and, in addition, considerably reduces the conformationalflexibility of such intrinsically disorganized motif. In summary, the homotrimer is predicted to be preserved in detergent bilayers like those used in this work.
4. Conclusions
We have presented MD simulations for a representative OMP in several surrounding environments. Our results show how the latter may affect not only the stability of the β barrel, but also the internal and surface exposed loops related with the ion transport and with the as-sembly of protein units in homotrimers, respectively. Water causes a Fig. 10. (a) Views of the L2 loop (in red) in the OmpF crystal and in the last snapshot of
the (OmpF)aq, (OmpF)DDMand (OmpF)blproduction trajectories. (b) Evolution during the production trajectory of the Cα-RMSD for the L2 loop (residues 66–80) of the three models compared to the crystal structure. (For interpretation of the references to color in this figure legend, the reader is referred to the web version of this article.)
M. Lopes-Rodrigues et al. Biophysical Chemistry 234 (2018) 6–15
very rapid and practically global destabilization of the protein structure that is accompanied by an increment of the SASA. The new structure is reached through both the spatial re-orientation of disorganized loops and the complete transformation of secondary motifs, as for example the conversion of a disorganized loop into a regular helix. These fea-tures seem to indicate that the water⋯OmpF interactions are appar-ently stronger than OmpF⋯OmpF interactions. However, the high dynamical activity observed for such re-orientation and transformation processes suggests a competition between the two types of interactions during the whole production trajectory.
On the other hand, DDM molecules in water induce a partial pro-tective effect on the protein. More specifically, ordered βS and H motifs mostly maintain their structure, while poorly organized L + T motifs undergo severe conformational changes. These changes affect, among other things, the association capacity of OmpF, precluding the forma-tion of homotrimers. This explains our recent observaforma-tion in porin-PLA nanodevices constructed by immobilizing the protein dissolved in a neutral detergent solution onto polymeric nanomembranes[8]. Finally, the protein is perfectly protected by DDM bilayers. This protection re-fers to ordered motifs but also to intrinsically disordered loops. Con-sequently, the OmpF maintains not only a well-defined channel struc-ture but also its ability to form homotrimers through the L2 loop.
These results are extremely relevant for the improvement of bioin-spired porin-integrated nanodevices, such as the nanoperforated PLA FsNMs for selective ion transport currently in fabrication. More speci-fically, we are immobilizing Omp2a, which has been previously pro-tected using detergent bilayers, inside nanoperforations. Indeed, this is expected to facilitate the fabrication process as well as to improve the efficiency of the membrane in terms of transport.
Acknowledgements
This work was supported by MINECO/FEDER (MAT2015-69367-R and FPI gran to J.T.). Support for the research of C.A. was received through the prize“ICREA Academia” for excellence in research funded by the Generalitat de Catalunya. M.L.-R. acknowledges the FI grant to the Generalitat de Catalunya. J.T. acknowledges PRACE for awarding access to resource Curie TN and HN based in France at GENCI@CEA and Mare Nostrum based in Spain at BSC. D.Z. acknowledges computer time at Mare Nostrum based in Spain at BSC (project:“Simulation of selective protein channels embedded in electroactive polymeric mem-branes”). C.M. and E.A.P. thank the Belgian National Fund for Scientific Research for their research associate and senior research associate po-sitions, respectively.
References
[1] R. Benz, K. Bauer, Permeation of hydrophilic molecules through the outer mem-brane of gram-negative bacteria. Review on bacterial porins, Eur. J. Biochem. 176 (1988) 1–19.
[2] S. Galdiero, A. Falanga, M. Cantisani, R. Tarallo, M.E. Della Pepa, V. D'Oriano, M. Galdiero, Microbe-host interactions: structure and role of Gram-negative bac-terial porins, Curr. Protein Pept. Sci. 13 (2012) 843–854.
[3] H. Nikaido, Molecular basis of bacterial outer membrane permeability revisited, Microbiol. Mol. Biol. Rev. 67 (2003) 593–656.
[4] A. Alcaraz, E.M. Nestorovich, M. Aguilella-Arzo, V.M. Aguilella, S.M. Bezrukov, Salting out the ionic selectivity of a wide channel: the asymmetry of OmpF, Biophys. J. 87 (2004) 943–957.
[5] T.F. Moraes, M. Bains, R.E.W. Hancock, N.C.J. Strynadka, An arginine ladder in OprP mediates phosphate-specific transfer across the outer membrane, Nat. Struct. Mol. Biol. 14 (2007) 85–87.
[6] S. Varma, S.W. Chiu, E. Jakobsson, The influence of amino acid protonation states on molecular dynamics simulations of the bacterial porin OmpF, Biophys. J. 90 (2006) 112–123.
[7] M.M. Pérez-Madrigal, L.J. del Valle, E. Armelin, C. Michaux, G. Roussel, E.A. Perpète, C. Alemán, Polypyrrole-supported membrane proteins for bio-inspired ion channels, ACS Appl. Mater. Interfaces 7 (2015) 1632–1643.
[8] A. Puiggalí-Jou, M.M. Pérez-Madrigal, L.J. del Valle, E. Armelin, M.T. Casas,
C. Michaux, E.A. Perpète, F. Estrany, C. Alemán, Confinement of a β-barrel protein in nanoperforated free-standing nanomembranes for ion transport, Nano 8 (2016) 16922–16935.
[9] E.A. Della Pia, J.V. Holm, N. Lloret, C. Le Bon, J.L. Popot, M. Zoonens, J. Nygaìšrd, K.L. Martinez, A step closer to membrane protein multiplexed nanoarrays using biotin-doped polypyrrole, ACS Nano 8 (2014) 1844–1853.
[10] M. Kumar, J.E.O. Habel, Y.X. Shen, W.P. Meier, T. Walz, High-density reconstitu-tion of funcreconstitu-tional water channels into vesicular and planar block copolymer membranes, J. Am. Chem. Soc. 134 (2012) 18631–18637.
[11] A. Mecke, C. Dittrich, W. Meier, Biomimetic membranes designed from amphiphilic block copolymers, Soft Matter 2 (2006) 751–759.
[12] R. Valiokas, S. Vaitekonis, G. Klenkar, G. Trinkunas, B. Liedberg, Selective re-cruitment of membrane protein complexes onto gold substrates patterned by dip-pen nanolithography, Langmuir 22 (2006) 3456–3460.
[13] G. Roussel, A. Matagne, X. De Bolle, E.A. Perpète, C. Michaux, Purification, re-folding and characterization of the trimeric Omp2a outer membrane porin from Brucella melitensis, Protein Expr. Purif. 83 (2012) 198–204.
[14] J.C. Phillips, R. Braun, W. Wang, J. Gumbart, E. Tajkhorshid, E. Villa, C. Chipot, R.D. Skeel, L. Kalé, K. Schulten, Scalable molecular dynamics with NAMD, J. Comput. Chem. 26 (2005) 1781–1802.
[15] W.D. Cornell, P. Cieplak, C.I. Bayly, I.R. Gould, K.M. Merz, D.M. Ferguson, D.C. Spellmeyer, T. Fox, J.W. Caldwell, P.A. Kollman, A second generation force field for the simulation of proteins, nucleic acids, and organic molecules, J. Am. Chem. Soc. 118 (1996) 5179–5197.
[16] Y. Duan, C. Wu, S. Chowdhury, M.C. Lee, G. Xiong, W. Zhang, R. Yang, P. Cieplak, R. Luo, T. Lee, J. Caldwell, J. Wang, P. Kollman, A point-charge forcefield for molecular mechanics simulations of proteins based on condensed-phase quantum mechanical calculations, J. Comput. Chem. 24 (2003) 1999–2012.
[17] W.L. Jorgensen, J. Chandrasekhar, J.D. Madura, R.W. Impey, M.L. Klein, Comparison of simple potential functions for simulating liquid water, J. Chem. Phys. 79 (1983) 926–935.
[18] S. Abel, F.Y. Dupradeau, E.P. Raman, A.D. MacKerell, M. Marchi, Molecular si-mulations of dodecyl-β-maltoside micelles in water: influence of the headgroup conformation and forcefield parameters, J. Phys. Chem. B 115 (2011) 487–499. [19] T. Darden, D. York, L. Pedersen, Particle mesh Ewald: an N · log(N) method for
Ewald sums in large systems, J. Chem. Phys. 98 (1993) 10089–10092. [20] H.J.C. Berendsen, J.P.M. Postma, W.F. van Gunsteren, A. DiNola, J.R. Haak,
Molecular dynamics with coupling to an external bath, J. Chem. Phys. 81 (1984) 3684–3690.
[21] G.J. Martyna, D.J. Tobias, M.L. Klein, Constant pressure molecular dynamics al-gorithms, J. Chem. Phys. 101 (1994) 4177–4189.
[22] C. Tamerler, M. Sarikaya, Molecular biomimetics: utilizing nature's molecular ways in practical engineering, Acta Biomater. 3 (2007) 289–299.
[23] F. Eisenhaber, P. Lijnzaad, P. Argos, C. Sander, M. Scharf, The double cubic lattice method: efficient approaches to numerical integration of surface area and volume and to dot surface contouring of molecular assemblies, J. Comput. Chem. 16 (1995) 273–284.
[24] G. Kefala, C. Ahn, M. Krupa, L. Esquivies, I. Maslennikov, W. Kwiatkowski, S. Choe, Structures of the OmpF porin crystallized in the presence of foscholine-12, Protein Sci. 19 (2010) 1117–1125.
[25] J.-Y. Paquet, C. Vinals, J. Wouters, J.-J. Letesson, E. Depiereux, Topology prediction of Brucella abortus Omp2b and Omp2a porins after critical assessment of trans-membrane beta strands prediction by several secondary structure prediction methods, J. Biomol. Struct. Dyn. 17 (2000) 747–757.
[26] B. Dhakshnamoorthy, B.K. Ziervogel, L. Blachowicz, B. Roux, A structural study of ion permeation in OmpF porin from anomalous X-ray diffraction and molecular dynamics simulations, J. Am. Chem. Soc. 135 (2013) 16561–16568.
[27] J. Faraudo, C. Calero, M. Aguilella-Arzo, Ionic partition and transport in multi-ionic channels: a molecular dynamics simulation study of the OmpF bacterial porin, Biophys. J. 99 (2010) 2107–2115.
[28] E. García-Giménez, A. Alcaraz, M. Aguilella-Arzo, V.M. Aguilella, Selectivity of protein ion channels and the role of buried charges, J. Phys. Chem. B 119 (2015) 8475–8479.
[29] K.R. Pothula, C.J.F. Solano, U. Kleinekathöfer, Simulations of outer membrane channels and their permeability, Biochim. Biophys. Acta Biomembr. 1858 (2016) 1760–1771.
[30] L. Martínez, R. Andrade, E.G. Birgin, J.M. Martínez, PACKMOL: a package for building initial configurations for molecular dynamics simulations, J. Comput. Chem. 30 (2009) 2157–2164.
[31] W.G. Touw, C. Baakman, J. Black, T.A.H. Te Beek, E. Krieger, R.P. Joosten, G. Vriend, A series of PDB-related databanks for everyday needs, Nucleic Acids Res. 43 (2015) D364–D368.
[32] G. Bainbridge, G.A. Armstrong, L.G. Dover, K.F. Whelan, J.H. Lakey, Displacement of OmpF loop 3 is not required for the membrane translocation of colicins N and A in vivo, FEBS Lett. 432 (1998) 117–122.
[33] K.L. Lou, N. Saint, A. Prilipov, G. Rummel, S.A. Benson, J.P. Rosenbusch, T. Schirmer, Structural and functional characterization of OmpF porin mutants selected for larger pore size. I. Crystallographic analysis, J. Biol. Chem. 271 (1996) 20669–20675.
[34] P.S. Phale, A. Philippsen, T. Kiefhaber, R. Koebnik, V.P. Phale, T. Schirmer, J.P. Rosenbusch, Stability of trimeric OmpF porin: the contributions of the latching loop L2, Biochemistry 37 (1998) 15663–15670.