HAL Id: hal-00399609
https://hal.archives-ouvertes.fr/hal-00399609
Submitted on 26 Jun 2009
HAL is a multi-disciplinary open access
archive for the deposit and dissemination of
sci-entific research documents, whether they are
pub-lished or not. The documents may come from
teaching and research institutions in France or
abroad, or from public or private research centers.
L’archive ouverte pluridisciplinaire HAL, est
destinée au dépôt et à la diffusion de documents
scientifiques de niveau recherche, publiés ou non,
émanant des établissements d’enseignement et de
recherche français ou étrangers, des laboratoires
publics ou privés.
Fast and Accurate Embedded Systems Energy
Characterization Using Non-intrusive Measurements
Nicolas Fournel, Antoine Fraboulet, Paul Feautrier
To cite this version:
Nicolas Fournel, Antoine Fraboulet, Paul Feautrier. Fast and Accurate Embedded Systems Energy
Characterization Using Non-intrusive Measurements. Integrated Circuit and System Design. Power
and Timing Modeling, Optimization and Simulation 17th International Workshop, Sep 2007,
Gothen-burg, Sweden. pp.10-19, �10.1007/978-3-540-74442-9�. �hal-00399609�
Fast and Accurate Embedded Systems Energy
Characterization Using Non-intrusive
Measurements
Nicolas Fournel1, Antoine Fraboulet2, and Paul Feautrier1 1 INRIA/Compsys ENS de Lyon/LIP, Lyon F-69364 France 2 INRIA/Compsys INSA-Lyon/CITI, Villeurbanne F-69621 France
Abstract. In this paper we propose a complete system energy model based on non-intrusive measurements. This model aims at being inte-grated in fast cycle accurate simulation tools to give energy consumption feedback for embedded systems software design. Estimations takes into account the whole system consumption including peripherals. Experi-ments on a complex ARM9 platform show that our model estimates are in error by less than 10% from real system consumption, which is pre-cise enough for source code application design, while simulation speed remains fast.
1
Introduction
With present day technology, it is possible to build very small platforms with enormous processing power. However, physical laws dictate that high processing power is linked to high energy consumption. Embedded platforms are mostly used in hand held appliances, and since battery capacity does not increases at the same pace as clock frequency, designers are faced with the problem of minimizing power requirements under performance constraints.
The first approach is the devising of low-energy technologies, but this is out-side the scope of this paper. The second approach is to make the best possible use of the available energy e.g. by adjusting the processing power to the instanta-neous needs of the application, or by shutting down unused parts of the system. These tasks can be delegated to the hardware; however it is well known that the hardware only source of knowledge is the past of the application; only software that can anticipate future needs. Energy can also be minimized as a side effect of performance optimization. For instance, replacing a conventional Fourier trans-form by an FFT greatly improves the energy budget; the same can be said of data locality optimization, which aims at replacing costly main memory accesses by low-power cache accesses.
The ultimate judge in the matter of energy consumption is measurement of the finished product. However, software designers, compilers and operating systems need handier methods for assessing the qualities of their designs and directing possible improvements. Hence designers need simple analytical models which must be expressed in term of software visible events like instructions,
cache hits and misses, peripheral activity and the like. There are several ways of constructing such models. One possibility is electrical simulation of the design; this method is too time-consuming for use on systems of realistic size. Another method is to interpolate/extrapolate from measurements on a prototype. This is the method we have applied in this work.
The paper is organized as follows. After reviewing state of the art techniques in section 2 we present in section 3 a methodology to build complete platform en-ergy consumption models oriented for software development. Section 4 presents the resulting model for an ARM9 development platform. This section also val-idates our model on more significant pieces of code, multimedia applications, thanks to its implementation in a fast and cycle accurate simulation tool. We then conclude and discuss future work.
2
Related Works
Many works focus on energy characterization of VLSI circuits. We can organize them using two main criteria: their level of hardware abstraction and the cali-bration method. For the first criterion, we can group the models in three main categories which are, by increasing level of abstraction, transistor/gate level mod-els, architectural level models and finally instruction level models. Among these models there are usually three methods for building consumption models. The first method is analytical construction, the second one is simulation based, and the third is based on physical measurements.
In transistor (gate) level models, all transistor (gate) state changes are com-puted to give an energy consumption approximation for a VLSI component. This method is highly accurate, but a complete description of the component is needed. The models built at this level of abstraction are generally reserved to hardware designers and are very long to simulate.
At the upper level of abstraction, architectural or RTL level, the system is divided in functional units. Each unit can be represented by a specific model adapted to its internal structure.(e.g. bit-dependent or bit-independent models for Chen et al. [1]). To be more accurate some works, like Kim et al. [5], subdivide the block into sub-blocks to apply different models on each sub-block. This family of models allows to extend model to a complete platform, but the models proposed so far are not able to execute a full software system.
The highest level is instruction/system level of abstraction. At this level, models are based on events such as instructions execution ([13,7,9]). Tiwari et al. in [13] propose to characterize the inter-instructions energy consumption, which represents the logic switching between two different instructions. Others works also take into account the logic switching due to data parameters [11]. The system considered in these models is generally composed of CPU, bus and memory. Only few works focus on modeling a complete platform. Among them, EMSIM [12] is a simulator based on Simunic et al. [10] model for the StrongARM SA110 energy characterization. This simulator poorly characterizes the periph-erals. The SoftWatt simulator proposed in [4] uses a complete system simulator
based on SimOS to monitor a complex operating system and interactions among CPU, memory hierarchy and hard disk operations. Their simulator is modified to include analytical energy models and the output reports kernel and user mode energy consumption up to the operating system services level of granularity. Data are sampled during simulation and dumped to log files at a coarser granularity than cycle level, leading to average power consumption figures. The closest work to ours, AEON’s model [6], is a complete platform energy consumption model based on measurement and uses simulator internal energy counters. The tar-geted platform is an 8 bit AVR micro-controller based sensor network node that does not include CPU pipelines, complex memory hierarchy and peripherals. Our model allows the simulation of much more complex hardware architectures while being independant of simulator internals.
As far as calibration methods are concerned, analytical models are generaly based on manufacturers data, e.g. in Simunic et al. [10] the model is built thanks to datasheet informations. Simulation based calibration needs a full knowledge of the underlying level architecture, which means that it needs a description of low level hardware (VHDL, or Verilog descriptions). Measurement based methods only need few informations on the hardware and works like [13,2] have shown that it is possible to extract internal unit consumption from system measurements.
In this paper we propose a methodology for complete platform energy con-sumption model construction based on simple and non-intrusive measurements. The model is built at a level of abstraction close to the system level presented before, but is extended to the complete platform by coupling it with architec-tural level principles presented by Kim et al. in [5]. We also take peripherals energy models and dynamic frequency and voltage scaling into account.
3
Model construction basics
We present in this section our methodology to build complete platform models. We first give more details on the structure and the parameters of the energy model. Section 4 will present the target dependent model parameters through a case study on an ARM9 based platform.
3.1 Model structure and parameters
Our choice among all the modeling methods which have been presented in Sect. 2 is to build an architectural level model, in which the system is divided into its main functional blocks at the platform based level such as CPU, interconnection bus, memory hierarchy, peripherals. . . The energy consumption of an application Eapp is obtained be adding all blocks consumptions Ebl.
Each block can have its own energy consumption model. To have a platform model better suited for software development, we use instruction level abstrac-tion for CPU. CPU energy consumpabstrac-tion ECPU is described in equation 1.
The energy consumption is the sum of the energy consumed by instruction execution, plus cache and MMU overheads consumptions, and consumption of all other blocks of the platform.
Eapp= ECPU+
X
Ebl (2)
This model aims at being integrated in a full platform cycle accurate simula-tion tool. The most interesting way of writing the model for this kind of purpose is to define a time slot energy consumption. The chosen time slot is the CPU instruction execution. There are two reason for choosing this time reference. The first is that it is the finest time reference since CPU have generally the high-est clock frequency in embedded systems. Secondly, interrupt requhigh-ests, the only mean for the hardware peripherals to interact with the software, are managed at the end of instructions execution. From a software point of view, there is no need to use a finer time reference to report hardware events more precisely.
The model can be rewritten in a form where the consumption of CPU and other blocks are reported for the currently executed instruction. All E∗ will be kept for overall application consumptions, for the sake of notation simplicity the consumption at instruction level of granularity will be noted as E∗. This new model formula is expressed in the following equation:
Eslot= ECPU+ X
blocks
Ebl (3)
The last peculiarity in this model is the measurement based data collection. As we only get global measures for the platform consumption, we can foresee that the base consumptions of each block will not be easily distinguishable. We mean here that once the embedded system is put in its laziest state, idle state for example with all possible units powered off, the resulting consumption is consid-ered as a base consumption regrouping the base consumption of every powconsid-ered peripherals. Obviously, a part of this consumption is static power dissipation. We will call this term Ebase, it is important to note that this consumption is
reported to the current executed instruction on the CPU. It can be expressed as in equation (5), as it is dependent on the instruction length linsn in terms of
clock cycles. Equation (3) becomes equation (4).
Eslot= Ebase+ ECPU+XEbl (4) Ebase= linsn× Ec base (5) The CPU and other blocks consumption are then expressed as overhead against the idle state. As described in equation (1), CPU energy consumption is given by the executed instruction energy cost. This model can be simplified by regrouping instructions in classes as proposed in [7]. As far as other blocks are concerned, we can expand them as bus, memories and other peripherals. This is interesting since bus and memories will be subject to events generated by the processor, such as memory writes. The peripherals will be then modeled by state machines giving the energy consumption of the peripheral during the time slot.
The last step in model construction consists in defining all possible parame-ters for these components. Due to the limited information available, the devel-opers would not necessarily know the behavior of intra-blocks logic. The param-eters for the CPU are already selected, since it is modeled thanks to instructions consumptions. The same can be done for cache, MMU and even co-processors consumptions. The parameters for other blocks are limited to behavioral param-eters (UART sending a byte) and their states such as operating modes.
Each energy cost in this model is function of the running frequency and power supply voltage to allow dynamic and frequency scaling capabilities of the platform to be modeled. An example of this is presented in the next section.
4
Model Construction Case Study
In this section we propose an example of our methodology application. This methodology was applied on a ARM based development board. This platform uses an ARM922T and usual embedded systems peripherals (e.g. UART, Timers, network interface) on the same chip. Our hardware architecture exploration re-veals that the platform has three distinct levels of memory, a cache, a scratchpad and main memory. All peripherals are accessible through two levels of AMBA bus. We will give details about the energy consumption model construction for this platform, then we will check the accuracy of the resulting model.
4.1 Methodology application
The complete platform modeling method presented in section 3.1 is applied on our ARM9 platform in this section. The measurement setup used for these ex-periments is close to the one depicted in [9]. We used a digitalizing oscilloscope, the shunt resistor is replaced by a current probe and we also used a voltage probe. Calibration benchmarks.We built benchmarks to calibrate our model, more precisely our block models. The hardware exploration gives us the main blocks to be modeled, namely the CPU, the different bus levels, the memory levels, and the other peripherals such as UART, interrupt controller or timers.
For example, the selected parameters for our CPU model are the CPU in-structions, or possibly class of inin-structions, plus the caches and MMU activities. We thus built benchmarks to evaluate the cost of possible parameters, in order to select only relevant ones. Here are examples of benchmarks that were used, and their target event:
• loop-calibration:Measurement loop overhead benchmark. By running an empty loop, we can estimate the loop overhead.
• insn-XXX:Comparison of CPU instructions execution costs (add, mov, . . . ). The target instruction is executed many times inside a loop.
• XXX-access: Calibration of costs of each bus level (AHB1/2) and memory level (cache, scratchpad or main memory), depending on the address accessed. • timer-test:Example of peripherals energy characterization, this benchmark
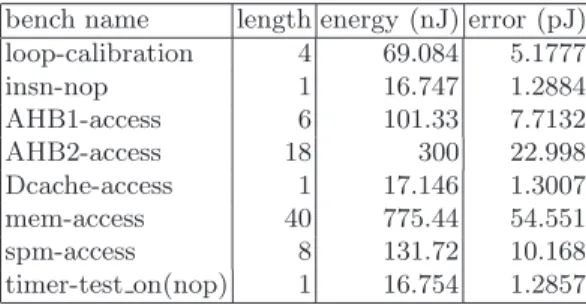
Table 1.Benchmarks results for simple operation energy calibration
bench name length energy (nJ) error (pJ) loop-calibration 4 69.084 5.1777 insn-nop 1 16.747 1.2884 AHB1-access 6 101.33 7.7132 AHB2-access 18 300 22.998 Dcache-access 1 17.146 1.3007 mem-access 40 775.44 54.551 spm-access 8 131.72 10.168 timer-test on(nop) 1 16.754 1.2857
allows us to measure the timer power consumption. It is subdivided into two benchmarks, one in which the timer is stopped and the second in which the timer is running. The structure of the loop is the same as the insn-XXX bench-mark with a nop instruction.
Calibration results. Benchmark energy results examples are listed in table 1. Full results are available in [3]. These results represent for each benchmark the length of the calibrated event in CPU clock cycles (second column), the per-event raw energy cost measured on the complete platform (third column) and the measurement error (fourth column). Energy costs reported here give the consumption of the complete platform for an full event execution. These raw costs have to be refined to get the final parameters.
As an example, the scratchpad memory access benchmark result (spm-access) gives the energy consumption of the CPU executing a load instruction, the bus conveying the load request and response and finally the scratchpad memory. The bus access cost includes the register accesses in the targeted peripherals since it is impossible to dissociate their costs. By removing the consumption of the CPU (one load and seven nop) and bus consumption, we finally obtain the scratch-pad memory access cost. Experiments reported in [3] shows that the scratchscratch-pad memory does not consume more energy than a register accessed via the bus.
Other model simplifications are possible. For example, the CPU cache models are simplified by taking into account only memory access bursts in case of misses since the overhead can be neglected.
The basic model presented in section 3.1 can be rewritten, by using models simplifications obtained by calibration. We found that most instructions have the same energy consumption as long as they stay inside the CPU. Currently only ARM32 instruction set is modeled. Thumbs (16bit) instruction set can be modeled using the same benchmark methodology. In our setup, it is not possible to isolate the instruction cache consumption, which is lumped with the instruction consumption. ICache misses can be modeled as memory accesses.
We finally have a model for which CPU instructions are grouped in two classes, arithmetic and logic intra-CPU instructions, and load / store instruc-tions. A memory load access is modeled as a load instruction, plus a bus over-head, plus a memory overhead. Peripherals energy consumption are taken into
1 3 5 7 9 11 13 15 17 0.0e+00 2.0e−07 4.0e−07 6.0e−07 8.0e−07 1.0e−06 1.2e−06 1.4e−06 1.6e−06 1.8e−06 2.0e−06 clock divisor
energy per event (J)
+ + + + + + + + + + + + + + + + + + + + + + + + + loop−cal insn−cmp_mul insn−cmp_nop AHB1−reg−write AHB2−reg−write
Fig. 1.Multiple frequencies experiments: This figure shows that the energy per event increases linearly with the clock period.
account thanks to state machines that give their consumption during instructions execution. The final model is written on Equation (6).
Eslot= Ebase+ Einsn+ Ebus access+ Emem+XEperiph state (6) Eslotis the energy consumption of the instruction execution time slot, Einsn is the cost of instruction given by its class cost, Ebus access is the bus overhead
cost for load or store instructions, Emem is the overhead for memory accesses.
The last term represents the sum of the energy overhead of peripherals state. These cost are all overhead costs, since the full consumption of a peripheral cost, for example, is given by its base energy cost comprised in Ebaseand the overhead.
Frequency Scaling.The model presented before is valid for full speed software execution. However, the Integrator CM922T has frequency scaling capabilities but no dynamic voltage scaling (DVS) capabilities, hence when we reduce the frequency we cannot decrease energy consumption. When repeating five bench-marks at different frequencies, we obtain the curves in Fig. 1. This figure rep-resents the per event energy values for the five benchmarks as a function of the clock divisor, r = ffref where fref is the nominal frequency (198 MHz here).
These curves show that energy per event increases when frequency is de-creased, and this may seem counter-intuitive. To understand these results ob-serve first that a given event, e.g. the execution of some specific instruction, entails an almost constant number of bit flips, and that each flip uses a fixed amount of energy. Hence, to a first approximation, and in the absence of volt-age scaling, the energy for a given event should be a constant. However, in our platform, frequency scaling acts only on the processor and Excalibur embedded peripherals; the consumption of other peripherals and external memories is not affected. Hence, the addition of a parasitic term which is roughly proportional to
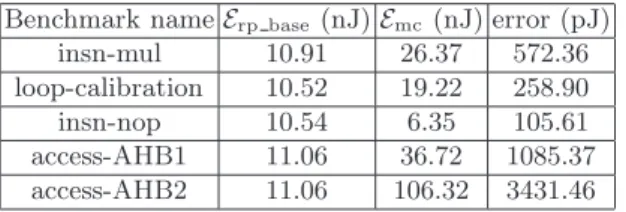
Table 2.Linear regression from curves of Fig. 1 based on the formula 7
Benchmark name Erp base (nJ) Emc(nJ) error (pJ) insn-mul 10.91 26.37 572.36 loop-calibration 10.52 19.22 258.90 insn-nop 10.54 6.35 105.61 access-AHB1 11.06 36.72 1085.37 access-AHB2 11.06 106.32 3431.46
the duration of the event or inversely proportional to frequency. This is clearly the case for the curves of Fig. 1.
We must underline that all five benchmarks generate activity in the modified clock domain (CPU), but not on the remaining part of the platform. On top of that we kept all peripherals in the modified clock domain in an idle state. Hence, the event energy cost namely Eevt, which can be an instruction execution or a bus
access for examples. In this consumption we can identify two types of sources. The first is the energy due to modified clock domain Emc, which is constant
The second is the one due to the remaining part of the platform Erp base. Their
relation in the total consumption of event is given by relation:
Eevt= Erp base× linsn× r+ Emc (7) The first term is dependent on the frequency ratio r and the instruction length linsn, whereas the second is not. Linear regressions on the results presented in
Fig. 1 are shown on table 2. As shown in this table, equation (7) give a good explanation for the experiments on clock frequency variation. These results gives us an estimation of what we can consider as base energy, which is not changing against software execution. The last two columns are the events real consumption and the regression error. The value for the base energy can be approximated by the mean value 10.82 nJ per cycle (with a standard deviation of ±2.6 10−2).
4.2 Model validation
We describe here our accuracy tests experiments. Our model is implemented in a simulator, and its results were compared to physical measurements.
Simulator Integration. Our model is implemented in a simulation tool suite. The simulation tools are composed of two simulators. The first is a complete platform functional simulator in charge of generating a cycle-accurate execution trace of the software. This trace reports all executed instructions, and all pe-ripherals activities (state changes). This first step allow software developers to functionally debug their applications and supply them the material to make the second step simulation. To fulfill this first task, we implemented the behaviour of the Integrator platform in the open source simulator skyeye. We also up-graded it to the cycle accurate trace generation. The second tool is the energy simulation tool. This simulator implements the model presented in the previous
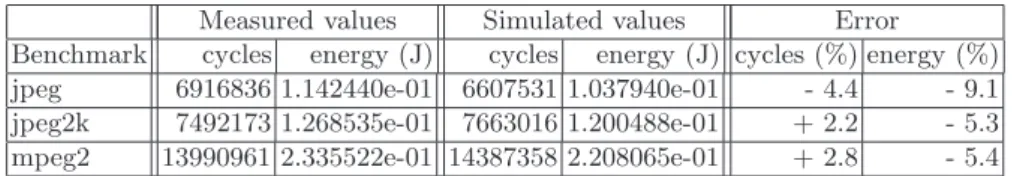
Table 3. Simulators results: the results obtained for execution time and en-ergy consumption by real hardware measurement are shown in second and third columns, the simulation ones in fourth and fifth columns. The last two columns give the error percentile of the simulation
Measured values Simulated values Error
Benchmark cycles energy (J) cycles energy (J) cycles (%) energy (%) jpeg 6916836 1.142440e-01 6607531 1.037940e-01 - 4.4 - 9.1 jpeg2k 7492173 1.268535e-01 7663016 1.200488e-01 + 2.2 - 5.3 mpeg2 13990961 2.335522e-01 14387358 2.208065e-01 + 2.8 - 5.4
section. Its main task is to compute model parameters from the cycle-accurate execution trace. It accumulates all computed energies, and reports them in an energy profile file for source level (C code) instrumentation and annotation. Validation Methodology. To check the accuracy of the resulting model, we propose to compare the consumption estimation of the model, thus implemented in our tool to physical measurement on the real platform. The test application chosen for this model validation are widely spread multimedia applications : JPEG, JPEG2000 and MPEG2. The implementations of these three applica-tions are Linux standard libraries. Hence they use operating system services and standard libc functions. All experiments could have been made with Linux (or even uClinux), since the simulation tools are complete enough to run these operating systems. For limited measurement duration reasons, we decided to re-place these heavy OS by the lightweight one, Mutek [8]. Linux hardware layer abstraction makes interrupt request managment too long to allow a reasonable sized image to be decoded in our measure time window. The three applications are executed in the simulation tools to get estimations of their execution. Accuracy. Results of model estimations and physical measurements are pre-sented in table 3. The second and third columns reports the physical measure-ment results, in terms of execution duration in CPU clock cycles and in terms of energy consumption in Joules. Fourth and fifth columns gives the same kind of informations concerning the simulation results. Finally, the last two columns gives the percentile error of simulation errors of the simulation results against the physical measurement on the target hardware platform. These results show that a 10% error rate can be achieve by our simple complete platform energy model. This estimations are obtained in roughly less than a minute (25s for the first simulation plus 20s for the second). We think that the error rate of 10% is largely acceptable in regard of the simulation time.
5
Conclusion
In this paper we have explained how an accurate, energy consumption model for a full embedded system can be built from external measurements and
micro-benchmarks. Our methodology requires a prototype platform of comparable technology. Quantitative energy data are gathered at the battery output and are translated into per instruction energy figures by data analysis. The resulting model is thus driven by the embedded software activity and can be used with a simulation execution trace as input. It is thus possible to very easily add an energy estimator to a software functional simulator so as to get feedback at the source level. As simulation tools modifications are kept at a minimum the sim-ulation speed is not impacted. Consumption data clearly identify power hungry operations, thus offering guidelines for software design tradeoffs. The model built on an ARM9 based development board using this methodology achieved an error rate of less than 10 % at the source level, which is acceptable compared to its simplicity of implementation and its fast running time.
References
1. R. Y. Chen, M. J. Irwin, and R. S. Bajwa. Architecture-level power estimation and design experiments. In ACM TODAES, volume 6, pages 50–66, January 2001. 2. G. Contreras, M. Martonosi, J. Peng, R. Ju, and G.-Y. Lueh. XTREM: a power
simulator for the Intel XScale core. In LCTES ’04, pages 115–125, 2004.
3. N. Fournel, A. Fraboulet, and P. Feautrier. Embedded Systems Energy Charac-terization using non-Intrusive Instrumentation. Research Report RR2006-37, LIP - ENS Lyon, Nov 2006.
4. S. Gurumurthi, A. Sivasubramaniam, M. J. Irwin, N. Vijaykrishnan, M. Kandemir, T. Li, and L. K. John. Using complete machine simulation for software power esti-mation: The softwatt approach. In International Symposium on High Performance Computer Architecture, 2002.
5. N. S. Kim, T. Austin, T.r Mudge, and D. Grunwald. Power Aware Computing, chapter Challenges for Architectural Level Power Modeling. Kluwer Academic, 2001.
6. O. Landsiedel, K. Wehrle, and S. G¨otz. AEON: Accurate Prediction of Power Consumption in Sensor Nodes. In SECON, Santa Clara, October 2004.
7. M. T.-C. Lee, M. Fujita, V. Tiwari, and S. Malik. Power analysis and minimization techniques for embedded dsp software. IEEE Transactions on VLSI Systems, 1997. 8. F. P´etrot and P. Gomez. Lightweight Implementation of the POSIX Threads API for an On-Chip MIPS Multiprocessor with VCI Interconnect. In DATE 03 Embedded Software Forum, pages 51–56, 2003.
9. J. T. Russell and M. F. Jacome. Software power estimation and optimization for high performance, 32-bit embedded processors. In International Conference on Computer Design, October 1998.
10. T. Simunic, L. Benini, and G. De Micheli. Cycle-accurate simulation of energy consumption in embedded systems. In 36th Design Automation Conference, pages 867–872, May 1999.
11. S. Steinke, M. Knauer, L. Wehmeyer, and P. Marwedel. An accurate and fine grain instruction-level energy model supporting software optimizations. In PATMOS, 2001.
12. T. K. Tan, A. Raghunathan, and N. K. Jha. EMSIM: An Energy Simulation Framework for an Embedded Operating System. In ISCAS 2002, May 2002. 13. V. Tiwari, S. Malik, A. Wolfe, and M. Lee. Instruction level power analysis and