HAL Id: tel-02479399
https://hal.univ-lorraine.fr/tel-02479399
Submitted on 14 Feb 2020HAL is a multi-disciplinary open access archive for the deposit and dissemination of sci-entific research documents, whether they are pub-lished or not. The documents may come from teaching and research institutions in France or abroad, or from public or private research centers.
L’archive ouverte pluridisciplinaire HAL, est destinée au dépôt et à la diffusion de documents scientifiques de niveau recherche, publiés ou non, émanant des établissements d’enseignement et de recherche français ou étrangers, des laboratoires publics ou privés.
Extraction liquid-liquide modulée électrochimiquement
et microextraction en phase solide de composés
pharmaceutiques sélectionnés
Maizatul Najwa Jajuli
To cite this version:
Maizatul Najwa Jajuli. Extraction liquid-liquide modulée électrochimiquement et microextraction en phase solide de composés pharmaceutiques sélectionnés. Chimie. Université de Lorraine; Universiti Sains Malaysia (Malaisie), 2019. Français. �NNT : 2019LORR0127�. �tel-02479399�
AVERTISSEMENT
Ce document est le fruit d'un long travail approuvé par le jury de
soutenance et mis à disposition de l'ensemble de la
communauté universitaire élargie.
Il est soumis à la propriété intellectuelle de l'auteur. Ceci
implique une obligation de citation et de référencement lors de
l’utilisation de ce document.
D'autre part, toute contrefaçon, plagiat, reproduction illicite
encourt une poursuite pénale.
Contact : ddoc-theses-contact@univ-lorraine.fr
LIENS
Code de la Propriété Intellectuelle. articles L 122. 4
Code de la Propriété Intellectuelle. articles L 335.2- L 335.10
http://www.cfcopies.com/V2/leg/leg_droi.php
Thèse
Ecole doctorale C2MP
Présentée et soutenue publiquement pour l’obtention du titre de
DOCTEUR de L’UNIVERSITÉ DE LORRAINE
Spécialité : Chimie Présentée par :
MAIZATUL NAJWA BINTI JAJULI
Extraction liquid-liquide modulée électrochimiquement
et microextraction en phase solide de composés
pharmaceutiques sélectionnés
Thèse soutenue publiquement le 22 août 2019 à Penang (Malaisie) devant le jury composé de : Isabelle, BILLARD Directeur de Recherche CNRS, Université de
Grenoble Alpes
Rapporteurs Zulkarnain ZAINAL Professeur, Universiti Putra Malaysia Rapporteurs
Sabariah ISMAIL Professeur USM Examinateurs
Noor Hana Hanif ABU BAKAR Maitre de Conférence, USM Examinateurs Gregoire HERZOG Chargé de Recherche, CNRS LCPME Examinateurs Bahruddin SAAD Professeur, Universiti Teknologi Petronas Examinateurs Marc HEBRANT Professeur, UL LCPME, Directeur de thèse Membres invités Afidah ABDUL RAHIM Professeur, USM, Malaysia Membres invités Mohd. Hazwan HUSSIN Maitre de Conférence, USM, Directeur de thèse Membres invités Rohana ADNAN Professeur, Dean USM Membres invités
Laboratoire de Chimie Physique et Microbiologie pour les Matériaux et l’Environnement (LCPME), UMR CNRS-UL 7564 - 405 rue de Vandoeuvre, 54600, Villers-lès-Nancy, France
ii
ACKNOWLEDGEMENT
First and foremost, my sincere glorifications and adorations go to Almighty Allah for his guidance, protection and strength over me to complete my co-tutelle research study between Universiti Sains Malaysia (USM) and Universite de Lorraine (UL). I would like to express my sincere gratitude to my supervisors, Dr. Mohd. Hazwan Hussin, Professor Bahruddin Saad and Professor Afidah Abdul Rahim from USM and Professor Marc Hebrant and Dr. Gregoire Herzog from UL for their supervision and insightful guidance throughout the entire period of my research. I will forever remain grateful for the continued help and wise counselling. The time, which they have invested in me, resulted in my tremendous personal development – I am in their debt.
My sincere appreciation goes to USM for its financial support under Graduate Research Assistance (GRA) and USM Short Term Grant (304/PKIMIA/6313303). I am also grateful for Campus France and Agence National de la Recherche Grant (ANR-14-CE14-002-01) for financial support in France.
Next, I would like to address my appreciation to the colleagues who contributed in this work Dr. Alonso Gamero-Quijano, and Dr. Mazidatul Akmam for the help and discussions. I would also like to thank my colleagues, Nur Hidayah, Nadhiratul Farihin, Syaza Atikah, Umie Fatihah and Nor Amira for their emotional support. Thank you to Martha Collins and Cheryl Karman, the ultimate lab and lunch partner. Also, other labmates Tauqir Nasir, Maciej Mierzwa, Lin Zhang, Christelle Ghazally, Salima Mesli, and others. Furthermore, thank you for the people who have helped me in the laboratory. Mr Zamri for the HPLC, Jaun Paul and Claire Genois for the technical assistance in LCPME.
iii
My sincere gratitude and love go to my dear parents, Jajuli bin Marzuki and Hafsah binti Rafiee and the entire family for the consistent love, support, encouragement and guidance shown to me during the course of my study. To all my dear friends (especially KK12) whom I am so lucky to have, thanks for all your contributions both directly and indirectly towards my project and the entire PhD’s programme.
iv
TABLE OF CONTENTS
ACKNOWLEDGEMENT ii
TABLE OF CONTENTS iv
LIST OF TABLES viii
LIST OF FIGURES x
LIST OF ABBREVIATIONS xviii
LIST OF SYMBOLS xxi
ABSTRAK xxii
ABSTRACT xxiv
RÉSUMÉ xxvi
CHAPTER 1 INTRODUCTION 1
1.1 Sample preparation 1
1.1.1 Liquid-liquid extraction (LLE) 2
1.1.2 Solid phase extraction (SPE) 3
1.2 Solid phase microextraction 4
1.2.1 Adsorbents 11
1.3 Liquid phase micro-extraction (LPME) 13
1.3.1 Electrified interface between two immiscible electrolytes solutions
17
1.3.2 Pseudo Nernst equation on ITIES 18
1.3.3 Polarizable and non-polarizable liquid-liquid interfaces 20
1.3.4 Charge transfer at the ITIES 21
1.3.5 Electrochemically modulated liquid-liquid extraction 23
1.4 Target analytes 26
v Phenformin)
1.4.2 Beta -blocker drug (Propranolol) 29
1.5 General problem statements 30
1.6 Objectives 32
1.7 Scope of study 33
CHAPTER 2 GENERAL EXPERIMENTAL METHOD 34
2.1 Experimental method I (Chapter 3 & 4) 34
2.1.1 Chemicals & reagents 34
2.1.2 Instrumentation 35
2.1.3 Cyclic voltammetry 36
2.1.4 Preparation of standard solution, aqueous and organic phase 38 2.1.5 Preparation of organic salt (BTPPA+TPBCl-) 38
2.2 Cyclic voltammetry studies 39
2.3 Experimental method II (Chapter 5) 44
2.3.1 Chemicals & reagents 44
2.3.2 Instrumentation 45
CHAPTER 3 ELECTROCHEMICALLY MODULATED
LIQUID-LIQUID EXTRACTION BASED ON
POTENTIOSTATIC METHOD
46
3.1 Methodology 46
3.1.1 Experimental strategy 46
3.1.2 Sample preparation by applying potential using potentiostat 46
3.2 Results and discussion 48
3.2.1 Optimization of HPLC method 48
vi
3.2.3 Hydrodynamic cell 55
3.2.4 Electrochemical extraction as sample preparation 64
3.3 Conclusion 71
CHAPTER 4 ELECTROCHEMICALLY MODULATED
LIQUID-LIQUID EXTRACTION BASED ON
POTENTIOSTATIC-FREE METHOD
72
4.1 Methodology 72
4.1.1 Cyclic voltammetry of rotating paddle in static ITIES cell 72 4.1.2 Preparation of standard solution, aqueous and organic phase 72 4.1.3 Preparation of organic salt (TMA+TPBCl-) 73
4.1.4 Preparation of urine samples 73
4.1.5 Sample preparation by interfacial potential difference by common ion
74
4.1.6 Method validation 75
4.2 Results and Discussion 77
4.2.1 Sample preparation using interfacial potential 77
4.2.2 Method of validation 99
4.3 Comparison to previously reported analytical methods 102
4.4 Conclusion 106
CHAPTER 5 GRAPHENE AND ZEOLITE AS ADSORBENTS IN BAR-MICRO-SOLID PHASE EXTRACTION FOR THE HPLC DETERMINATION OF SELECTED PHARMACEUTICAL COMPOUNDS
107
5.1 Methodology 107
5.1.1 Preparation of standard solutions 107
5.1.2 Urine samples 107
vii
5.1.4 Bar-µ-SPE procedure 109
5.1.5 Method validation of bar-µ-SPE- HPLC method 111 5.1.6 Extraction efficiency (EE %) and enrichment factor (EF) 112
5.2 Results and discussion 113
5.2.1 Optimization of HPLC method 113
5.2.2 Type of adsorbents 115
5.2.3 Mixed-adsorbent 139
5.2.4 Comparison of performance between individual and mixed adsorbent
145
5.2.5 Comparison with previously reported analytical methods 147
5.3 Conclusion 150
CHAPTER 6 GENERAL CONCLUSIONS AND SUGGESTIONS FOR FUTURE STUDIES
151
6.1 Conclusion 151
6.2 Suggestions for future studies 154
REFERENCES 156
APPENDICES
viii
LIST OF TABLES
Page
Table 1.1 Steps involved in LLE, SPE and SPME as sample preparation method (Alpendurada, 2000)
5
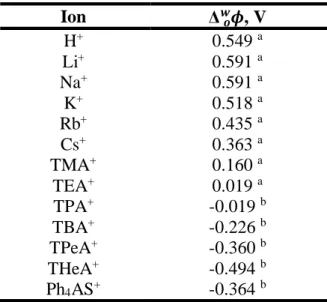
Table 1.2 Techniques that are related to SPME method 7 Table 1.3 Relative permittivity, ε of solvents at 25°C 18 Table 1.4 Standard ion-transfer potentials, Δwoϕ for different cations
across interface of 1,2- dichloroethane and water
21
Table 1.5 Standard ion-transfer potentials, Δwoϕ for different anions across interface of 1,2- dichloroethane and water
22
Table 1.6 Analytes of interest on ITIES applications 24 Table 1.7 Chemical structure, pKa, log P0 values for biguanide
compounds
27
Table 1.8 Chemical structure, pKa, log P0 values for PROP 29
Table 3.1 Transfer potential, pKA, and log P0 for each drug 52
Table 3.2 Current density for each electrochemical cell 62 Table 4.1 Equations of various boundary lines with coordinates of
their end points a) MET b) PHEBI c) PHEN. The equations given correspond to the boundary lines shown in Figures 4.3-4.5. For all calculations, we have considered Vorg = Vaq
82
Table 4.2 Equations of various boundary lines with coordinates of their end points for PROP. The equations given correspond to the boundary lines shown in Figures 4.6. For all calculations, we have considered Vorg = Vaq
83
Table 4.3 Variation of conditions for the extraction step. Optimised parameters are in bold
91
Table 4.4 Variation of conditions for the back-extraction step. Optimised parameters are shown in bold
91
Table 4.5 Composition of the different phases for the control experiments 1-3
ix
Table 4.6 Analytical parameters for the proposed method for MET, PHEBI and PHEN
102
Table 4.7 Comparison of the analytical performances of published extraction procedures with the method reported here
104
Table 5.1 Summary of the adopted conditions of bar-µ-SPE-HPLC method using graphene and zeolite as adsorbent
137
Table 5.2 Analytical parameters for the bar-uSPE-HPLC method using graphene as adsorbent
138
Table 5.3 Analytical parameters for the bar-uSPE-HPLC method using zeolite as adsorbent
138
Table 5.4 Recovery for urine that was spiked with 950 µg L-1 of drugs mixture (n = 6)
139
Table 5.5 Summary of the final adopted conditions of bar-µ-SPE-HPLC method using mixed-adsorbent
142
Table 5.6 Analytical parameters for the bar-uSPE-HPLC method using mixed-adsorbent
143
Table 5.7 Intraday precision of the method using mixed-adsorbent (n=6)
144
Table 5.8 Interday precision of the method using mixed-adsorbent (n=6)
144
Table 5.9 Recovery of urine sample for using mixed-adsorbent (n=6) 144 Table 5.10 Comparison of previously determination method for MET,
BUF, PHEN and PROP with this work
x
LIST OF FIGURES
Page
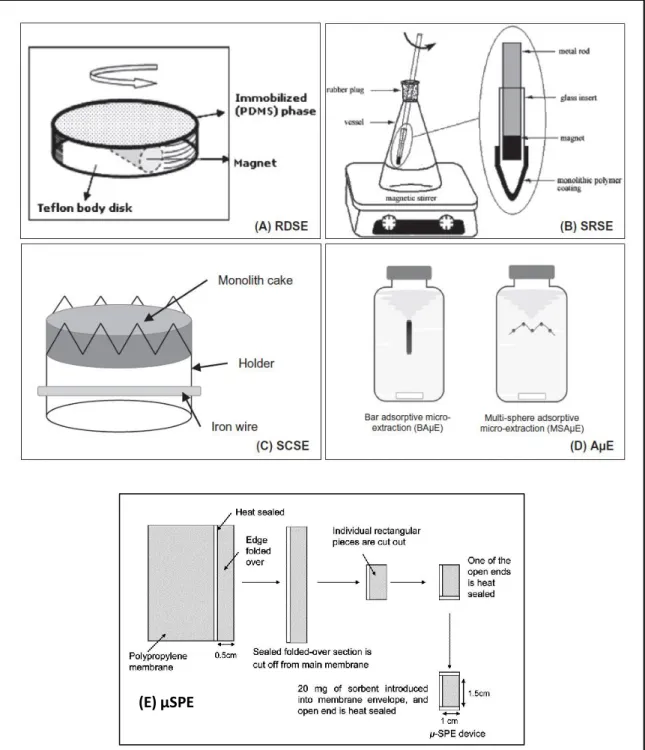
Figure 1.1 Configuration of sorbent in RDSE, SRSE, SCSE, AµE and µSPE method (Gilart et al., 2014; Sajid, 2017)
10
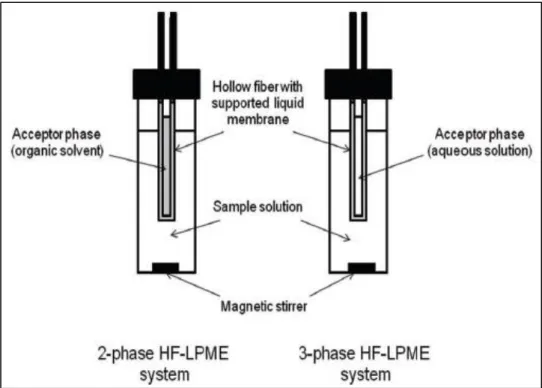
Figure 1.2 Summary on types of commercial adsorbents 11 Figure 1.3 Illustration of SDME methods (Tang et al., 2018) 14 Figure 1.4 Illustration of two- and three-phases of HF-LPME method
(Vičkačkaitė and Padarauskas, 2012)
15
Figure 1.5 Illustration of DLLME method (Vičkačkaitė and Padarauskas, 2012)
16
Figure 2.1 Custom made electrochemical cells a) Static ITIES cell b) Rotating paddle in ITIES cell c) Rotating disk electrode with PET membrane supported ITIES for ion transfer studies. REorg: Reference electrode for the organic phase; REaq:
Reference electrode for the aqueous phase; CEaq: Counter
electrode for the aqueous phase; CEorg: counter electrode for
the organic phase
35
Figure 2.2 Metathesis reaction of BTPPA+TPBCl- 38
Figure 2.3 Custom made electrochemical cell or ITIES cell for ion transfer studies. REorg: Reference electrode for the organic
phase; REaq: Reference electrode for the aqueous phase;
CEaq: Counter electrode for the aqueous phase; CEorg:
counter electrode for the organic phase
39
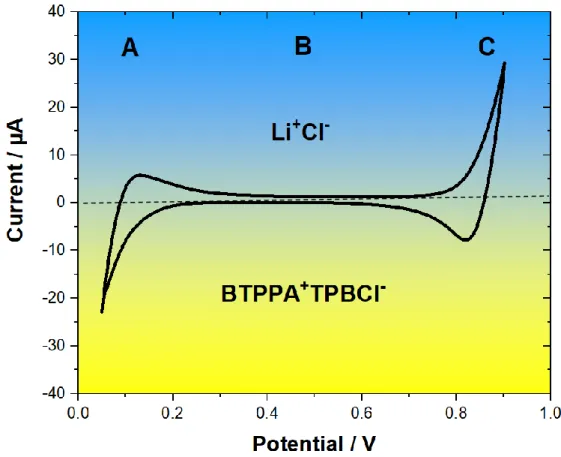
Figure 2.4 Voltammogram for blank solution. Aquoues phase: 10 mm LiCl, Organic phase: 10 mM BTPPA+TPBCl- in 1,2- DCE,
Reference electrode: Ag/AgCl, Counter electrodes: Pt, Scan rate: 5mV s-1. Blue region: Water, Yellow region: DCE
40
Figure 2.5 Voltammogram for blank solution containing MET. Aquoues phase: 10 mm LiCl, Organic phase: 10 mM BTPPA+TPBCl- in 1,2- DCE, Reference electrode: Ag/AgCl, Counter electrodes: Pt, Scan rate: 5mV s-. Blue
region: Water, Yellow region: DCE
42
xi
Figure 3.1 Experimental procedure of the electrochemically modulated liquid-liquid extraction. Target cations are extracted from the aqueous sample to organic phase before being back-extracted to a final aqueous phase. The numbers 1, 2 and 3 correspond to the initial, intermediate and final stages at which the aqueous phases are analysed by HPLC
47
Figure 3.2 Chromatogram of MET, PHEBI, PHEN and PROP. Mobile phase: Phosphate buffer, 50: ACN, 50: triethylamine, 0.2. Column: Zorbax TMS (250 x 4.6 mm). Flow rate: 1.3 mL min-1. Injection volume: 20 µL. Column temperature: 40 °C. Wavelength: 230 nm. Concentration of analytes: 16.4 µM
49
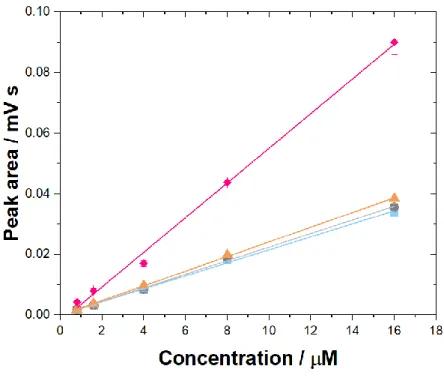
Figure 3.3 Calibration curves for MET, PHEBI, PHEN and PROP obtained by HPLC. Mobile phase: Phosphate buffer, 50: ACN, 50: triethylamine, 0.2. Column: Zorbax TMS (250 x 4.6 mm). Flow rate: 1.3 mL min-1. Injection volume: 20 µL. Column temperature: 40 °C. Wavelength: 230 nm. Concentration of analytes: 0.8 -16 µM. MET (blue squares), PHEBI (grey circles), PHEN (orange triangles) and PROP (pink diamond)
50
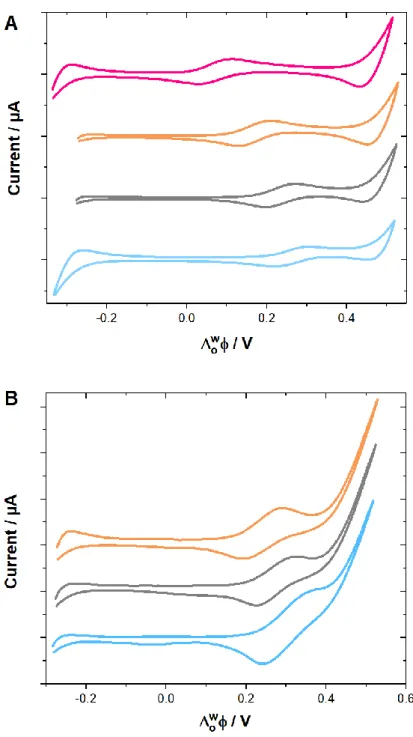
Figure 3.4 Cyclic voltammograms of 170 µM MET (blue curve), PHEBI (grey curve), PHEN (orange curve) and PROP (pink curve) transferring across the ITIES. Electrochemical cell 1, Scan rate= 5 mV s-1. a) pH 6 b) pH 2. Experimental conditions: Aqueous phase: 10 mM LiCl. pH of aqueous phase: 6. Organic phase: 10 mM of BTPPA+ TPBCl- in DCE. Scan rate: 5 mV s-1. Cell: Static ITIES cell
51
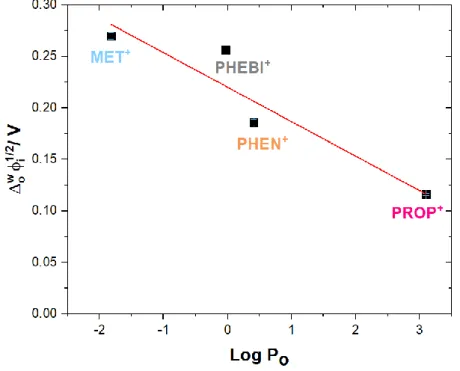
Figure 3.5 Graph of Galvanic transfer potential versus log Po for each
drug
53
Figure 3.6 Effect of scan rate of on MET transfer. Experimental conditions: Aqueous phase: 10 mM LiCl. pH of aqueous phase: 6. Organic phase: 10 mM of BTPPA+ TPBCl- in
DCE. Scan rate: 5 - 25 mV s-1. Cell: Static ITIES cell. [MET] :0.280 mM
54
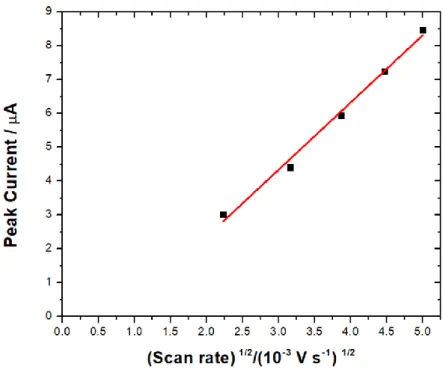
Figure 3.7 Peak current vs squares root of scan rate of MET. Experimental conditions: Aqueous phase: 10 mM LiCl. pH of aqueous phase: 6. Organic phase: 10 mM of BTPPA+
TPBCl- in DCE. Scan rate: 5 - 25 mV s-1. Cell: Static ITIES cell. [MET] :0.280 mM
xii
Figure 3.8 Effect of the concentration of MET. Experimental conditions: Aqueous phase: 10 mM LiCl. pH of aqueous phase: 6. Organic phase: 10 mM of BTPPA+ TPBCl- in
DCE. Scan rate: 5 mV s-1. Rotation speed: 100 rpm
56
Figure 3.9 A) Effect of the concentration of TEA+. Rotation speed= 100
and 200 rpm. B) Effect of the concentration of PROP. Rotation speed= 100 rpm. Experimental conditions: Aqueous phase: 10 mM LiCl. pH of aqueous phase: 6. Organic phase: 10 mM of BTPPA+ TPBCl- in NPOE. Scan
rate: 5 mV s-1
58
Figure 3.10 A) Effect of 0.029 mM TEA+ B) Effect of the rotation speed
(25-150 rpm). Experimental conditions: Aqueous phase: 10 mM LiCl. pH of aqueous phase: 6. Organic phase: 10 mM of BTPPA+ TPBCl- in DCE. Scan rate: 5 mV s-1
60
Figure 3.11 Schematic to illustrate the flow lines at interface 61 Figure 3.12 Calibration curve of 1/Ilim versus the inverse squares root of
the rotation speed at 0.55 V
62
Figure 3.13 Effect of the type of cells on the current density. A) 10 mM LiCl B) TEA in 10 mM LiCl. Experimental conditions: Aqueous phase: 10 mM LiCl. pH of aqueous phase: 6. Organic phase: 10 mM of BTPPA+ TPBCl- in DCE. Scan rate: 5 mV s-1
63
Figure 3.14 Chronoamperometry for different applied potential in the absence and in the presence of target analytes. Experimental conditions: Aqueous phase: 10 mM LiCl. Organic phase: 100 µL of 10 mM of BTPPA+ TPBCl- in DCE. [Target analytes]: 0.164 mM. Scan rate: 5 mV s-1. Extraction time:
900 s. Rotation speed: 150 rpm. Cell: Rotating paddle in ITIES cell
65
Figure 3.15 Chronoamperometry for potential driven extraction of analytes. Experimental conditions: Aqueous phase: 10 mM LiCl. Organic phase: 100 µL of 10 mM of BTPPA+ TPBCl
-in DCE. [Target analytes]: 0.164 mM. Scan rate: 5 mV s-1. Time extraction: 900 s. Rotation speed: 150 rpm. Cell: Rotating paddle in ITIES cell
xiii
Figure 3.16 Graph of charge versus potential extraction of analytes, A) individually MET (blue curve), PHEBI (grey curve), PROP (pink curve) and mixed-drug (green curve). B) mixed-drugs simultaneously. Experimental conditions: Aqueous phase: 10 mM LiCl. Organic phase: 100 µL of 10 mM of BTPPA+ TPBCl- in DCE. [Target analytes]: 0.164 mM. Scan rate: 5 mV s-1. Time extraction: 900 s. Rotation speed: 150 rpm.
Cell: Rotating paddle in ITIES cell
67
Figure 3.17 Comparison of faradaic and real extraction yield. Experimental conditions: Aqueous phase: 10 mM LiCl. Organic phase: 100µL of 10 mM of BTPPA+TPBCl- in DCE. [MET] = 0.164 mM. Time of extraction: 900 s. Potential applied: + 0.8 V. Rotation speed: 150 rpm. Cell: Rotating paddle in ITIES cell
69
Figure 3.18 Graph of moles extracted against back-extraction step. Experimental conditions: Aqueous phase: 100 µL of H2O. Organic phase: 100 µL of 10 mM of BTPPA+ TPBCl- in DCE. [MET]: 0.164 mM. Vortex time: 90 s. Centrifuge time: 3 mins. Cell: Rotating paddle in ITIES cell
70
Figure 3.19 Graph of moles detected by HPLC against waiting time after extraction. Experimental conditions: Aqueous phase: 10 mM LiCl. Organic phase: 10 mM of BTPPA+ TPBCl- in
DCE. [MET] = 0.164 mM. Time extraction: 900 s. Potential applied: +0.8 V. Rotation speed: 150 rpm. Cell: Rotating paddle in ITIES cell
71
Figure 4.1 Metathesis reaction of TMA+TPBCl- 73 Figure 4.2 Distribution of the monocationic form (AH+) of MET (blue
curve), PHEBI (gray curve) and PHEN (orange curve) as a function of pH
78
Figure 4.3 Ionic partition diagram for MET 78
Figure 4.4 Ionic partition diagram for PHEBI 79
Figure 4.5 Ionic partition diagram for PHEN 79
Figure 4.6 Ionic partition diagram for PROP 80
Figure 4.7 Experimental procedure of the electrochemically modulated liquid-liquid extraction. Target cations are extracted from
xiv
the aqueous sample to organic phase before being back-extracted to a final aqueous phase. The numbers 1, 2 and 3 correspond to the initial, intermediate and final stages at which the aqueous phases are analysed by HPLC
Figure 4.8 Chromatograms obtained for a sample containing MET, PHEBI and PHEN at (A) 164 µM each and at (B) 1.64 µM each before (1) and after (2) extraction, in the aqueous back-extraction phase (3). Extraction conditions were [TMA+]o =
10 mM, [TMA+]w = 0.001 mM, pH 11, VDCE = 2 mL,
Rotation speed= 900 rpm, text = 15 min
85
Figure 4.9 Extraction efficiency as a function of (A) time and (B) rotation speed. Other experimental parameters were: [TMA+]o = 10 mM, [TMA+]w = 0.001 mM, pH 11, VDCE = 2
mL
88
Figure 4.10 A) Dependence of
total as a function of the interfacial potential difference, ∆owф, for extraction conditions of
Figure 4.8. [Analyte] = 164 µM for the blue curve and 1.64 µM for the orange curve. B) Extraction efficiency as a function of initial concentration targeted analytes. Other experimental parameters were: [TMA+]
o = 10 mM,
[TMA+]w = 0.001 mM, pH 9, VDCE = 2 mL
90
Figure 4.11 Enrichment factors for 10 µM MET, PHEBI and PHEN achieved for control experiments 1-3 and the extraction method proposed here. Experimental conditions for control 1-3 are given in Figure 4.5. Experimental conditions for the extraction method are the optimal conditions
92
Figure 4.12 Extraction efficiency as a function of Galvanic transfer potential. Other experimental parameters were: [TMA+]o =
10 mM, [TMA+]
w = 0.001 mM, pH 11, VDCE = 0.3 mL
93
Figure 4.13 A) Enrichment factor as a function of Galvanic back-transfer potential. Other experimental parameters for back-extraction were: [TMA+]o = 10 mM, [TMA+]back = 50 mM,
pH 2, VDCE = 2 mL. B) Enrichment factor vs final volume of
aqueous phase
95
Figure 4.14 %Extraction as a function of the enrichment factor for MET, (blue triangles) PHEBI (grey circles) and PHEN (orange
xv
squares). The solid line represents the enrichment factor expected if back-extraction efficiency is 100 %
Figure 4.15 %Extraction yield of MET, (blue triangles) PHEBI (grey circles) and PHEN (orange squares) as a function of the interfacial potential difference at equilibrium ∆owф
Eq Ext
. These experimental points were obtained for a variety of parameters. Solid lines are the expected extraction yields for each of the drugs according to Nernst equation
98
Figure 4.16 %Extraction vs ∆owфEqExt for the extraction of propranolol.
%Extraction vs EF
99
Figure 4.17 Chromatograms MET, PHEBI and PHEN after sample enrichment using the optimised conditions (shown in Tables 4.3 and 4.4). Concentrations ranged from 16 nM to 1.6 µM
100
Figure 4.18 Chromatograms before (1) and after (2) extraction and after back-extraction (3). [TMA+]
o = 10 mM, [TMA+]w = 0.001
mM, pH 6, VDCE = 2 mL, rotation speed= 600 rpm, text = 15
min. The chromatograms were obtained for sample pre-treated by dilution 1:4 in DI water
101
Figure 5.1 Preparation of bar-µ-SPE. a) Preparation of PP bag b) Insertion of metal rod in PP bag c) heat-sealed of edges d) completed device
108
Figure 5.2 Protocol of extraction and desorption steps 110 Figure 5.3 Chromatogram for the separation of analytes. HPLC
conditions: mobile phase, 20 mM phosphate buffer (pH 6.2): ACN: trimethylamine (45:55:0.2, v/v) Column: Zorbax TMS (250 x 4.6 mm). Flow rate, 1.3 mL min-1: Injection
volume, 20 µL. Wavelength: 230 nm. Concentration of analytes: 1 mg L-1
114
Figure 5.4 Effect of type of adsorbents on extraction. Experimental conditions: Conditioning solvent: ACN, Vsolution: 20 mL,
pHsolution: 6, amount of adsorbent: 20 mg, time of extraction:
60 mins, rotation speed: 800 rpm
116
Figure 5.5 Effect of conditioning solvents on the extraction of drugs. Experimental conditions: Vsolution: 20 mL, pHsolution : 6,
xvi
amount of adsorbent: 20 mg, time of extraction: 60 mins, rotation speed: 800 rpm
Figure 5.6 Effect of pH solution on the extraction of drugs. Experimental conditions: Conditioning solvent: ACN, Vsolution: 20 mL, amount of adsorbent: 20 mg, time of
extraction: 60 mins, rotation speed: 800 rpm
120
Figure 5.7 Effect of amount of adsorbent on the extraction of drug. Experimental conditions: Conditioning solvent: ACN, Vsolution: 20 mL, pH solution: pH 10 (Graphene) and pH 3
(Zeolite), time of extraction: 60 mins, rotation speed: 800 rpm
122
Figure 5.8 Effect of volume of solution on the extraction of drugs. Experimental conditions: Conditioning solvent: ACN, pH
solution: pH 10 (Graphene) and pH 3 (Zeolite), amount of
adsorbent: 10 mg (Graphene) and 25 mg (Zeolite), time of extraction: 60 mins, rotation speed: 800 rpm
124
Figure 5.9 Effect of rotation speed on the extraction of drugs. Experimental conditions: Conditioning solvent: ACN, Vsolution: 10 mL, pHsolution: pH 10 (Graphene) and pH 3
(Zeolite), amount of adsorbent: 10 mg (Graphene) and 25 mg (Zeolite), time of extraction: 60 mins
126
Figure 5.10 Effect of time of extraction of drugs. Experimental conditions: Conditioning solvent: ACN, Vsolution: 10 mL,
pHsolution: pH 10 (Graphene) and pH 3 (Zeolite), amount of
adsorbent: 10 mg (Graphene) and 25 mg (Zeolite), rotating speed: 800 rpm
128
Figure 5.11 Effect of ionic strength, NaCl on the extraction of drugs. Experimental conditions: Conditioning solvent: ACN, Vsolution: 10 mL, pHsolution: pH 10 (Graphene) and pH 3
(Zeolite), amount of adsorbent: 10 mg (Graphene) and 25 mg (Zeolite), time of extraction: 90 mins (Graphene) and 120 mins (Zeolite), rotating speed: 800 rpm
130
Figure 5.12 Effect on desorption solvents. Experimental conditions; Vdesorption solvent: 0.6 mL, sonication time: 30 mins. MET
(vertical lines), BUF (horizontal lines), PHEN (cross), PROP (dots). Ion-pair reagent (IP): Sodium heptanesulphonate
xvii
Figure 5.13 Effect on time of desorption. Experimental conditions; Vdesorption solvent: 0.6 mL, Desorption solvents: 0.1 M IP in
IPA, 0.1 M IP in ACN, sonication time: 30 mins. Ion-pair reagent (IP): Sodium heptanesulphonate. MET (red squares), BUF (blue circles), PHEN (yellow triangles), PROP (green stars)
134
Figure 5.14 Effect on desorption solvents volume. Experimental conditions; Vdesorption solvent: 0.6 mL, desorption solvents: 0.1
M IP in IPA, 0.1 M IP in ACN, sonication time: 30 mins. Ion-pair reagent (IP): Sodium heptanesulphonate. MET (red squares), BUF (blue circles), PHEN (yellow triangles), PROP (green stars)
136
Figure 5.15 % extraction vs % zeolite:graphene ratio. Experimental conditions: Conditioning solvent: ACN, pHsolution: 6, time of
extraction: 120 mins, rotation speed: 800 rpm
140
Figure 5.16 Effect of pH on extraction of drugs. Experimental conditions: Conditioning solvent: ACN, Vsolution: 10 mL,
Zeolite: Graphene: 7:3, time of extraction: 120 mins, rotation speed: 800 rpm
141
Figure 5.17 Effect of desorption solvent on mixed-adsorbent. Experimental conditions: VDesorption solvent: 0.60 mL,
sonication time: 30 mins
142
Figure 5.18 Typical chromatogram of urine sample that were spiked with the drug (950 µg L-1) using the bar-µ-SPE-HPLC method
145
Figure 5.19 EE % for different type of adsorbents studied 146 Figure 5.20 EF for different types of adsorbents studied 146
xviii
LIST OF ABBREVIATIONS
µ-SPE Micro-solid phase extraction 1,2-DCE 1,2-dichloroethane
AµE Adsorptive micro extraction AAS Atomic absorption spectroscopy ACN Acetonitrile
BTPPA Bis(triphenylphosphoranylidene) ammonium BUF Buformin CE Capillary electrophoresis CE Counter electrode CTC Chlorotetracycline CV Cyclic voltammetry CNT Carbon nanotubes
D- µ-SPE Dispersive micro-solid phase extraction DI Direct immersion
DLLME Dispersive liquid-liquid micro-extraction EE Extraction efficiency
EF Enrichment factor
ELMME Electrochemically modulated liquid-liquid extraction GC Gas chromatography
GO Graphene oxide
HF-LPME Hollow -fibre liquid-phase micro-extraction HPLC High performance liquid chromatography
HS Headspace
xix
IP Ion-pair
IPA 2-Propranol
ITIES Interface between two electrolyte solution LiCl Lithium chloride
LLE Liquid-liquid extraction LPME Liquid phase micro extraction
LTL Linde Type L
LOD Limit of detection
Log P Logarithm of partition coefficient LOQ Limit of quantification
MeOH Methanol
MEPS Microextraction by packed sorbent MET Metformin
MOF Metal-organic frameworks MWCNT Multi-walled carbon nanotubes NPOE Nitrophenyl octyl ether
OTC Oxytetracycline
PAH Polyaromatic hydrocarbon PE Percentage of extraction PET Polyethyelene terephthalate PHEBI Phenyl biguanide
PHEN Phenformin
PP Polypropylene
PROP Propranolol
Pt Platinum
xx RDSE Rotating disk sorbent extraction SALLE Salting out liquid-liquid extraction SBSE Stir bar sorptive extraction
SCSE Stir-cake sorptive extraction SDME Single drop micro-extraction SLM Supporting liquid membrane SPE Solid phase extraction SPME Solid phase micro extraction SRSE Stir rod sorptive extraction TC Tetracycline TEA Tetraethylammonium THF Tetrahydrofuran TMA Tetramethylammonium TPA Tetrapropylammonium TPBCl Tetrakis(4-chlorophenylborate)
VALLME Vortex assisted liquid-liquid extraction β-blocker Beta-blocker
xxi LIST OF SYMBOLS ε Relative permittivity 𝑎𝑖 Activity of ion 𝑐𝑖 Concentration of ion Z Charge F Faraday’s constant R Gas constant T Temperature
Δ 𝜙𝑤𝑜 Standard transfer potential
∆𝑜𝑤𝜙 𝑖
xxii
KAEDAH PENGEKSTRAKAN CECAIR-CECAIR TERMODULASI ELEKROKIMIA DAN PENGEKSTRAKAN MIKRO FASA PEPEJAL BAGI
PENENTUAN SEBATIAN FARMASEUTIKAL TERPILIH
ABSTRAK
Kaedah penyediaan sampel konvensional bagi penentuan sebatian berkutub seperti pengekstrakan cecair-cecair (LLE) dan pengekstrakan fasa pepejal (SPE) secara umumnya diketahui tidak berkesan kerana melibatkan pelbagai langkah, pemulihan yang rendah dan penggunaan pelarut organik yang tinggi. Oleh yang demikian, tesis ini terkait dengan pembangunan kaedah penyediaan sampel baru, iaitu, pengekstrakan cecair-cecair termodulasi elektrokimia (EMLLE) dan pengekstrakan fasa pepejal mikro-batang (μ-SPE-batang) bagi penentuan sebatian farmaseutikal terpilih, iaitu metformin (MET), buformin (BUF), penformin (PHEN), dan propranolol (PROP) yang mempunyai lipofilisiti yang berbeza dalam sampel biologi. Dalam kaedah EMLLE, bantuan medan elektrik telah digunakan untuk mengestrak sebatian farmaseutikal di antara antara dua larutan elektrolit (ITIES). ITIES terbentuk apabila dua fasa pelarut pukal (litium klorida) dan fasa organik (I, 2-dikloroetana), kedua-duanya mengandungi elektrolit bersentuh bersama. Keupayaan pindahan untuk setiap analit dianalisa menggunakan voltammetri. Corak keupayaan pemindahan mengikuti lipofilisiti adalah; propranolol <penformin <phenil biguanida<metformin. Pengekstrakan analit telah dilakukan dengan menggunakan keupayaan yang tetap bagi sistem dua fasa menggunakan potentiostat selama 15 minit. Prestasi pengekstrakan adalah lemah. Penetapan sel ITIES yang lain dan penetapan keupayaan antara muka oleh kekutuban kimia boleh dilakukan bagi meningkatkan prestasi pengekstrakan
xxiii
menggunakan kaedah ini. Oleh yang demikian, teknik EMLLE adalah berdasarkan pada aplikasi keupayaan antara muka disebabkan kehadiran kepekatan ion tetramethylammonium (TMA+) yang berbeza seperti ion biasa dalam setiap fasa telah dikaji. Keadaan pengekstrakan optimum untuk kaedah ini adalah, [TMA+]o = 10 mM,
[TMA+]w = 0.001 mM, Vorg = 2 mL, pHsampel = 9, kelajuan pusingan = 900 rpm, masa
pengekstrakan = 600 s. Parameter yang dioptimumkan untuk pengekstrakan semula adalah: [TMA+]
kembali = 50 mM, Vakhir = 0.1 mL, pHkembali = 2. Hampir 100 %
pengekstrakan analit sasaran telah dicapai, dan faktor pemerkayaan diperolehi sehingga ~ 60 kali ganda bagi sebatian biguanida. Dalam kaedah μ-SPE-batang, (penjerap dan rod logam kecil diletakkan dalam beg membran polipropilena). Berdasarkan pelbagai penjerap, grafin dan zeolit menunjukkan kebolehupayaan. Oleh yang demikian, keadaan pengekstrakan untuk setiap penjerap dan campuran penjerap telah dioptimumkan. Walaupun pengoptimuman dilakukan, pengekstrakan diketahui adalah rendah (5.03-39.2 %). Walau bagaimanapun, faktor pemerkayaan sebanyak 1.49 -14.9 telah diperolehi. Kedua-dua kaedah yang dicadangkan telah diaplikasikan bagi penentuan analit dalam air kencing. Pada keseluruhannya, kaedah baru yang dicadangkan ini adalah mudah dan mengurangkan penggunaan pelarut organik dengan ketara.
xxiv
ELECTROCHEMICALLY MODULATED LIQUID-LIQUID EXTRACTION AND MICRO-SOLID PHASE EXTRACTION METHODS FOR
DETERMINATION OF SELECTED PHARMACEUTICAL COMPOUNDS
ABSTRACT
Conventional sample preparation methods for the determination of polar compounds such as liquid-liquid extraction (LLE) and solid phase extraction (SPE) are generally not effective because of their multiple steps, low recovery and high consumption of organic solvents. Thus, this thesis deals with the development of new sample preparation methods, i.e, electrochemically modulated liquid-liquid extraction (EMLLE) and bar-micro solid phase extraction (bar-µ-SPE) to determine selected pharmaceutical compounds, i.e., metformin (MET), buformin (BUF), phenformin (PHEN), and propranolol (PROP) having varied lipophilicity in biological samples. In the EMLLE method, the aid of electric field was utilized to extract the pharmaceutical compounds across the interface between two immiscible electrolyte solutions (ITIES). ITIES formed when two bulk solvents aqueous phase (lithium chloride) and organic phase (I,2-dichloroethane), both containing electrolytes are brought into contact. Transfer potential for each analyte was analysed by voltammetry. The trend of transfer potential followed their lipophilicity; propranolol < phenformin < phenyl biguanide < metformin. Extraction of the analytes was performed by applying fixed potential to the biphasic system using potentiostat for 15 mins. The extraction performance was poor. Design of another ITIES cell and imposing interfacial potential by chemical polarization was done to enhance the extraction performance of this method. Thus, the EMLLE technique based on application of interfacial potential due to the presence of
xxv
different concentrations of tetramethylammonium ion (TMA+) as common ion in each phase was studied. The optimum extraction conditions for this method are, [TMA+]
o
= 10 mM, [TMA+]w = 0.001 mM, Vorg = 2 mL, pHsample = 9, rotation speed = 900 rpm,
extraction time = 600 s. The optimised parameters for back-extraction are: [TMA+]back
= 50 mM, Vfinal = 0.1 mL, pHback = 2 . Nearly 100 % extraction of targeted analytes
was achieved, and the enrichment factor obtained was up to ~ 60 for biguanide compounds. In the bar-µ -SPE method, adsorbent and a tiny metal rod was placed in a polypropylene membrane bag. Among the various adsorbents studied, graphene and zeolite showed some potential. Thus, extraction conditions were optimised for each adsorbent and adsorbent mixture. Despite the optimisations, the extraction was low (5.03-39.2 %). Nevertheless, enrichment factors of 1.49 -14.9 were obtained. Both proposed methods were applied to the determination of the analytes in urine. On the whole, the newly proposed methods are simple and markedly reduced consumption of organic solvents.
xxvi
EXTRACTION LIQUIDE-LIQUIDE MODULEE
ÉLECTROCHIMIQUEMENT ET MICRO-EXTRACTION EN PHASE SOLIDE POUR LA DÉTERMINATION DE COMPOSÉS
PHARMACEUTIQUES
RÉSUMÉ
Les méthodes classiques de préparation d'échantillons pour la détermination de composés polaires, telles que l'extraction liquide-liquide (LLE) et l'extraction en phase solide (SPE), ne sont généralement pas efficaces en raison de multiples étapes, d’une faible récupération et d’une consommation élevée de solvants organiques. Cette thèse traite du développement de nouvelles méthodes de préparation d’échantillons, à savoir l’extraction par voie liquide-liquide modulée électrochimiquement (EMLLE) et l’extraction bar-micro en phase solide (bar-µ-SPE) afin de déterminer les composés pharmaceutiques metformine (MET), buformine (BUF), phénformine (PHEN) et propranolol (PROP). Dans la méthode EMLLE, un champ électrique a été appliqué pour extraire les composés pharmaceutiques ionisés à travers l’interface entre deux solutions électrolytiques non miscibles (ITIES). Des ITIES se forment lorsque deux solvants en vrac en phase aqueuse (chlorure de lithium) et en phase organique (I, 2-dichloroéthane), contenant l’électrolyte, sont mis en contact. Le potentiel de transfert pour chaque analyte a été analysé par voltamétrie. La potentiel de transfert varie avec leur lipophilie; propranolol <phenformine <phenyl biguanide <metformine. L'extraction des analytes a été réalisée en appliquant un potentiel fixe au système biphasique oà l’aide d’une potentiostat pendant 15 minutes a donné des résultats médiocres. Une autre cellule de mesure et un potentiel interfacial obtenu par
xxvii
polarisation chimique ont été mis en œuvre pour améliorer les performances d'extraction de cette méthode. Ainsi nous avons étudié la technique EMLLE basée sur l’application d’un potentiel interfacial due à la présence de différentes concentrations en ion tétraméthylammonium (TMA+) en tant qu’ion commun à chaque phase. Les conditions optimales d’extraction pour cette méthode sont les suivantes : [TMA+]
o =
10 mM, [TMA+]w = 0,001 mM, Vorg = 2 mL, pHéchantillon = 9, vitesse de rotation = 900
rpm, temps d’extraction = 600 s. Les paramètres optimisés pour la rétro-extraction sont les suivants : [TMA+]retour = 50 mM, Vfinal = 0,1 mL, pHretour = 2. Les analytes ciblés
ont été extraits à près de 100% et le facteur d'enrichissement obtenu jusqu'à environ 60 fois pour les biguanides. Dans le procédé bar-µ -SPE, (un adsorbant et une tige métallique ont été placés dans un sac à membrane en polypropylène). Parmi divers adsorbants étudiés, le graphène et une zéolite se sont révélés interessants. Ainsi, les conditions d'extraction ont été optimisées pour ces deux adsorbants seuls et en mélange. Malgré les optimisations, l'extraction bas (5,03-39,2 %). Néanmoins, des facteurs d'enrichissement de 1,49 à 14,9 ont été obtenus. Les deux méthodes proposées ont été appliquées à la détermination des analytes dans l'urine. Dans l’ensemble, les méthodes nouvellement proposées sont simples et réduisent considérablement la consommation de solvants organiques.
1
CHAPTER 1
INTRODUCTION
Five steps are normally involved in an analytical procedure, which are; (i) sampling, (ii) sample preparation, (iii) separation, (iv) detection, and (v) data analysis. Although all these steps are connected to each other, it has been estimated that over 80 % of the analysis time is spent on sampling and sample preparation steps (Namera and Saito, 2013). If one of these steps is not performed properly, it would lead to error and inconsistent results (Pavlovic et al, 2007). Therefore, it is important to choose an appropriate sample preparation method for samples such as pharmaceutical drugs in biological fluids as it will influence the reliability and accuracy of analysis.
1.1 Sample preparation
Samples from biological fluids such as urine and plasma contain complex matrix components, which are the main source of interference during analysis. These matrix components when analysed using high performance liquid chromatography (HPLC) could lead to loss of column efficiency and an increase in back-pressure due to system blockage caused by biological particles (Novakova and Vlckova, 2009). In addition to removing any interferences, the aim of sample preparation is also to preconcentrate analytes in a cleaner solution (Yamini et al, 2019). The preconcentration process happens when a sample is extracted from a large volume of sample solution into microliter volume of extracting solvent (Yamini et al, 2019). Characteristics of good sample preparation are simple, reproducible, not time-consuming, low solvent consumption, involve minimum steps and easy to automate (Abdel-Rahim et al, 2001). Various sample preparation methods have been introduced for analysis of drugs in
2
biological fluids such as protein precipitation, ultrafiltration, liquid-liquid extraction (LLE) and solid phase extraction (SPE).
The procedure for protein precipitation is, an internal standard is added with analytes to reduce/minimize the error of extraction and suitable organic solvent or precipitating agents is used to aid the precipitation of proteins. Common organic solvents used for protein precipitation are acetone, acetonitrile, and acetic anhydride. The supernatant produced is reconstituted with mobile phase before injecting into a chromatographic instrument to avoid poor peaks (Ali et al., 2015). Even though protein precipitation is a simple method, unfortunately, it is ineffective to remove all endogenous substances as well as co-precipitation is possibly formed. This method lacks sensitivity and is time consuming due to the sample dilution and evaporation if needed (Mullet, 2007; Gabr
et al., 2010). Meanwhile, the most common extraction method used to isolate target
analytes that is based on the phase transfer of analytes species from one liquid to another liquid phase is known as LLE or from liquid to solid phase and it is known as SPE.
1.1.1 Liquid-liquid extraction (LLE)
LLE is a classical method widely used in a variety of industries: chemical, pharmacy, food industry, oil refining, in nuclear industry as well as hydrometallurgical processes (Warade et al., 2011). LLE leads to the mass transfer of a dissolved analyte from its solvent to another solvent (Zhang et al., 2019). One phase is usually an aqueous phase and the second one is an organic solvent. There are some of the organic phase that is denser than the aqueous phase such as dichloroethane. Both solvents must be immiscible or partially immiscible with each other and will form two layers. (Dean, 2009). The relative solubility of analytes in two phases is the key to the separation.
3
Lipophilicity refers to the ability of a compound to dissolve in oil, lipids, or non-polar solvents such as 1-octanol or hexane. The lipophilicity can be defined as log P0 value
or known as a partition coefficient of un-ionized compounds between water and octanol (Vraka et al., 2017; Hill et al., 2010). LLE method is popular due to its simplicity. By choosing a suitable solvent, it can isolate targeted drugs from their endogenous components. The major drawbacks of LLE are consumption of a large volume of solvents, emulsion formation that leads to loss of analyte and low recovery, and time-consuming. In addition, LLE is not suitable with all drugs especially with polar drugs (Mcdowall et al., 1986).
1.1.2 Solid phase extraction (SPE)
SPE is a frequently used extraction technique for liquid samples. Unlike LLE, SPE use solid material or known as sorbent to isolate analyte of interest. The principle of SPE is based on the partition of analytes between liquid and adsorbent. The basic protocols of SPE consist of four steps; (i) conditioning of adsorbents, (ii) loading of sample, (iii) washing away undesired components, and (iv) elution of analytes (Andrade-Eiora et
al., 2016).
The SPE technique overcomes the drawbacks of LLE by using lower volumes of solvents, then generating less waste. It also produces cleaner extract. (Vasconcelos and Fernandes, 2017). Adsorbents in SPE can be prepared in several formats such as cartridge, disk, 96-well SPE plates and pipette tips (Zwer-Ferenc and Biziuk, 2006). During the extraction process, the analytes are adsorbed onto the sorbent in cartridge which can prevent any loss or change in analytes concentration, resulting in high recovery. The main benefit of SPE is that it can extract non-polar to very polar analytes (Andrade-Eiora et al., 2016). However, there are some disadvantages of SPE. The
4
extraction involves multiple steps (i.e., conditioning, washing, loading, elution and evaporation) and it is time consuming. In SPE, it is important to choose appropriate adsorbent to obtain excellent retention and elution of analytes.
1.2 Solid phase microextraction
Microextraction is a technique that uses small volumes (µL range) or amount of extraction medium (less than 100 mg), either liquid or solid. (Pawliszyn & Pedersen-Bjergaard, 2006). There are two categories in microextraction techniques which are, solvent microextraction and sorbent microextraction. Generally, solvent microextraction is known as liquid phase microextraction (LPME) and sorbent micro-extraction as solid phase micro micro-extraction (SPME).
The SPME was introduced in 1990. The technique is based on the diffusion of analytes from sample to the adsorbent materials. In the first experiment, adsorption of analytes onto a solid coated optical fibre was used (Pawliszyn and Arthur, 1990). The first commercial SPME device was introduced in 1993 by Supelco (Pawliszyn, 2009). This method rapidly gained popularity with increasing number of publications. Even though at first, the technique was introduced in the environmental field for relatively volatile sample analysis, the applications are extended to non-volatile compounds. There are two steps in the SPME protocol. First is the partition of target analytes between the sample matrix to the coating. In the second step, the concentrated analytes are desorbed into the analytical instrument such as GC or HPLC. Table 1.1 shows the comparison between SPME and conventional extraction methods (LLE and SPE).
5
Table 1.1: Steps involved in LLE, SPE and SPME as sample preparation method (Alpendurada, 2000)
Method General procedure
LLE - Addition of organic solvents - Agitation of solution
- Separation of aqueous and organic phases - Evaporation of organic phase - Injection into analytical instrument SPE - Conditioning of cartridges/disk/column
- Washing and loading sample - Elution of analytes using suitable solvent
- Evaporation of organic phase - Injection into analytical instrument
SPME - Extraction onto adsorbent
- Desorption of analyte
SPME has now become one of the commonly-used techniques in sample preparation. The benefits of SPME method are the reduction in extracting phases used, the analysis time is short, and it is also simple to carry out. In addition, it improves selectivity of extraction, facilitating automation, low-cost because of the low amount of solvent used, and can be coupled to most of analytical instruments such as GC, HPLC, AAS, CE, to name a few. Another advantage of the technique is that derivatizations can be carried out on the fibres.
Extraction can be performed either in the direct immersion (DI) or headspace (HS) modes. Unfortunately, both modes have their own limitations. Fibre is directly exposed to sample matrix in DI mode. Binding of interference substances from complex matrices such as food, sludge and biological samples onto the fibre has been encountered. HS-SPME is best applicable to volatile substances only. Due to these limitations, the hollow cellulose membrane protected SPME fiber was developed in 1996 and it can be immersed directly into complex samples. This was followed in 2004, by the use of polypropylene hollow fibre membrane protected SPME to analyse
6
triazines in milk and sludge samples (Pawliszyn and Zhang, 1993; Basheer and Lee, 2004). Several variations of the SPME technique have been developed such as microextraction in packed syringe (MEPS), stir bar sorptive extraction (SBSE), stir-cake sorptive extraction (SCSE), to name a few. Table 1.2 illustrates these related techniques. It also summarizes the benefits and drawbacks of each method.
7 Table 1.2: Techniques that are related to SPME method
Techniques Description Main features References
Microextraction by packed sorbent (MEPS)
Sorbent is inserted into the barrel of syringe or between the syringe barrel. The injection needle is defined as a cartridge.
Advantages
- Automation
- Extraction of wide range of analytes
- Less time consuming Disadvantages
- Irrepeatability
Nováková and Vlčková, 2009
Stir bar sorptive extraction (SBSE)
PDMS as a polymeric phase is coated on magnetic stir bar. It promotes hydrophobic interaction with analytes. The analytes are desorbed using suitable organic solvents. The configuration is shown in Figure 1.1.
Advantages
- Eliminates use of solvents
- Reduces labour sample preparation
- Less time consuming Disadvantage
- Limited analytes as most of the coating is nonpolar
- High matrix effects
Nogueira, 2015
Stir-cake sorptive extraction (SCSE)
Microporous materials (monolith) is placed inside a special holder. In the lower part of the cake holder, a mixture made from iron is coated with a glass protection layer (Figure 1.1).
Advantages
- The sorbent does not touch the bottom of the vessel
- High recovery - Low detection limit - Easy to use
Disadvantage
- Possibility of high matrix effect
Spietelun et al., 2013
8 Table 1.2: Continued
Rotating disk sorbent extraction (RDSE)
PDMS as a stationary phase is deposited by sol-gel method on the Teflon disk. The bottom part is placed in a magnetic stirrer (Figure 1.1)
Advantages
- Improved enrichment factor due to strong stirring
- Better recovery compared to SBSE Disadvantage
- Possibility of high matrix effect
Spietelun et al., 2013
Stir rod sorptive extraction (SRSE)
Improved format of SBSE, RDSE and SCSE. It set up includes a metal rod, at one edge having magnet and the monolith polymer coating and shown in Figure 1.1.
Advantages
- Good extraction capacity - Easy to prepare and use
- Device can be used for a long time Disadvantages
- Strong matrix effects - More research necessary
Plotka-Wasylka et
al., 2015
Micro-solid phase extraction (µ-SPE)
Small amount (5-20 mg) of adsorbent is placed inside a small bag made up from porous membrane. The porous membrane bag is closed by heat-sealing the edges. It is as illustrated in Figure 1.1.
The bag is conditioned before immersed in sample solution for extraction. Desorption of analytes was done by aid of ultrasonication with suitable µL of organic solvent.
Advantages
- Protected from dirty matrixes - Cheap
- EF is higher than SPME - The device is reusable - Flexible choice or sorbents Disadvantages
- Long extraction time
- High precision value (% RSD) - Possible to carry over analytes
when re-use the bag
Basheer et al.,
9 Table 1.2: Continued
Adsorptive µ-extraction (AµE)
Two geometrical configurations:
i) Bar-adsorptive micro-extraction (BAµE)
ii) Multi-spheres adsorptive micro-extraction (MSAµE)
Generally, the sorbent is embedded physically on the substrate and placed in the sample solution. The solution is stirred using stir-bar or vortexed.
Advantages
- For polar analytes - It is easy to prepare - Cheap
- Selective as sorbent can be chosen depending on analyte of interest Disadvantages
- Device’s stability should be assessed in a case-by-case basis
Neng et al., 2010, Nogueira, 2012
Dispersive µ-SPE (D- µ-SPE)
An adsorbent is dispersed in the sample solution for extraction process by ultrasound-assisted or vortex-ultrasound-assisted. After the extraction, the adsorbent is recovered by centrifugation or filtration and external magnet (for magnetic adsorbent).
Advantages - Simple
- Increase extraction efficiency - Easy on-site reaction
Disadvantages
- Not feasible for automation
Chisvert et al., 2019 Khezeli and Daneshfar, 2017
10
Figure 1.1: Configuration of adsorbent in RDSE, SRSE, SCSE, AµE and µSPE method (Gilart et al., 2014; Sajid, 2017)
11
1.2.1 Adsorbents
Variety types of solid materials are used as adsorbents in SPE as well as µ-SPE. A good adsorbent is the one that can selectively extract the analyte of interest and able to achieve high enrichment factor. Several adsorbents are available such as the conventional adsorbent, ion imprinted materials, magnetic materials, core shell material, mesoporous materials, carbon nanotubes, graphene, TiO2 nanotubes and
arrays, bio sorbents, zeolite and metal organic framework.
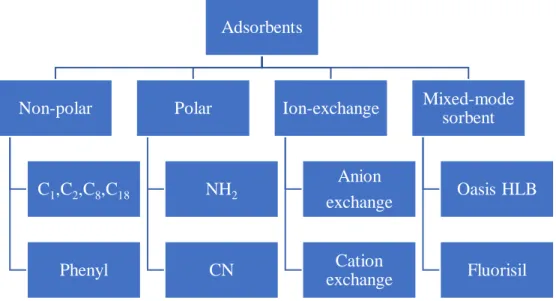
Conventional commercialised adsorbents (Figure 1.2) can be categorised as normal phase, reverse phase, ion-exchange and polymer mixed-mode adsorbents (Krishann and Ibraham, 1994) (Figure 1.2). Of these, C18 is the most popular. Extraction of the polar estrogen in ovarian cyst fluid samples was done by the slightly more polar C2 because it shows more affinity towards C2 compared to C8, C18 or activated carbon,
Haye-Sep A and Haye-Sep B (Kanimozhi et al., 2011). Meanwhile, C18 was employed
to extract carbamazepine in surface water. C18 was chosen because it has low polarity
and carbamazepine is fairly hydrophobic (Teo et al., 2016).
Figure 1.2: Summary on types of commercial adsorbents
Adsorbents Non-polar C1,C2,C8,C18 Phenyl Polar NH2 CN Ion-exchange Anion exchange Cation exchange Mixed-mode sorbent Oasis HLB Fluorisil
12
Carbon nanotubes (CNT) is a rolled graphene sheet, and it was discovered in 1991 and became popular because of its high surface area, stability and mechanical strength (Iijima, 1991). CNTs can be classified as single-walled CNTs (SWCNTs) (one sheet) and multi-walled CNTs (MWCNTs) (more than one sheet). MWCNTs were used for determination of 16 polyaromatic hydrocarbons (PAHs) in environmental water sample. It is effective compared to C2, C18, graphite fiber and granular carbon owing
to the π-π electrostatic interaction with aromatic rings of PAHs (Guo and Lee, 2011). The oxidised MWCNTs also exhibit high removal efficiency of metals such as manganese (96.8 %) from water (Ganesan et al., 2013).
Recently, graphene has command considerable interest in sample preparation. The merits of graphene are the ultra-high surface area, double-sided surface area, chemical stability and excellent thermal stability. Graphene as an adsorbent in SPE for organochloride pesticide in water was reported (Han et al.,2013). Graphene also was used to extract polar estrogen in water (Naing et al., 2016). The product of graphite oxidation produces graphene oxide (GO). GO has more hdyroxyl and carboxy groups compared to graphene, thus Co(II) ad Ni(II) was pre-concentrated up to factor 250 by GO column in the SPE mode (Poujavid et al., 2015). Simple SPME-GC-MS was developed to determine 16 PAHs in mainstream cigarette smoke (Wang et al., 2015).
Metal-organic frameworks (MOFs) were increasingly used in SPE thanks to their unique properties such as the extremely high surface area, easy modification of surfaces and tunable pore size. MOFs consist of inorganic metal centres and organic linkers by coordinated bonds (Xiao et al., 2016). The MOFs were used to remove the harmful dyes, methyl orange and methyl blue from contaminated water. The MOFs
13
used were based on iron terephthalate which is able to adsorb better than activated carbon (Haque et al., 2011).
Zeolite is known as a group of open-framework aluminosilicates materials having well-defined microporous channels. The frameworks are constructed from tetrahedral consisting cations (Si/Al and oxygen atoms at the centre and corners, respectively). Due to the presence of Al, zeolites exhibit a negatively charged framework which is compensated by exchangeable cations that generate a system of pores and cavities of molecular dimensions (Li et al., 2017). Zeolites as adsorbents have been broadly used in separation and environmental remediation. Invention of the first synthetic zeolite Linde Type L (LTL) was done in the 1960s (Gaona-Gomez., 2012). Zeolite LTL is a one-dimensional 12 membered-ring channel system. Zeolite LTL which have different sizes and shapes were investigated to extract the mycotoxin orchatoxin A (OTA) in coffee and cereal. The highest extraction efficiency was obtained by cylinder shaped LTL (Lee et al., 2012). Meanwhile, online- SPE method using zeolite imidazole framework-8 (ZIF-8) was used to determine oxytetracycline (OTC), tetracycline (TC) and chlorotetracycline (CTC) in water and milk samples (Yang et al., 2013).
1.3 Liquid phase micro-extraction (LPME)
Liquid phase micro-extraction LPME techniques use minute amounts (µL) of extracting solvent (water-immiscible). Several types of LPME techniques have been proposed such as single drop micro-extraction (SDME), hollow -fiber liquid-phase micro-extraction (HF-LPME), dispersive liquid-liquid micro-extraction (DLLME).
14
The SDME technique is based on a single drop of organic solvent hanging on the tip of micro-syringe needle into liquid sample either by direct immersion or head space mode. After the extraction, the drop is directly injected into analytical instruments (normally GC). Some disadvantages of SDME are low precision, reduction of extraction efficiency due to limited drop volume and low sensitivity, and mechanical stability of the drop is poor as it is easily dislodged (Farajzadeh et al. 2014; Kokosa, 2015; Pano-Farias et al., 2017). Figure 1.3 illustrated SDME method.
Figure 1.3: Illustration of SDME methods (Tang et al., 2018)
The HF-LPME method uses a hollow porous fibre (normally polypropylene) to trap the extraction solvent immersed in an aqueous solution (Figure 1.4). To extract analyte of interest, the empty U shape hollow fibre is immersed in an organic phase to fill the pores of the membrane and then, extraction solvent is introduced using micro-syringe into hollow fiber lumen. In the two phases HF-LPME, organic solvent is used to fill
15
the pores of the wall of the HF. Meanwhile, the three phases LPME can be described as an aqueous- organic – aqueous system (Esrafili et al., 2018). The two phases HF-LPME method was developed for the determination of bisphenol A and metabolites of plasticizers (Fernandez et al., 2017). Investigation on pharmacokinetics of echinacoside in Parkinson disease rat plasma also was reported where 1-octanol was chosen as the acceptor phase (Zhao et al., 2013). Determination of anti-diabetic drugs in plasma and urine were done and good enrichment factor was obtained (Ben-Hander
et al., 2013; Ben-Hander et al., 2015). This method has several advantages; high
enrichment factor, cost-effectiveness, and high clean-up power. However, the disadvantages of this method are the need of expert personnel, long extraction time (up to 90 mins) and low precision (Carasek and Merib, 2015).
Figure 1.4: Illustration of two- and three-phases of HF-LPME method (Vičkačkaitė and Padarauskas, 2012)
16
For DLLME, a ternary solvent system, consists of sample solution (acceptor phase), disperser solvent and extraction solvent (donor phase). The dispersive solvent and acceptor phase mixture are rapidly injected into the sample solution that results in hydrophobic analytes enrichment in acceptor phase by aid of vortexing, shaking or sonication followed by centrifugation (Figure 1.5) (Jain and Singh, 2016). Application of this technique towards the determination of carvedilol was done and the enrichment factor obtained was 51 – 418 (Makaleh et al., 2015). Ionic liquid-DLLME coupled with µ-SPE technique was developed by Ge and Lee to extract antidepressant drugs from environmental samples. The proposed method has LOD of 1 µg L-1 (Ge and Lee,
2013).
Figure 1.5: Illustration of DLLME method (Vičkačkaitė and Padarauskas, 2012)
17
Automated LPME was introduced to overcome risk of analyte loss during sample preparation. An automated instrument based on HF-LPME coupled with HPLC consists of an automated syringe pump, a platform lift, and a sampling loop along with an electronic board with an AVR microcontroller, was designed by Esrafili that resulted in ease of operation (Esrafili et al., 2012).
More studies are performed to improve the efficiency, save time and overcome the downsides of the LPME technique. One of them is by applying auxiliary energy such as voltage to speed up the migration of analytes during the extraction
1.3.1 Electrified interface between two immiscible electrolyte solutions
Liquid-liquid interface is formed by two immiscible solvents. When two bulk solvents are brought together, each containing an electrolyte, and that have low mutual miscibility, the interface that is formed between them is known as Interface between Two Immiscible Electrolyte Solution or ITIES.
Normally, the ITIES is made up of an aqueous solvent and an organic solvent. Common solvents used for the organic phase are nitrobenzene or dichloroethane. Lastly, to ensure the electrolyte and analyte is fully dissociated, the solvents should have high relative permittivity. Table 1.3 summarizes the permittivity value for common solvents. Lithium chloride is commonly used as an electrolyte in aqueous phase. Whereas, for organic phase, tetrabutylammonium tetraphenylborate (TBA+TPB-) in nitrobenzene or bis(triphenylphosphoranylidene) tetrakis(4-chlorophenyl) borate (BTPPA+TPBCl-) in dichloromethane were prepared (Vanysek, 1993).
18
Table 1.3: Relative permittivity, 𝜀 of solvents at 25°C Solvents Relative permittivity,
𝜀 Water 78.58a Nitrobenzene 34.82a o-Nitrophenyl octyl ether 24.2b 1,2 -dichloroethane 10.36a Trifluorotoluene 9.2c *a (Vanysek, 1993) *b (Samec, 2004) *c (Olaya et al., 2012)
According to early studies in 1970s, polarizability of ITIES behaves in a similar way as an electrode-solution interface (Koryta et al. 1977, Gavach et al., 1968). Therefore, ion-transfer across ITIES can be studied by adopting the same electrochemical measurement (cyclic measurement, chronoamperometry, ac impedance spectroscopy) used for solid/liquid interface to ITIES.
1.3.2 Pseudo Nernst equation on ITIES
The general theory on charge transfer across ITIES can be explained based on thermodynamic equilibrium for ionic species. At equilibrium, the electrochemical potential of ions in each phase is as shown in Eq.1.1,
𝜇̃𝑖𝑤= 𝜇̃𝑖𝑜 (1.1)
and electrochemical potential involves a chemical and electrical term,
𝜇̃𝑖𝑤 = 𝜇𝑖𝑤 + 𝑧𝑖F𝜙𝑤 (1.2)
𝜇̃𝑖𝑜 = 𝜇
19
Chemical potential can be described as Eqs. 1.4 and 1.5,
𝜇𝑖𝑤 = 𝜇𝑖0,𝑤 + 𝑅𝑇 ln 𝑎𝑖𝑤 (1.4) 𝜇𝑖𝑜 = 𝜇 𝑖 0,𝑜 + 𝑅𝑇 ln 𝑎 𝑖 𝑜 (1.5)
Where 𝜇𝑖0,𝑜 is the standard chemical potential, R is universal gas constant, T is absolute temperature, z is the charge of the ion and F is the Faraday’s constant and 𝑎𝑖 is activity of ion in both phases.
When, the electrochemical potential is equal at equilibrium, the substitution of Eqs 1.2-1.5 into Eq 1.1, produces Eq 1.6,
𝜇𝑖0,𝑜 + 𝑅𝑇 ln 𝑎𝑖𝑜 + 𝑧𝑖F𝜙𝑜 = 𝜇 𝑖 0,𝑤
+ 𝑅𝑇 ln 𝑎𝑖𝑤 + 𝑧𝑖F𝜙𝑤 (1.6)
The standard Gibbs energy of a species from water to dichloroethane is equal to the difference between standard Gibbs energy of solvation (organic),𝜇𝑖0,𝑜 and the standard Gibbs energy of hydration (water), 𝜇𝑖0,𝑤 as shown in Eq 1.7,
Δ𝐺𝑡0,𝑤→𝑜= 𝜇𝑖0,𝑜- 𝜇𝑖0,𝑤 (1.7)
By rearranging Eqs. 1.6 and 1.7, the Galvanic potential difference between the two phases can obtained, Δ 𝜙𝑤𝑜 ,
Δ 𝜙𝑤𝑜 = Δ𝐺𝑡0,𝑤→𝑜 𝑧𝑖𝐹 + 𝑅𝑇 𝑧𝑖 ln ( 𝑎𝑖𝑜 𝑎𝑖𝑤) (1.8)
Where Δ 𝜙𝑤𝑜 = (𝜙𝑤 − 𝜙𝑜), thus by rewriting Eq. 1.8,
Δ 𝜙𝑤𝑜 =∆ 𝑜 𝑤 𝜙 𝑖𝑜 + 𝑅𝑇 𝑧𝑖𝐹 ln ( 𝑎𝑖𝑜 𝑎𝑖𝑤) = ∆𝑜 𝑤𝜙 𝑖 𝑜′ + 𝑅𝑇 𝑧𝑖𝐹 ln ( 𝑐𝑖𝑜 𝑐𝑖𝑤) (1.9)
20
Where 𝑐𝑖 is the concentration of ion in both phases, Δ 𝜙𝑖𝑜 𝑜
𝑤 is the standard transfer
potential and ∆𝑜𝑤𝜙 𝑖𝑜
′
is the formal transfer potential. The relationship in Eq. 1.9 is known as Nernst equation at liquid-liquid interface or called as Pseudo Nernst equation as its resemblance to classical Nernst equation for redox reaction at an electrode (Vallejo et al., 2012).
1.3.3 Polarizable and non-polarizable liquid-liquid interfaces
The liquid-liquid interface is non-polarizable when common ion is dissolved in both the aqueous and organic phases. The partition of the salts between adjacent phases results in an interface polarization at a fixed potential. The fixed potential is determined by the standard transfer potential of different ionic species. Polarizable ITIES occurs when LiCl (hydrophilic salt) is dissolved in water and BTPPA+TPBCl-
(hydrophobic salt) is dissolved in 1,2- DCE. When the concentration of LiCl is negligible in 1,2-DCE compared to BTPPA+TPBCl- and vice versa, the interface is
polarizable. In this case, by using an external potential source (potentiostat), the interface of ITIES can be polarized without modifying the chemical composition of the adjacent phases. A potential window arises during interface polarization process depending on the capability of the ions to transfer based on their applied Galvanic potential difference (Peljo and Girault, 2012).
The important things to mention regarding Nersnt equation relationship with the polarizability of ITIES are; 1) Δ𝑤𝑜𝜙 will change if the concentration of salts in one phase is changed and 2) when Δ 𝜙𝑤𝑜 is applied using potentiostat, the distribution