HAL Id: tel-00785987
https://tel.archives-ouvertes.fr/tel-00785987
Submitted on 7 Feb 2013HAL is a multi-disciplinary open access
archive for the deposit and dissemination of sci-entific research documents, whether they are pub-lished or not. The documents may come from teaching and research institutions in France or abroad, or from public or private research centers.
L’archive ouverte pluridisciplinaire HAL, est destinée au dépôt et à la diffusion de documents scientifiques de niveau recherche, publiés ou non, émanant des établissements d’enseignement et de recherche français ou étrangers, des laboratoires publics ou privés.
Multidimensional characterization of quality of
experience of stereoscopic 3D TV
Wei Chen
To cite this version:
Wei Chen. Multidimensional characterization of quality of experience of stereoscopic 3D TV. Auto-matic Control Engineering. Université de Nantes Angers Le Mans, 2012. English. �tel-00785987�
Mémoire présenté en vue de l’obtention
du grade de Docteur de l’Université de Nantes
Sous le label de l’Université Nantes Angers Le Mans
Discipline : Informatique
Spécialité :Automatique et Informatique Appliquée
Laboratoire : IRCCyN
Soutenue le 23 octobre 2012
École doctorale : 503 (STIM) Thèse n° : ED503-179
Caractérisation multidimensionnelle de la
qualité d'expérience en télévision de la TV3D
stéréoscopique
JURY
Rapporteurs :
Lina Karam, Professeur, Arizona State University
Christophe Charrier, Maître de Conférences HDR, GREYC, Université de Caen Basse Normandie Examinateurs :
Marcus Barkowsky, Maître de Conférences, IRCCyN, Université de Nantes Luce Morin, Professeur des Universités, IETR, INSA de Rennes
Touradj Ebrahimi, Professeur, Ecole Polytechnique Fédérale de Lausanne
Invité : Jérôme Fournier, ingénieur expert, lab’Orange, France Télécom
Directeur de Thèse : Patrick le Callet, Professeur des Universités, IRCCyN, Université de Nantes
Multidimensional characterization of quality
of experience of stereoscopic 3D TV
Wei CHEN
Multidimensional characterization of quality of experience of stereoscopic 3D TV
Caractérisation multidimensionnelle de la qualité d'expérience de la TV3D stéréoscopique
Résumé
La TV 3D stéréoscopique (S-3DTV) est supposée améliorer la sensation de profondeur des observateurs mais possiblement en affectant d’autres facteurs de l’expérience utilisateur. L’évaluation subjective (avec observateurs) est la méthode la plus directe pour qualifier la qualité d’expérience (QoE). Cependant, les méthodes conventionnelles ne sont pas adaptées à l’évaluation de la QoE dans le cas de la S-3DTV. Cette thèse a pour but de, premièrement proposer de nouvelles méthodologies pour évaluer la QoE dans pareil contexte ; deuxièmement investiguer les impacts de choix technologiques de la diffusion S-3DTV sur la QoE ; troisièmement proposer des recommandations pour optimiser la QoE. Sur les aspects méthodologiques, l’idée clé repose sur une approche multidimensionnelle de la QoE via la définition de plusieurs indicateurs. La fatigue visuelle fait l’objet d’une étude expérimentale particulière en utilisant des questionnaires, tests de vision et analyse de signaux EEG dans des conditions de visualisation optimisés. D’autres indicateurs ont été mesurés pour investiguer quantitativement l’impact de l’acquisition, la représentation, la compression et la transmission du contenu S-3DTV sur la QoE. De plus, les règles améliorées de captation stéréoscopiques, de budget de profondeur «confortable», de débit de diffusion ont été élaborées et validées au travers des études expérimentales.
Mots clés
TV 3D, qualité d’expérience, fatigue visuelle, confort visuel, qualité d’image, perception visuelle humaine, diffusion 3D
Abstract:
Stereoscopic-3DTV (S-3DTV) should provide enhanced depth perception to viewer while it might affect other factors of user experience. Subjective assessment is the most direct way to assess quality of experience (QoE). However, conventional assessment methods are not sufficient to evaluate the QoE of S-3DTV. This thesis aims first to propose new methodologies to evaluate S-3DTV QoE; second, investigate different technical issues related to QoE along the 3DTV broadcasting chain; third, propose recommendations to optimize the S-3DTV QoE. For methodological aspects, the key idea relies on using multidimensional QoE indicators. Visual fatigue, as a particular dimension of QoE, is addressed separately under optimized viewing conditions using questionnaire, vision test and EEG signals. For other QoE indicators, we design subjective QoE experiments to investigate the impact of content acquisition, 3D representation format, compression and transmission on QoE of S-3DTV. The experiment results quantitatively reveal how perceived binocular depth, compression distortion, the cooperation between 3D representation formats and line interleaved display, and view asymmetries affect multidimensional QoE of S-3DTV. Additionally, we elaborate and validate improved stereoscopic shooting rules, depth budget for visual comfort, appropriate frame compatible format for line interleaved display, bitrate to broadcast S-3DTV, threshold for view asymmetries to avoid visual discomfort.
Key words
3DTV, quality of experience, visual fatigue, visual comfort, image quality, human visual perception, 3D broadcasting
Acknowledgements
The work presented in this thesis could not have been possible
without the support of mange people.
Many thanks to my supervisors: Patrick Le Callet, Marcus
Barkowsky and Jérôme Fournier for their timely advice,
consultations, encouragement, and critiques throughout the
development of this work. Jérôme has been an invaluable source
of support and guidance all along my work on the thesis.
I am very grateful to France telecom colleagues: Bernard
Letertre and Jean-Chareles Gicquel, for their discussion and help
in designing and guiding subjective quality assessment
experiments.
Last but not least, I would like to thank my family: my wife and
my parents. They have always been a source of motivation.
Without them, I could have never accomplished what I have
done today.
Abstract
Abstract
Stereoscopic-3DTV (S-3DTV) should provide enhanced depth perception to viewer while it might affect other factors of user experience. Subjective assessment is the most direct way to assess quality of experience (QoE). However, conventional assessment methods are not sufficient to evaluate the QoE of S-3DTV.
This thesis aims first to propose new methodologies to evaluate S-3DTV QoE; second, investigate different technical issues related to QoE along the 3DTV broadcasting chain; third, propose recommendations to optimize the S-3DTV QoE.
For methodological aspects, the key idea relies on using multidimensional QoE indicators. Visual fatigue, as a particular dimension of QoE, is addressed separately under optimized viewing conditions using questionnaire, vision test and EEG signals. For other QoE indicators, we design subjective QoE experiments to investigate the impact of content acquisition, 3D representation format, compression and transmission on the QoE of S-3DTV. The experiment results quantitatively reveal how perceived binocular depth, compression distortion, the cooperation between 3D representation formats and line interleaved display, and view asymmetries affect multidimensional QoE of S-3DTV. Additionally, we elaborate and validate improved stereoscopic shooting rules, depth budget for visual comfort, appropriate frame compatible format for line interleaved display, bitrate to broadcast S-3DTV, threshold for view asymmetries to avoid visual discomfort.
Keywords: 3DTV, quality of experience, visual fatigue, visual comfort, image quality,
Résumé
La TV 3D stéréoscopique (S-3DTV) est supposée améliorer la sensation de profondeur des observateurs mais possiblement en affectant d’autres facteurs de l’expérience utilisateur. L’évaluation subjective (avec observateurs) est la méthode la plus directe pour qualifier la qualité d’expérience (QoE). Cependant, les méthodes conventionnelles ne sont pas adaptées à l’évaluation de la QoE dans le cas de la S-3DTV.
Cette thèse a pour but de, premièrement proposer de nouvelles méthodologies pour évaluer la QoE dans pareil contexte ; deuxièmement investiguer les impacts de choix technologiques de la diffusion S-3DTV sur la QoE ; troisièmement proposer des recommandations pour optimiser la QoE.
Sur les aspects méthodologiques, l’idée clé repose sur une approche multidimensionnelle de la QoE via la définition de plusieurs indicateurs. La fatigue visuelle fait l’objet d’une étude expérimentale particulière en utilisant des questionnaires, tests de vision et analyse de signaux EEG dans des conditions de visualisation optimisés. D’autres indicateurs ont été mesurés pour investiguer quantitativement l’impact de l’acquisition, la représentation, la compression et la transmission du contenu S-3DTV sur la QoE. De plus, les règles améliorées de captation stéréoscopiques, de budget de profondeur «confortable», de débit de diffusion ont été élaborées et validées au travers des études expérimentales.
Mots clés: TV 3D, qualité d’expérience, fatigue visuelle, confort visuel, qualité
Contents i
Contents
CONTENTS... I LIST OF FIGURES... V LIST OF TABLES ... IX GENERAL INTRODUCTION ... 1CHAPTER 1 QOE CHALLENGES FOR S-3DTV ... 6
1.1 Introduction ... 6
1.2 Foundation of depth perception ... 7
1.2.1 Depth cues ... 7
1.2.2 Depth cues and S-3DTV: focus on binocular disparity ... 10
1.2.3 Depth cues sensitivity ... 12
1.3 From binocular vision to stereoscopic imaging system ... 14
1.4 The impact of S-3DTV on visual discomfort and visual fatigue ... 15
1.4.1 Definition... 16
1.4.2 Influencing factors ... 16
1.4.3 Discussion ... 23
1.5 QoE issues in modern S-3DTV broadcast chain ... 23
1.5.1 Content production ... 24
1.5.2 3D representation format ... 28
1.5.3 Coding and transmission ... 31
1.5.4 Visualization terminal ... 32
1.6 Conclusion... 36
PART I TOWARDS METHODOLOGIES FOR ASSESSING S-3DTV QOE....37
CHAPTER 2 METHODOLOGIES FOR ASSESSING 3D QOE ...38
2.1 Introduction ... 38
2.2 State-of-the-art: subjective QoE assessment for S-3DTV ... 39
2.2.1 ITU Recommendations ... 39
2.2.2 Explorative studies ... 45
2.2.3 Discussion ... 47
2.3 Towards comprehensive adaptation of subjective QoE assessment for S-3DTV 48 2.3.1 Proposal of QoE indicators ... 48
2.3.2 New factors affecting QoE assessment of S-3DTV... 49
2.4 Conclusion... 53
CHAPTER 3 CHARACTERIZING S-3DTV DISPLAYS ...55
3.1 Introduction ... 55
3.2 Luminance rendering ... 55
3.2.1 New characteristics of luminance rendering of S-3DTV display ... 56
3.2.2 Case study... 59
3.3 Depth rendering ... 60
ii
3.3.2 Analysis of depth rendering abilities of different S-3DTV displays... 62
3.3.3 Discussion of the depth rendering of S-3DTV display ... 65
3.4 Conclusion... 66
CHAPTER 4 MEASUREMENT OF VISUAL FATIGUE IN OPTIMAL VIEWING CONDITION OF S-3DTV ...67
4.1 Introduction ... 67
4.2 Objective and subjective methods ... 68
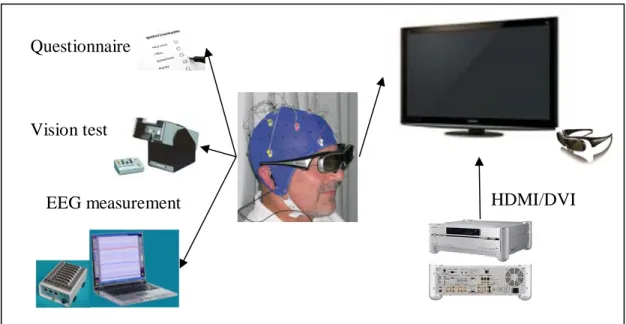
4.2.1 Vision test ... 69 4.2.2 Questionnaire ... 69 4.2.3 EEG measurement ... 73 4.3 Experiment design ... 75 4.4 Result analysis ... 76 4.4.1 Vision test ... 79 4.4.2 Questionnaire ... 80 4.4.3 EEG measurement ... 82 4.5 Discussion ... 88
PART II IMPACT OF CONTENT ACQUISITION ON S-3DTV QOE...89
CHAPTER 5 NEW PROPOSAL OF STEREOSCOPIC SHOOTING RULES TO IMPROVE THE QOE OF S-3DTV ...90
5.1 Introduction ... 90
5.2 New proposal of stereoscopic shooting rules based on stereoscopic distortion and comfortable viewing zone ... 91
5.2.1 Geometry of the camera space and the visualization space ... 91
5.2.2 Stereoscopic distortion ... 94
5.2.3 Comfortable viewing zone ... 100
5.2.4 Improved stereoscopic shooting rules ... 102
5.3 Verification of the proposed improved shooting rules ... 104
5.3.1 Stereoscopic image (synthetic) generation ... 104
5.3.2 Subjective QoE assessment ... 108
5.3.3 Result analysis ... 109
5.3.4 Discussion and conclusion ... 114
CHAPTER 6 THE IMPACT OF VARIATION OF PERCEIVED BINOCULAR DEPTH ON THE QOE OF S-3DTV ... 115
6.1 Introduction ... 115
6.2 Stereoscopic image (synthetic and natural) generation and capture... 116
6.3 Experimental setup ... 117
6.4 Result analysis ... 118
6.5 3D QoE modeling ... 121
6.6 Conclusion and recommendation ... 123
PART III IMPACT OF COMPRESSION, IMAGE REPRESENTATION FORMAT AND VIEW ASYMMETRY ON S-3DTV QOE ... 124
Contents
iii
CHAPTER 7 THE IMPACT OF JPEG 2000 COMPRESSION ON THE QOE
OF S-3DTV…… ... 125
7.1 Introduction ... 125
7.2 Experimental setup ... 126
7.3 Result analysis ... 127
7.4 3D QoE modeling ... 133
7.5 Conclusion and recommendation ... 133
CHAPTER 8 THE IMPACT OF IMAGE REPRESENTATION FORMATS ON THE QOE OF LINE INTERLEAVED S-3DTV ... 134
8.1 Introduction ... 134
8.1.1 Line Interleaved 3DTV... 135
8.1.2 Interlaced and progressive video signal ... 136
8.1.3 Different 3D stereo video representation formats ... 136
8.2 Experiment 1 ... 137 8.2.1 Methodology ... 137 8.2.2 Result analysis ... 140 8.2.3 Discussion ... 142 8.3 Experiment 2 ... 142 8.3.1 Methodology ... 142 8.3.2 Result analysis ... 143 8.3.3 Discussion ... 144
8.4 Conclusion and recommendation ... 145
CHAPTER 9 THE IMPACT OF VIEW ASYMMETRY ON THE QOE OF S-3DTV………….. ... 146 9.1 Introduction ... 146 9.2 View asymmetry on 3DTV ... 147 9.2.1 Luminance asymmetry ... 147 9.2.2 Color asymmetry ... 148 9.2.3 Geometrical asymmetry ... 149
9.3 Subjective QoE assessment ... 151
9.3.1 General experiment design ... 151
9.3.2 Result analysis ... 153
9.4 Conclusion and recommendation ... 159
GENERAL CONCLUSION ... 161
RESUME EN FRANÇAIS ... 165
But de la thèse ... 165
Vue d'ensemble de la thèse ... 166
R 1. Les défis liés à la QoE en TV S-3D ... 168
R 1.1 Les fondements de la perception de la profondeur ... 168
R 1.2 De la vision binoculaire au système vidéo stéréoscopique ... 170
R 1.3 L'impact de la TV S-3D sur l’inconfort visuel et la fatigue visuelle ... 171
R 1.4 Questions liées à la QoE dans une architecture de diffusion TV S-3D moderne ... 172
iv
R 2. Les méthodologies pour évaluer la QoE 3D ... 174
R 2.1 État de l'art : l'évaluation subjective de la QoE pour la TV S-3D ... 175
R 2.2 Vers l'adaptation complète de l'évaluation subjective de la QoE en TV S-3D ... 176
R 2.3 Conclusion ... 179
R 3. Caractérisation des écrans TV S-3D ... 179
R 3.1 Le rendu de la luminance ... 179
R 3.2 Le rendu de la profondeur... 181
R 3.3 Conclusion ... 183
R 4. Mesure de la fatigue visuelle dans des conditions de visualisation optimales ... 183
R 4.1 Méthodes objectives et subjectives ... 184
R 4.2 Le déroulement du test ... 185
R 4.3 Analyse des résultats ... 186
R 5. Nouvelle proposition de règles de prise de vue stéréoscopiques pour optimiser la QoE en TV S-3D ... 187
R 5.1 Nouvelle proposition de règles de prise de vue stéréoscopiques basées sur la déformation stéréoscopique et la zone de confort de visualisation ... 188
R 5.2 Vérification des règles de prise de vue optimales proposées ... 189
R 6. L'impact de la variation de la profondeur binoculaire perçue sur la QoE en TV S-3D…. ... 191
R 6.1 Organisation de l’expérimentation ... 192
R 6.2 Analyse des résultats ... 193
R 6.3 Principales conclusions et recommandation ... 193
R 7. Impact de la compression JPEG-2000 sur la QoE en TV S-3D ... 194
R 7.1 Organisation de l’expérimentation ... 195
R 7.2 Analyse des résultats ... 195
R 7.3 Principales conclusions et recommandation ... 196
R 8. Impact des formats de représentation d'image sur la QoE des écrans S-3D entrelacés ligne ... 196
R 8.1 Expérimentation 1 ... 198
R 8.2 Expérimentation 2 ... 199
R 8.3 Principales conclusions et recommandation ... 201
R 9. Impact de l'asymétrie de vues sur la QoE en TV S-3D ... 201
R 9.1 L'asymétrie de vues en TV 3D ... 202
R 9.2 Définition de l'expérimentation ... 203
R 9.3 Résultats et recommandation ... 204
Conclusion générale ... 205
APPENDIX A: S-3D VIDEO ENCODING ... 210
APPENDIX B. REPRESENTATION FORMAT CONVERSION ... 213
List of Figures
v
List of Figures
Figure I- 1 : The lenticular stereoscope (Wheatstone, 1838) ... 1
Figure I- 2 : Overview of contributions of this thesis ... 4
Figure 1-1 : Picture illustrating monocular depth cues in a 2D image ... 8
Figure 1-2 : Illustration of motion perspective. A close object that moves the same physical distance as a faraway object will have a larger angular speed, which is a cue of object distance. ... 9
Figure 1-3 : Stereoscopic vision.. ...10
Figure 1-4 : Horopter and Panum’s fusional area. ...11
Figure 1-5 : Depth contrast (sensitivity). ...13
Figure 1-6 : The principle of a simplest stereoscopic imaging system. ...15
Figure 1-7 : Convergence and accommodation in natural vision and viewing stereoscopic images. ...18
Figure 1-8 : 3DTV broadcasting chain ...24
Figure 1-9 : Monoscopic camera + depth sensor, ZCam system (Fig. 7 in (Iddan and Yahav, 2001)) ...25
Figure 1-10 : Toed-in camera (left) and parallel camera (right) configurations ...26
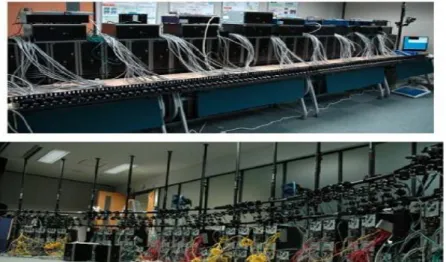
Figure 1-11 : A 100-cameras multiview system (Fig 6. from (Jolly et al., 2009) ) ...27
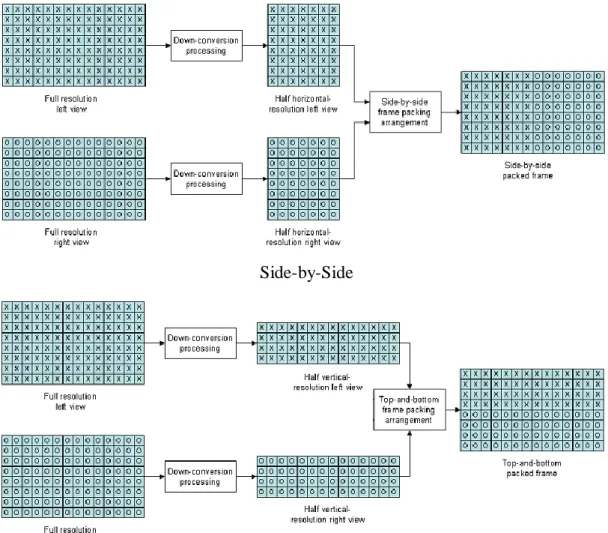
Figure 1-12 : Side-by-Side and Top-and-Bottom frame compatible formats (adapted from Fig 8 and 10 in (DVB, 2011)) ...29
Figure 1-13 : 2D-plus-depth format (Fig. 1 from (Solutions, 2008)) ...29
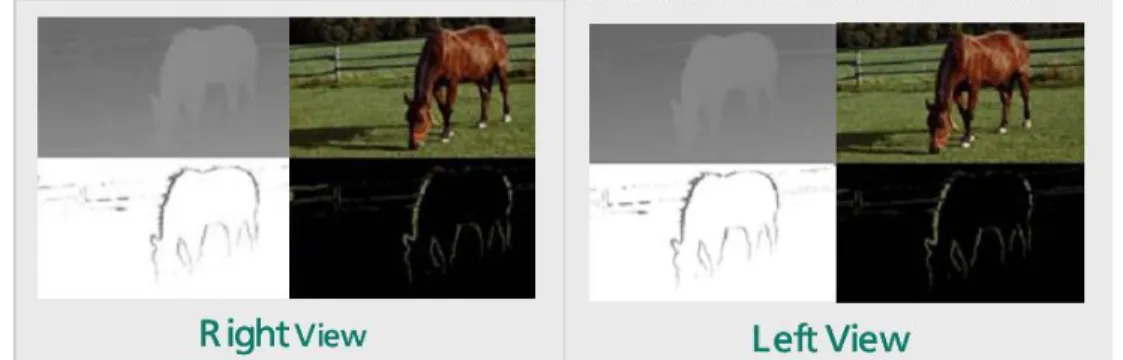
Figure 1-14 : LDV format: color (top) and depth (bottom) of main layer (left), occlusion layer (right) (Fig. 5-1, page 52 from (Kerbiriou et al., 2010)) ...30
Figure 1-15 : Depth enhanced stereo format (Fig.7 from (Smolic et al., 2009)) ...31
Figure 2-1 : Presentation structure of DSCQS and DSIS Variant II according to ITU-R BT.500-11 (ITU, 2002) ...42
Figure 2-2 : A SAMVIQ test organization example (Blin, 2006) ...43
Figure 2-3 : Model of 3D visual experience (Seuntiëns et al., 2006) ...46
Figure 3-1 : Schematic diagram of physical and perceptual parameters of depth rendering (adapted from (Holliman, 2004a)) ...61
Figure 4-1 : Objective and subjective method for measure visual fatigue ...68
Figure 4-2: Principle Lobes of the cerebrum (left) and Brodmann area of lateral surface (right) (adapted from (Brodmann, 2006))...73
Figure 4-3 : The spatial location of EEG electrodes (top: international 10-20 system; bottom: 16 channel system in this study) (adapted from Fig. 13.2. (malmivuo and Plonsey, 1995)) ...74
Figure 4-4 : The procedure of the experiment ...76
Figure 4-5 : De-nosing process for EEG data ...77
Figure 4-6 : Examples for visible artifacts (The marked green/grey parts of the EEG data frames are suspected to contain extreme values and abnormal trends) ...77
vi
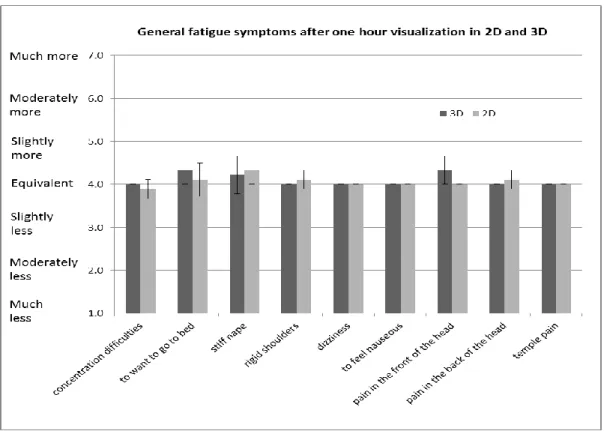
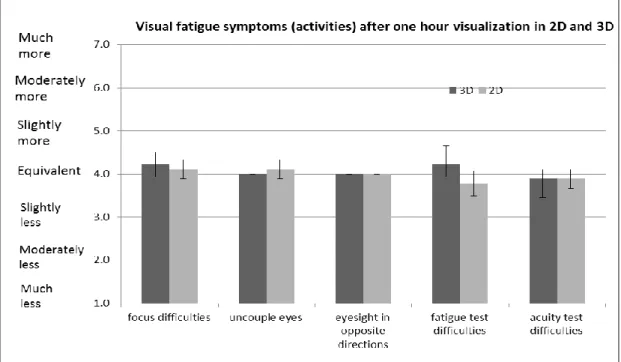
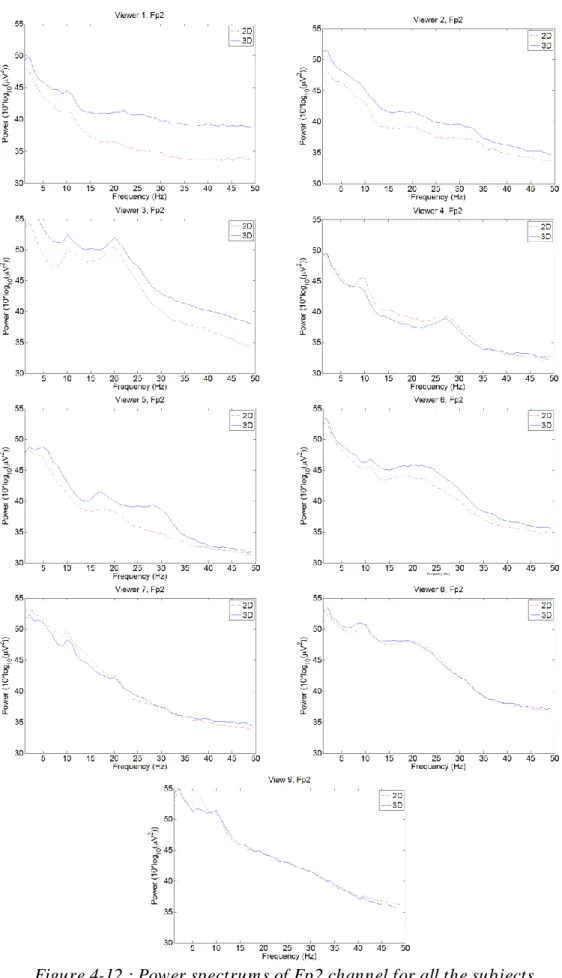
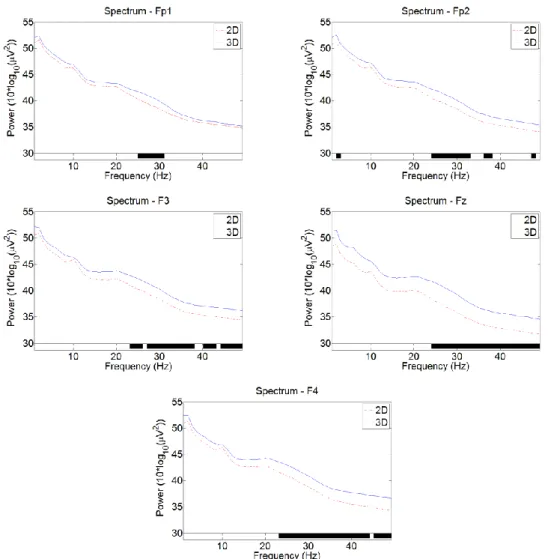
Figure 4-8 : Artifact component and its statistical analysis ...79 Figure 4-9 : General fatigue symptoms after one hour visualization in 2D and 3D ....81 Figure 4-10 : Visual fatigue symptoms (direct) after one hour visualization in 2D and 3D. ...81 Figure 4-11 : Visual fatigue symptoms (activities) after one hour visualization in 2D and 3D ...82 Figure 4-12 : Power spectrums of Fp2 channel for all the subjects ...83 Figure 4-13 : Mean power spectrum of Fp2 channel for all viewers with statistical significance mark. (The bottom black bar indicates whether the mean value between 2D and 3D conditions at that frequency is significantly different on a 95% confidence level) ...84 Figure 4-14 : Mean power spectrum with statistical significance mark for EEG
channels in the frontal lobe ...85 Figure 4-15 : Mean power spectrum with statistical significance mark for EEG
channels in the temporal lobe and central line ...85 Figure 4-16: Mean power spectrum with statistical significance mark for EEG
channels in the parietal lobe and occipital lobe ...86 Figure 4-17 : Fp1 (top) and Pz (bottom)’s mean power spectrum in different time periods (1 as 0 to 20 minutes; 2 as 20 to 40 minutes; 3 as 40 to 60 minutes) of 2D and 3D conditions with statistical significance analysis ...87 Figure 5-1 : Geometry of Parallel camera space (a) plane view (b) plane view ...93 Figure 5-2 : Geometry of visualization space (a) plane view (b) plane view ..93 Figure 5-3 : Stereoscopic distortion in the case of orthostereoscopic system (top left) plot of Z in visualization space versus z in camera space (top right) plot of
stereoscopic distortion versus z in camera space (bottom) illustration of the shape distortion in visualization space (each rectangle in camera space has been arbitrarily chosen to be 0.2 meters long in x axis and 0.2 meters long in z axis) ...96 Figure 5-4 : Stereoscopic distortion in the case of fixed camera baseline system (a) 50mm focal length; (b) 75mm focal length ...98 Figure 5-5 : Stereoscopic distortion in the case of fixed focal length system (a) 65mm camera baseline; (b) 100mm camera baseline; (c) 140mm camera baseline... 100 Figure 5-6 : Limits of the comfortable viewing zone ... 102 Figure 5-7 : The comfortable viewing zone ( ) ... 102 Figure 5-8 : Five selected scenes from “Big buck bunny” (top left: scene 1; top right: scene 2; mid left: scene 3; mid right: scene 4; bottom: scene 5 as defined in Table 5-5) ... 106 Figure 5-9 : Mean opinion scores and confidence intervals of depth rendering in five different conditions for the different scenes ... 110 Figure 5-10 : Mean opinion scores and confidence intervals of visual comfort in five different conditions for the different scenes ... 111 Figure 5-11 : Mean opinion scores and confidence intervals of visual experiences in five different conditions for the different scenes (red/deep color bar is the selected conditions which fulfill the proposed shooting rules in each scene) ... 112
List of Figures
vii
Figure 6-1: Three natural scenes and two synthetic scenes (Top left: Basket; top right butterfly; mid left: Forest; mid right: Interview; bottom: Bench) ... 116 Figure 6-2 : MOS (with their 95% confidence intervals) vs. Variation of DOF for different QoE indicators for different scenes (Basket, Butterfly, Forest, Interview, and Bench as shown in Figure 6-1) ... 119 Figure 6-3 : MOS (with their 95% confidence intervals) vs. Variation of DOF for different QoE indicators (Natural scene in solid line and Synthetic scene in dotted line) ... 120 Figure 6-4 : Acceptability vs. Quality grade of visual comfort ... 121 Figure 6-5 : 3D QoE model ... 122 Figure 7-1 : Test scenes (top) left: Bench, right: Interview (bottom) left: Butterfly, right: Forest ... 126 Figure 7-2 : The panel images of the 1(left) and 250(right) of JPEG compression ratios on the interview scene ... 127 Figure 7-3 : MOS of 2D image quality averaged over all scenes (with their 95% confidence intervals) vs. Variation of JPEG 2000 compression ratio for 2D (solid line) and 3D (dash line) conditions ... 128 Figure 7-4 : MOS of depth quantity (with their 95% confidence intervals) averaged over all scenes vs. Variation of JPEG 2000 compression ratio for 2D and 3D
conditions (2D is solid line and 3D is in dashed line) ... 129 Figure 7-5 : MOS of visual comfort (with their 95% confidence intervals) vs.
Variation of JPEG 2000 compression ratio for 2D and 3D conditions (2D is solid line and 3D is in dashed line) ... 130 Figure 7-6 : MOS of depth rendering (with their 95% confidence intervals) vs.
Variation of JPEG 2000 compression ratio for 2D and 3D conditions (2D is solid line and 3D is in dashed line) ... 131 Figure 7-7 : MOS of visual experience (with their 95% confidence intervals) vs. Variation of JPEG 2000 compression ratio for 2D and 3D conditions (2D is solid line and 3D is in dashed line) ... 131 Figure 7-8 : Estimated depth map in five different JPEG compression ratios ... 132 Figure 8-1 : Principle of line interleaved display ... 135 Figure 8-2 : Schematic diagram of four different 3D video format: (a) Side-by-Side with each view of 940x1080 pixels, (b) Top-and-Bottom with each view of 1920x540 pixels, (c) 1/3 horizontal and 1/3 vertical resolution with each view of 640x360 pixels, (d) Full resolution for each view with each view of 1920x1080 pixels ... 137 Figure 8-3 : Equipment setup of Experiment 1 ... 139 Figure 8-4 : Test environment... 139 Figure 8-5 : MOS of visual experience averaging over all scenes (with their 95% confidence intervals) vs. Reduction ratio of Image resolution per view ... 141 Figure 8-6 : MOS of depth rendering averaging over all the scenes (with their 95% confidence intervals) vs. Reduction ratio of Image resolution per view ... 141 Figure 8-7 : MOS of depth rendering averaging over progressive contents (top) and interlaced content (bottom) (with their 95% confidence intervals) vs. Reduction ratio of image resolution per view ... 142
viii
Figure 8-8 : MOS of visual experience for all scenes (with their 95% confidence
intervals) vs. compression bitrates ... 144
Figure 8-9 : MOS of visual experience averaging over all scenes (with their 95% confidence intervals) vs. compression bitrates ... 144
Figure 9-1 : white level asymmetry (distortion factor x percentage) ... 148
Figure 9-2 : Black level asymmetry (distortion factor x percentage) ... 148
Figure 9-3 : Color asymmetry in Red channel (distortion factor x percentage) ... 148
Figure 9-4 : Geometrical asymmetry (a) Vertical shift(x in percentage) (b) Rotation of one view (x in degree) (c) magnification of one view (x in percentage) ... 150
Figure 9-5 : Three original scenes: Forest (high texture, 0.2 diopters depth), Butterfly (mid texture, 0.1 diopters depth) and Basketball (low texture, 0 diopter depth) ... 151
Figure 9-6 : Stimulus timeline for the visual annoyance test ... 153
Figure 9-7 : Acceptability versus quality of visual comfort (from Figure 6-4, Chapter 6) ... 154
Figure 9-8 : The MOS score of visual annoyance (left column) and visual comfort (right column) with 95% confidence interval vs. Distortion level of Black (top) and White level (bottom) asymmetry: visibility threshold ( ), visual annoyance threshold ( ) and acceptability threshold ( ) ... 155
Figure 9-9 : The MOS score of visual annoyance (left column) and visual comfort (right column) with 95% confidence interval vs. Distortion level of Red (top), Green (mid), Blue (bottom) level asymmetry: visibility threshold ( ), visual annoyance threshold ( ) and acceptability threshold ( ) ... 156
Figure 9-10 : The MOS score of visual annoyance (left column) and visual comfort (right column) with 95% confidence interval vs. Distortion level of Vertical shift (top), Rotation (mid), Magnification (bottom) asymmetry: visibility threshold ( ), visual annoyance threshold ( ) and acceptability threshold ( ) ... 157
List of Tables
ix
List of Tables
Table 1-1 : Ranking of information sources by the areas under their curves in Figure
1-5 within three kinds of space (E.Cutting and M.Vishton, 1995) ...13
Table 1-2 : Illustration and threshold (visibility and visual discomfort) of stereoscopic asymmetries, adapted from Table 6-1 page 55 in (Balter et al., 2008) ...22
Table 1-3 : Characteristics of different display systems ...35
Table 2-1 : Specification of subjective quality assessment in ITU-R BT.500 ...40
Table 2-2 : ITU-R BT.500-10 recommendation rating scales (ITU, 2002) ...42
Table 2-3 : Recommendation for subjective assessment of S-3DTV (NTT, 2011) ...44
Table 2-4 : Overview of the explorative studies ...47
Table 2-5: New factors affecting subjective assessment for S-3DTV ...53
Table 3-1 : Suggested monitor performance specifications in ITU-R BT.500 ...55
Table 3-2 : Measurement cases of 3DTV ...59
Table 3-3 : Depth rendering abilities of different displays ...64
Table 3-4 : Depth rendering ability of Desktop (Full resolution) and TV (Line interleaved) in case of viewing distance as 4.5 times of display height ...65
Table 4-1 : Comparison scales for visual fatigue symptom ...70
Table 4-2 : Questionnaire before one hour hours viewing session ...71
Table 4-3 : Questionnaire after one hour video viewing session ...72
Table 4-4 : Characteristics of EEG frequency bands ...74
Table 4-5 : Vision test results (Performance change between the before and after vision test) in 2D and 3D for 9 viewers. ...80
Table 5-1 : Summary of the studies related to the comfortable viewing zone ... 101
Table 5-2 : The stereoscopic scene categorization ... 105
Table 5-3 : Overview of the five scenes and their characteristics ... 106
Table 5-4 : Fixed camera parameters ... 107
Table 5-5 : Camera baseline and shape distortion of five different conditions in five scenes ... 108
Table 5-6 : P-values of two ways ANOVA (“Camera baseline” and “Scene”) ... 113
Table 5-7 : P-values of two ways ANOVA (“DOF” and “Scene”) ... 113
Table 5-8 : Correlation coefficients among three pairs of subjective indicators ... 113
Table 6-1 : Scene parameters ... 117
Table 6-2 : Shooting parameters ... 117
Table 6-3 : Stereoscopic shape distortion ... 117
Table 6-4 : Weighted coefficients ... 122
Table 7-1 : Weighted coefficient... 133
Table 8-1 : Six selected sequences for test ... 138
Table 8-2 : The resolution per view under different resolution reduction ratios ... 138
Table 9-1 : Eight types of view asymmetries with four-level distortion ... 152
Table 9-2 : Impairment scale and quality scale ... 153
Table 9-3 : Unintentional vertical and horizontal disparities for each threshold and each type of geometrical asymmetry (pixel unit) ... 158
x
Table 9-4 : Estimated thresholds for view asymmetries ... 159
General Introduction
1
General Introduction
I. The history of stereoscopic imagesThe stereoscopic images history can be traced back to the first description of stereoscopic vision by Euclid (280 B.C). He described that the depth perception is obtained when each eye simultaneously perceives two slightly different images of the same object. In 1838, Sir Charles Wheatstone (Wheatstone, 1838) invented the first stereoscopic viewing device – the stereoscope as shown in Figure I- 1. The basic idea of this device was to separate the left and right viewing channels by additional instruments, e.g., mirrors, and to present different images individually to left and right eyes. This is also the basic principle and ancestor of modern stereoscopic device.
Figure I- 1 : The lenticular stereoscope (Wheatstone, 1838)
Between the 1840s and 1920s, stereoscopic images served as an important method of entertainment, education and virtual travel – predecessors to contemporary forms of media such as television and movies (Spiro, n.d.).
With the rapid development of modern movie and television technology, the first 3D test movie in anaglyph was produced by Edwin S. Porter and William E. Waddell in 1915. In 1922, the first public 3D movie in anaglyph “The power of love” was premiered (Zone, 2007) at the Ambassador hotel theatre in Los Angeles, American. In 1928, stereoscopic television was demonstrated for the first time by John Logie Baird. Later on, Edwin H. Land invented a polarizing sheet called Polaroid in 1932 and thereafter the polarization view separation technique started to be used to present stereoscopic movies as it can provide better quality than anaglyph technique.
In the 1950s, when TV became popular, many 3D movies were produced. The 1952 to 1955 period is called the first “golden era” for stereoscopic movies industry starting from the first colour stereoscopic feature, “Bwana Devil” presented to publics by Polaroid technique. A string of successful 3D movies was produced in this era. For example, the very first cartoon in 3D “Melody” by Walt Disney and the very first 3D movie with stereophonic sound “House of Wax” by Warner Bros were both produced and presented to the public during this era. However, the first 3D “golden era” declined from 1953 due to many reasons but mainly the immaturity of the production and display technology. For example, 3D required to project two synchronized prints
2
simultaneously on the screen. If one print is broken, it is hard to maintain synchronization after repair. Moreover, for 3D based on Polaroid technique, the silver screen for reflecting the polarized wave was directional and caused side-line seating to be unusable with both 3D and regular films. By the mid to late of 1950’s, 3D movies were out of favour and widescreen features were the dominant film format for moviegoers ("3D Moive Gaze", n.d.).
The revival of 3D started in the early 1960s with the invention of the Space-Vision 3D technique. In this technique, stereoscopic films were printed with two images, one above the other, in a single academy ratio frame, on a single strip. Thus, only one projector fitted with a special lens was needed (Mead, 2010). This so-called “over and under” technique re-attracted the producer and cinema owner back to 3D because it only required one projector and a broken print can still provide perfect synchronization after repair. In the 1960 to 1984, the main stream of stereoscopic 3D images in the cinema was still based on the anaglyph technology, which delivers the left and right images by separated colour channels. In 1985 to 2003, 3D display technologies based on the polarized glasses and active shutter glasses, which can provide better quality than anaglyph technology, was becoming more and more popular, e.g., the IMAX-3D cinema which has the capacity to record and display images of far greater size and resolution than conventional film systems.
By entering the 21st century, thanks to the rapid development of modern semiconductors and digital electronics technologies, stereoscopic 3D images resurged. In the cinema domain, combining with the computer rendering and editing technologies, more and more stereoscopic 3D movies were produced. One of the remarkable sign is that in 2009, the highest-grossing film of all time, AVATAR was presented mainly in stereoscopic 3D to the public. In the television domain, after the success and standardization of High Definition television (HDTV), the stereoscopic 3D television is widely discussed as the possible successor. The market research firm “Park association” estimated that 80% of TVs sold in 2014 will be capable of playing 3D content (Macchiarella, 2010).
II. Aim of this thesis
As presented in the previous section, stereoscopic 3D television (S-3DTV) might be the possible successor of HDTV. Compared with conventional 2DTV, the interest of S-3DTV is that it can provide enhanced depth sensation to viewers. However, it is still not a perfect representation of the real world and somehow it is only an illusion. Thus, new issues such as visual discomfort or stereoscopic distortion might be induced due to perceptual and/or technical problems.
Quality of experience (QoE) is a measure of customer’s experience. “Picture Quality” is often used to represent the QoE for 2DTV. Subjective quality assessment is the conventional way to evaluate the “Picture Quality” of 2DTV system. However, first, “Picture Quality” is not sufficient to represent QoE of S-3DTV because it cannot
General Introduction
3
directly highlight the advantages such as enhanced depth perception and the problems such as visual discomfort of S-3DTV. Second, conventional subjective quality assessment methods do not consider the new characteristics of S-3DTV, e.g., there is a lack of specification of the viewing environment for S-3DTV. Thus, developing new subjective QoE assessment methodologies dedicated to S-3DTV is mandatory. It will help to characterize the QoE of S-3DTV, ease the specification of end-to-end applications and optimize the design of different techniques for S-3DTV broadcasting. The aim of this thesis covers three parts:
To propose new methods to evaluate the QoE of S-3DTV
To use the proposed methods to investigate the impact of different perceptual and technical problems (along the 3DTV broadcast chain) on the QoE of S-3DTV To provide recommendations related to perceptual and technical problems in order
to optimize the QoE of S-3DTV
III. Overview of this thesis
Chapter 1 introduces the QoE challenges of S-3DTV as the background of this thesis. It presents the foundation of depth perception and the principle of stereoscopic imaging system. The fundamental advantages such as enhanced depth perception and problems such as visual discomfort and visual fatigue of S-3DTV on QoE are revealed. Moreover, the QoE issues related to different individual parts of the S-3DTV broadcasting chain (Content production, 3D representation format, coding and transmission and visualization terminal) are presented and discussed.
After this introduction, the contributions of the thesis are divided into three parts as illustrated in Figure I- 2. Each part is corresponding to different individual parts of the S-3DTV broadcasting chain.
Part I consists of three chapters (Chapter 2, Chapter 3, and Chapter 4). It presents the contributions of this thesis towards methodologies for assessing 3D QoE. In Chapter 2, first, we review the ITU recommendations and explorative studies related to subjective QoE assessment for S-3DTV. Second, towards a comprehensive adaption of subjective QoE assessment for S-3DTV, we propose to use multi-dimensional QoE indicators and to consider new factors affecting the QoE of S-3DTV in subjective assessment. Subjective QoE assessment with Multi-dimensional QoE indicators will serve as the main method for QoE assessment in this thesis. As display performance in subjective assessment is a critical issue affecting the QoE of S-3DTV, in Chapter 3, we propose new methods to characterize the luminance rendering and depth rendering of S-3DTV. Furthermore, Chapter 4 presents a study of measuring visual fatigue in optimal viewing condition. Three methods including vision test, questionnaire and EEG signal measurement are used in this study to measure visual fatigue.
4
* View asymmetry is a global problem related to every part of S-3DTV. Figure I- 2 : Overview of contributions of this thesis
Part II including two chapters (Chapter 5 and Chapter 6) presents the contributions of this thesis towards understanding the impact of content acquisition on S-3DTV QoE. In Chapter 5, we propose stereoscopic shooting rules to optimize the content acquisition of S-3DTV considering stereoscopic distortion and the comfortable viewing zone in the final perception. Synthetic contents in different conditions corresponding to our improved shooting rules are generated. A subjective assessment with three QoE indicators is used to verify our improved shooting rules. In Chapter 6, both synthetic contents and natural contents in different levels of perceived binocular depth are generated controlling precisely shooting parameters. A subjective QoE assessment using six QoE indicators is carried out to evaluate the impact of variation of perceived binocular depth on the QoE of S-3DTV. Finally, a limit for perceived depth range is recommended.
End user QoE
Visualisation Terminal Content production Coding and transmission 3D representation format S-3DTV broadcast chain Part I Towards methodologies for assessing S-3DTV QoE Chapter 2 Methodologies for assessing 3D QoE Chapter 3 Characterizing
S-3DTV displays Chapter 4 Measurement of
visual fatigue
To propose methods to evaluate QoE of S-3DTV
Part II Impact of content acquisition
on S-3DTV QoE Part III Impact of
compression, image representation format and view asymmetry on
S-3DTV QoE
Chapter 5 New proposal of stereoscopic shooting rule
o
Chapter 6 Variation of perceived binocular depth
Chapter 7 JPEG 2000 compression Chapter 8 3D image representation format Chapter 9 View asymmetry*
To investigate the impact of different perceptual and technical problems on QoE of S-3DTV
To provide recommendations to optimize QoE of S-3DTV
General Introduction
5
Part III including three chapters (Chapter 7, Chapter 8 and Chapter 9) presents the contributions of this thesis to evaluate the impact of other important technical problems including compression, image representation format and view asymmetry on the QoE of S-3DTV. Chapter 7 focuses on the impact of JPEG 2000 compression on stereoscopic still images. Five QoE indicators are used in the subjective QoE assessment. Chapter 8 describes two experiments which aim at investigating the impact of 3D representation formats on the QoE of line interleaved S-3DTV. The first experiment focuses on understanding the resolution reduction effect of different frame-compatible formats on S-3DTV. The second experiment is designed to compare the QoE of different frame-compatible formats under different compression bitrates. Chapter 9 aims to evaluate the impact of view asymmetry on the QoE of S-3DTV. Perceptual thresholds for different types of view asymmetries are measured and recommended.
6
Chapter 1
QoE challenges for S-3DTV
Contents
1.1 Introduction ... 6 1.2 Foundation of depth perception ... 7 1.2.1 Depth cues ... 7 1.2.2 Depth cues and S-3DTV: focus on binocular disparity ... 10 1.2.3 Depth cues sensitivity ... 12 1.3 From binocular vision to stereoscopic imaging system ... 14 1.4 The impact of S-3DTV on visual discomfort and visual fatigue ... 15 1.4.1 Definition... 16 1.4.2 Influencing factors ... 16 1.4.3 Discussion ... 23 1.5 QoE issues in modern S-3DTV broadcast chain ... 23 1.5.1 Content production ... 24 1.5.2 3D representation format ... 28 1.5.3 Coding and transmission ... 31 1.5.4 Visualization terminal ... 32 1.6 Conclusion... 36
1.1 Introduction
Quality of Experience (QoE) is a measure of customer’s experiences. For S-3DTV, it is the measure of a viewer’s experiences with stereoscopic images on S-3DTV. Compared with 2DTV, S-3DTV is able to provide additional depth information, i.e., the binocular disparity. This may enhance the depth perception and improve the QoE. Meanwhile, S-3DTV is still not a perfect presentation of a natural scene. Viewing stereoscopic images on S-3DTV may not be exactly the same as viewing a natural scene. These discrepancies may induce QoE issues and even result in visual discomfort and visual fatigue. Moreover, technical issues from the modern S-3DTV broadcast chain also have potential influence on the QoE of S-3DTV. In this chapter, we aim to present the QoE challenges for S-3DTV.
This chapter is organized as follows:
Section 1.2 presents the foundation of human depth perception. Different depth cues and their utilities at different depth ranges are introduced. Moreover, we present a focused discussion on binocular disparity which is the most important added value of S-3DTV. Section 1.3 presents the principle of stereoscopic imaging system which consists of image acquisition and image visualization. The discrepancies between viewing stereoscopic images and viewing real scenes are revealed. These discrepancies may result in visual discomfort and visual fatigue. Thus, Section 1.4
Chapter 1
7
presents the potential impact of S-3DTV on visual discomfort and visual fatigue. Furthermore, different techniques in modern S-3DTV broadcast chains may also have potential influence on the QoE. Section 1.5 presents the characteristics of different techniques in the production, different formats of 3D representation, different coding and network transmission scenarios, and different visualization terminals. Moreover, their QoE issues are discussed. Section 1.6 summarizes the QoE challenges for S-3DTV.
1.2 Foundation of depth perception
Human depth perception, also called perception of layout, is the ability to see and understand the three-dimensional world. It is one of the major functions of our visual system. Since our eyes only have two-dimensional retinal images and no special third component for depth perception, it is an interpretation of physiological cues that leads to useful perception. Depth perception is the combination of the retinal images from our two eyes to extract the best and most convincing information about the three dimensions of our world. Strictly speaking, observers do not see depth but objects in depth, and they do not see space but objects in space.
Section 1.2.1 introduces different depth cues. Compared with 2DTV, S-3DTV adds stereoscopic information, i.e., the binocular disparity. Section 1.2.2 gives a focused discussion on the binocular disparity and how our visual system processes it to generate the 3D sensation. Section 1.2.3 discusses the sensitivity of different depth cues and how they are combined to form the final depth sensation.
1.2.1 Depth cues
The sources of depth information, i.e., depth cues, can be categorized into four groups (Palmer, 1999): pictorial information (e.g., Occlusion, relative size, relative density, height in the visual field), dynamic information (motion parallax and motion perspective), ocular information (convergence and accommodation) and stereoscopic information (binocular disparity).
Pictorial information
Pictorial information can be extracted directly from static and monocular 2D pictures. It also explains why in the case of closing one eye, we can still perceive and judge depth in the real world and why we can perceive good depth even when viewing 2D images.
1) Occlusion: occurs when one object hides, or partially hides, another from view.
The occluded object is further away than the occluding object.
2) Relative size: is the measure of the projected retinal size of objects or textures
that are physically similar in size but at different distances. The further away a similar object is located, the smaller the size of the retinal image it produces.
3) Relative density: concerns the projected retinal density of a cluster of objects or
8
4) Height in the visual field: are the projected relations of the base of objects in a
three-dimensional environment to the viewer, moving from the bottom of the visual field to the top. It yields not only the good ordinal information about distance from the point of observation, but also the potential of absolute distance. The object further away is generally higher in the visual field.
5) Aerial perspective: is determined by the relative amount of moisture, pollutants,
or both in the atmosphere through which one looks at a scene (E.Cutting and M.Vishton, 1995), When air contains a high degree of either, objects in the distance become bluer, decreased in contrast, or both with respect to objects in the foreground.
Besides the above five monocular depth cues, the way that light reflects from objects provides cues to their depth relationships. Shadows are particularly important in this respect. Thus, light and shade (Holliman, 2004a, Seuntiëns, 2006) can be also used as pictorial information. Moreover, linear perspective (Holliman, 2004a, Balter et al., 2008) refers to the fact that parallel lines, such as railroad tracks, appear to converge with distance. The more such lines converge, the further away they are.
Most of these monocular depth cues are illustrated in Figure 1-1.
Figure 1-1 : Picture illustrating monocular depth cues in a 2D image (Photographer Jakob Voss)
Dynamic information
Dynamic information occurs when retinal images changes over times because of image motion or head movement.
6) Motion parallax and motion perspective: is the relative movement of the
projections of several stationary objects caused by observer movement. The motion of a whole field of such objects is called motion perspective. Objects that
Occlusion Relative size
Linear perspective
Shading Height in the visual field
Chapter 1
9
are closer will move faster in terms of angular speed than objects that are further away. Figure 1-2 illustrates the motion perspective.
Figure 1-2 : Illustration of motion perspective. A close object that moves the same
physical distance as a faraway object will have a larger angular speed, which is a cue of object distance.
Ocular information
The ocular information occurs when the left and right eye balls have relative movement or the lens of the eye change. It consists of two depth cues:
7) Convergence: is related to the fixation of the eye and it can be measured by the
angle between the optical axes of the two eyes. Fixating on a closer object requires more convergence more than fixating on a distant object. Thus, the convergence level contains the information of the distance between the objects.
8) Accommodation: is the change in the shape of the lens of the eye, allowing it to
focus on objects near or far while still keeping the retinal image sharp. The muscles of the lens are relaxed when focusing on the objects far away and contracted when focusing on the objects nearby.
The mechanisms of vergence and accommodation system are very complex. The primary stimuli for vergence and accommodation are retinal disparity (Stark et al., 1980) and retinal blur respectively (Phillips and Stark, 1977). However, they are both elicited in response to proximal cues (Hokoda and Ciuffreda, 1983), changes in tonic innervations (Owens and Leibowitz, 1983). Furthermore, vergence and accommodation normally interact and couple with each other (Suryakumar, 2005), i.e., when our eyes fixate on the object of interest, the focus also adapts to guarantee that the perceived image is sharp.
Stereoscopic information
As shown in Figure 1-3, humans have a total field of view (FOV) between 160 to 208 degrees, averaging around 140 degrees for each eye. There is a binocular field of 120 to 180 degrees (Yeh and Silverstein, 1990, Nagata, 1996). In natural vision, when we are looking at a real scene, our two eyes converge on and accommodate the object of
10
interest. Because of the interpupillary distance (IPD), the scene projection on retinal receptors is slightly different for each eye. The human visual system uses these small differences, the binocular disparity, to gain a more accurate judgment of depth and shape (Wheatstone, 1850).
Figure 1-3 : Stereoscopic vision. Retinal images are obtained by geometric
projections of the real world. Because of the ocular distance between the eyes, retinal images are slightly different. The visual system can exploit these differences to generate an advanced perception of depth.
9)
Binocular disparity: due to the fact that human eyes are separated by aninterpupillary distance (IPD) of 63mm on average (Dodgson, 2004), each eye receives a slightly different perspective of the same scene as shown in Figure 1-3. The difference in relative position of the projections of the same object on the retinas of the two eyes is called binocular disparity or retinal disparity. The brain can process this disparity information to perceive the relative (perceived distance between objects) and absolute depths (perceived distance from observer to objects). The ability of the brain to process the binocular disparity information is referred to as stereopsis. A more thorough discussion will be given in the next section.
1.2.2 Depth cues and S-3DTV: focus on binocular disparity
Compared with 2DTV, the most important depth cue added by S-3DTV is the binocular disparity. This section focuses on the discussion of how our visual system processes the binocular disparity to generate the 3D sensation. First, we introduce several basic concepts and definitions of functions of the human visual system related to the process of binocular disparity:
Stereopsis: is the ability of the brain to process the binocular disparity information in order to generate an enhance depth perception.
Horopter: is used to name the geometric arc passing through the fixation point that connects all points in space stimulating corresponding retinal cells (also referred to as cells with zero disparity).
Stereoscopic
Eye s
Left eye view Right eye view
Binocular field
Total FOV
Interpupillary distance
Chapter 1
11
Panum area: is defined as the area in space surrounding the horopter where sensory fusion takes place and a single binocular vision is still maintained.
Figure 1-4 : Horopter and Panum’s fusional area. The fixation point is on the
object A. The fovea is the central part of the retina which is responsible for sharp and color vision. AL and AR represent the object A’s retinal image in left and right eye,
respectively. They are located in the fovea. The horopter often modeled as a circle centered close to the observer’s eye and passing through fixation point. Objects on the horopter stimulate corresponding retinal points. The horopter is also referred to as zero retinal disparity region. The binocular disparity of object B can be represented by BLAL-BRAR. Since it locates in the Panum’s Fusional area, the brain can still fuse the
image of object B from both eyes. The disparity of object B represents its position in depth to the fixated object A. Object C located outside the Panum area evokes a large crossed disparity. The brain cannot fuse it and thus it will be perceived as diplopia (commonly known as double vision). (Figure adapted from Fig.1 (Patterson, 2007)) When our eyes fixate and focus on an object, it stimulates corresponding retinal areas in both eyes. Thus zero disparity is perceived for the fixated object, as for object A in Figure 1-4. Objects located in front of the horopter generate crossed disparity while object located behind the horopter generated uncrossed disparity. Inside the Panum’s fusional area, the retinal images of the object can be fused and a single binocular vision can be maintained. Outside the Panum area, it results in diplopia, as for object C in Figure 1-4. The size of the Panum area or the limit of fusional disparity depends on various factors including eye movements (Yeh and Silverstein, 1990), stimulus properties (Patterson, 2007), temporal modulation of the retinal disparity information (Schor and Tyler, 1981), exposure duration, amount of luminance (Schor and Wood, 1983), and individual difference (Richards, 1970).
C A
Fovea
B CL CR AL AR BL BRHoropter
Panum’s
Fusional area
Fixation
point
12
Stereoblindness is the inability of perceiving stereoscopic depth using stereopsis. Richards (Richards, 1970) performed a survey among 150 participants and found that 4 % of the participants were unable to use the cue offered by disparity, and another 10 % had great difficulty and incorrectly reported the depth relative to the background. Furthermore, stereoacuity is used to define the ability of human stereopsis to distinguish the minimum disparity. People can detect as low as 2 seconds of arc close to the horopter (IJsselsteijn et al., 2002). Further away from the horopter, stereoacuity reduces. It may vary depending on different condition of the perceived object and environment, e.g., spatial frequency. In, (Schor and Wood, 1983), the authors reported that the stereoacuity threshold depends on the spatial frequency. In their experiments, the stereoacuity threshold increases from 20 second of arc to 5 minute of arc corresponding to the reduction of the spatial frequency from 2-20 cycles per degree to 0.1 cycles per degree. Moreover, stereoacuity also depends on the individual differences. In (Coutant and Westheimer, 1993), B. E. Coutant et al. showed that 97.3 % of people are able to distinguish depth at horizontal disparities of 2.3 minutes of arc or smaller, and at least 80% could distinguish depth at horizontal difference of 30 seconds of arc.
The brain uses binocular disparity to extract depth information from the two-dimensional retinal images in stereopsis, achieving better depth discrimination than only using single image from one eye. Besides better discrimination in depth, the visual acuity can be enhanced by stereopsis when disparities fall within certain boundaries. This is called binocular summation when visual acuity is performed better with two eyes than with one eye (Banton and Levi, 1991). When the differences between the stimuli presented to the two eyes are too large, other precepts become dominant such as binocular mixture, binocular rivalry and suppression, and binocular luster. In case of binocular mixture, the final perceived image is a spatial mix of the left and right images. In case of binocular rivalry, the visibility of the images in both eyes fluctuates: when one eye becomes visible, the view of the other eye is rendered invisible and suppressed. Binocular luster occurs when the luminance or color of uniform areas is different in the two eyes, images will be stable and fused, but shimmer and luster may happen resulting in the failure of depth localization.
1.2.3 Depth cues sensitivity
As presented in previous sections, depth perception arises from a variety of depth cues, e.g., occlusion, binocular disparity, motion perspective, height in the visual field. However, their sensitivity varies depending on the viewing distance. E. Cutting and M. Vishton in (E.Cutting and M.Vishton, 1995) provided thorough results and discussions of the relative information potency of depth cues at various distances (Personal space, Action space and Vista space) as shown in Figure 1-5. The vertical axis, i.e., depth contrast, is defined using distances of two objects, and : the ratio of the just-determinable difference in distance between them over their mean distance, . The horizontal axis, i.e., the depth distance, is defined as their mean distance from the observer, . A smaller depth contrast value means higher depth sensitivity. The ranking of depth cues by the areas
Chapter 1
13
under their curves (see Figure 1-5) within three kinds of spaces are presented in Table 1-1.
Figure 1-5 : Depth contrast (sensitivity) as a function of the log distance from the observer, from 0.5 to 5000 meters, for nine different sources of information about the layout (E.Cutting and M.Vishton, 1995).
Table 1-1 : Ranking of information sources by the areas under their curves in Figure 1-5 within three kinds of space (E.Cutting and M.Vishton, 1995)
Source of information Personal space Action space Vista space
1. Occlusion 1 1 1
2. Relative size 4 3.5* 2
3. Relative density 7 6 4.5*
4. Height in the visual field 2 3 5. Aerial perspective 8 7 4.5* 6. Motion perspective 3 3.5* 6 7. Convergence 5.5* 8.5* 8.5* 8. Accommodation 5.5* 8.5* 8.5* 9. Binocular disparity 2 5 7
*Float number indicates there are at least two depth cue rated as the same rank.
Starting with pictorial information, occlusion is ranked as the most sensitive depth cue in all three kinds of spaces. For relative size and relative density, their sensitivities are constant with increasing distance. For height in visual field, it is only valid in long distance (Action space and Vista space) and its sensitivity reduces with increasing distance. For relative size and relative density, their sensitivities are constant in all
14
distances. For aerial perspective, it is only valid in vista space. Its sensitivity tends to first increase until a peak and then to reduce when the viewing distance increases. A common trend for pictorial information (expect occlusion) is that their rankings tend to rise with increasing viewing distance.
Concerning dynamic information, motion perspective is ranked the third sensitive depth cues in near distance (Personal space). However, its sensitivity reduces with increasing distance.
Considering ocular information, in long distance (Action space and Vista space), convergence and accommodation are ranked as the least sensitive depth cue. However, in near distance (Personal space), they are still high sensitive depth cues at close distance for specifying the absolute distance of objects (Goodwin, 1995), i.e., the perceived distance from the observer to objects.
For stereoscopic information, the binocular disparity occurs when the object is located in the binocular field as shown in Figure 1-3. It is ranked as second sensitive cue in nine different depth cues in the Personal space in Table 1-1. It indicates that it is a very important and efficient depth cue in close distance. This is also the most important interest and principle behind 3DTV. Since the viewing distance of S-3DTV is normally located within the personal space (less than 3 meter), adding binocular depth disparity information will provide an important depth cue to the human visual system, thus enhancing the depth perception.
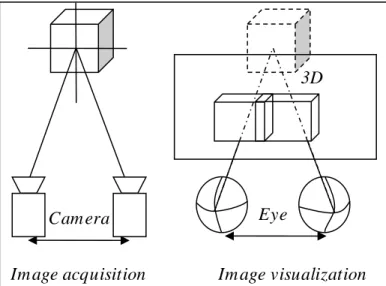
1.3 From binocular vision to stereoscopic imaging system
Inspired by the human binocular vision: “… the mind perceives an object of three dimensions by means of the two dissimilar pictures projected by it on the two retina …”, Sir Wheatstone (Wheatstone, 1838) showed that binocular disparity was an effective depth cue by creating the illusion of depth from flat pictures that differed only in horizontal disparity. Thus, he invented the “Stereoscope” in 1838 as shown in Figure I- 1. The basic idea of this device was to separate the left and right viewing channels by additional instruments, e.g., mirrors, and to present different images individually to the left and right eyes. This is also the basic principle and ancestor of modern stereoscopic device.
The original images for the “Stereoscope” were drawings because photography was not yet available. Modern stereoscopic images are captured by two cameras with a horizontal offset. Thus, the simplest modern stereoscopic imaging system for image acquisition and visualization consists of:
For image acquisition, two video cameras are used to replace the left and right eyes. Binocular disparity information is represented by the slightly horizontal difference between the left and right images, i.e., image disparity.
For image visualization, the recorded images from the left and right camera are delivered to the left and right eye respectively. Generally, the separation between the left and right image can be carried out using dedicated stereoscopic display technique, for example anaglyph, polarization, active shutter, parallax barrier or
Chapter 1
15
lenticular sheet (Further discussion in Section 1.5.4). In this part, binocular disparity information is visualized on the screen as normally a representation of image disparity, i.e., screen disparity.
Figure 1-6 depicts the principle of such simplest stereoscopic imaging system. Compared with a 2D image system, a stereoscopic imaging system is able to create an illusion of depth sensation by adding binocular disparity information. However, it is important to note that accommodation and convergence information is not reconstructed as the visualization system shows the image information on a planar screen. Moreover, the binocular disparity information may not be identical to viewing the scene directly since it depends on image acquisition parameters and image visualization parameters (detailed in Chapter 3).
Figure 1-6 : The principle of a simplest stereoscopic imaging system.
On one hand, studies such as (Lambooij et al., 2011, IJsselsteijn et al., 2000) confirmed that the subjective feeling of immersion, depth, naturalness and visual experience are significantly enhanced with stereoscopic images in comparison with 2D ones.
On the other hand, studies such as (Kooi and Toet, 2004, Woods et al., 1993, Yano et al., 2004, Yano et al., 2002, Lambooij et al., 2009a) revealed that problems such as image asymmetry, stereoscopic distortion, decoupling of accommodation and convergence may occur. These negative effects can induce visual discomfort and visual fatigue as detailed in the next section.
1.4 The impact of S-3DTV on visual discomfort and visual fatigue
As presented in the previous section, viewing stereoscopic images is just an illusion of enhanced depth. Compared with viewing 2D images, visual discomfort and visual fatigue are more frequently reported when viewing stereoscopic images. The discrepancies between viewing stereoscopic image and viewing the real scene are recognized as the potential sources of visual discomfort and visual fatigue. In this section, we aim to investigate the potential effect of these discrepancies on visual
Eye s Camera
3D display
16
discomfort and visual fatigue. It will also lead to a general proposal to optimize the stereoscopic images to avoid visual discomfort and visual fatigue.
1.4.1 Definition
In the literature, visual discomfort is used interchangeably with visual fatigue. In this thesis, we make a distinction between them by defining that:
Visual discomfort: it is defined as the observer’s particular complaints caused by unnatural visual stimuli. As such, it is a somewhat ambiguous concept, with numerous and widespread causes, symptoms, and associated indicators. It is assumed to be more related to short term effects which can only be explained and measured subjectively.
Visual fatigue: as defined in (Lambooij et al., 2009b), it is a decrease in performance of the visual system. It is assumed to be a subjectively and objectively measurable criterion that is of particular value of ascertaining long-term adaptive processes of the visual system.
Visual discomfort and visual fatigue are not isolated from each other. Perceived visual discomfort measured subjectively is expected to provide indication of the measurable visual fatigue. However, short term visual discomfort may only reflect an adaptation of the visual system and does not cause necessarily visual fatigue. Moreover, the decrease in performance of the visual system is also not always related to visual fatigue. It is essential to distinguish clinically significant visual fatigue from unproblematic, functional adaptation of the visual system.
Concerning the measurements of visual discomfort: Wöpking in (Wöpking, 1992) used subjective assessment of annoyance to measure the visual discomfort on stereoscopic images. Yano et al. in (Yano et al., 2002) used single stimulus continuous quality evaluation (SSCQE) to detect visual discomfort when viewing stereoscopic videos. Jing et al. (Jing Li, 2011) used the pair comparison method in subjective experiment to compare the comfort level between stereoscopic images. Considering the measurements of visual fatigue: in (Li et al., 2008), electroencephalography (EEG) signal was analyzed to indicate visual fatigue; Yano et al. in (Yano et al., 2002, Yano et al., 2004) suggested that the change of discrepancy of accommodation and vergence may indicate visual fatigue; Emoto et al. in (Emoto et al., 2004) proposed that the change of fusional amplitude and accommodation response is a valid indicator for visual fatigue.
1.4.2 Influencing factors
The main factors, which may cause visual discomfort and visual fatigue when watching S-3DTV, are summarized as follows:
Excessive Screen Disparity
As presented in the last section, screen disparity is a representation of image disparity captured by the left and right camera, leading to the binocular disparity information in the final visualization. Lambooij et al. in (Lambooij et al., 2009b) made a distinction