HAL Id: hal-00317475
https://hal.archives-ouvertes.fr/hal-00317475
Submitted on 14 Jul 2004
HAL is a multi-disciplinary open access
archive for the deposit and dissemination of
sci-entific research documents, whether they are
pub-lished or not. The documents may come from
teaching and research institutions in France or
abroad, or from public or private research centers.
L’archive ouverte pluridisciplinaire HAL, est
destinée au dépôt et à la diffusion de documents
scientifiques de niveau recherche, publiés ou non,
émanant des établissements d’enseignement et de
recherche français ou étrangers, des laboratoires
publics ou privés.
S. N. Walker, H. St. C. K. Alleyne, M. A. Balikhin, M. André, T. S. Horbury
To cite this version:
S. N. Walker, H. St. C. K. Alleyne, M. A. Balikhin, M. André, T. S. Horbury. Electric field scales
at quasi-perpendicular shocks. Annales Geophysicae, European Geosciences Union, 2004, 22 (7),
pp.2291-2300. �hal-00317475�
Annales Geophysicae (2004) 22: 2291–2300 SRef-ID: 1432-0576/ag/2004-22-2291 © European Geosciences Union 2004
Annales
Geophysicae
Electric field scales at quasi-perpendicular shocks
S. N. Walker1, H. St. C. K. Alleyne1, M. A. Balikhin1, M. Andr´e2, and T. S. Horbury3
1Department of Automatic Control and Systems Engineering, University of Sheffield, Mappin Street, Sheffield, S1 3JD, UK 2Swedish Institute of Space Physics, Uppsala Division, Box 537, SE-751 21 Uppsala, Sweden
3Blackett Laboratory, ICSTM, Prince Consort Road, London. UK
Received: 29 September 2003 – Revised: 4 May 2004 – Accepted: 14 May 2004 – Published: 14 July 2004 Part of Special Issue “Spatio-temporal analysis and multipoint measurements in space”
Abstract. This paper investigates the short scale structures that are observed in the electric field during crossings of the quasi-perpendicular bow shock using data from the Cluster satellites. These structures exhibit large amplitudes, as high as 70 mVm−1 and so make a significant contribution to the overall change in potential at the shock front. It is shown that the scale size of these short-lived electric field structures is of the order of a few c/ωpe. The relationships between the scale
size and the upstream Mach number and θBnare studied. It
is found that the scale size of these structures decreases with increasing plasma β and as θBn → 90◦. The amplitude of
the spikes remains fairly constant with increasing Ma and
appears to increase as θBn→90◦.
Key words. Magnetospheric physics (electric fields) – Space plasma physics (electrostatic structures: shock waves)
1 Introduction
The interaction between the electromagnetic field and parti-cles in a collisionless shock replaces the role played by col-lisions in a normal hydrodynamics. The spatial scales of the electric and magnetic fields determine the type of interac-tions (e.g. adiabatic, etc.) that take place between the incom-ing plasma particles and the shock front. The magnetic field structure of the terrestrial bow shock has been intensely stud-ied since it was first observed back in the 1960s. In partic-ular, the spatial scales of its various regions have been com-prehensively investigated (Balikhin et al., 1995; Farris et al., 1993). Typically, the scale sizes of the foot and overshoot regions are of the order of c/ωpi and 3c/ωpi, respectively.
The ramp scale has been estimated to be less than an ion in-ertial length with reports of one or two shocks whose ramp scale was of the order 0.1 c/ωpi(Newbury and Russell, 1996;
Walker et al., 1999).
Correspondence to: S. N. Walker ([email protected])
In contrast, there have been few reports regarding the scale lengths of features observed in the electric field at quasi-perpendicular shocks. The scale size over which the potential varies at the front of a quasi-perpendicular bow shock is an issue that requires resolving in order to gain a full physical understanding of the processes that are occurring. An ex-ample of one such process is the energisation of pickup ions at quasi-perpendicular planetary and cometary bow shocks as well as the termination shock. Several different points of view have been published on the relationship between the scale size of the magnetic ramp and that over which the change in potential is observed. Some studies (Eselevich et al., 1971; Balikhin et al., 1993; Formisano and Torbert, 1982; Formisano, 1982, 1985; Balikhin et al., 2002; Kras-nosel’skikh, 1985; Leroy et al., 1982; Liewer et al., 1991; Scholer et al., 2003) have proposed that the spatial scale of electrostatic potential is of the same order or smaller than that of the magnetic ramp under some conditions. Such shocks have been observed in numerous experimental and numeri-cal studies of quasi-perpendicular supercritinumeri-cal shocks. On the other hand, Scudder (1995) supports the view that the potential scale length is larger than that of the magnetic scale length.
Actual measurements of the electric field variations within the bow shock are very sparse. The main reason for this is due to the difficulties encountered when making electric field measurements. Only a small number of space-based mea-surements of the electric field measured during the passage of a crossing have been reported. Initial results from ISEE (Heppner et al., 1978) reported observations of a short-lived spike in the electric field. However, being short-lived, these features were not observed at every shock crossing. Subse-quent investigations by Wygant et al. (1987) have shown the existence of spike-like features in the electric field, both at the shock ramp and in the region just upstream. From the study of spin averaged ISEE-1 data, Formisano (1982) de-termined that the increase in the observed E-field intensity began just upstream of the magnetic ramp and lasted longer than the ramp crossing itself. Whilst the E-field intensity in
φ |B|
Fig. 1. Sketch of the changes observed in the magnetic field and
electrostatic potential during the crossing of a quasi-perpendicular shock (based upon the experimental results of Eselevich et al. (1971)).
the regions upstream and downstream of the shock could be interpreted as due to the V×B motion of the plasma, the en-hancement observed during the shock crossing must be due to the processes occurring within the shock itself.
Laboratory experiments (Eselevich et al., 1971) have shown that for viscous shocks the change in potential mea-sured across the shock shows the greatest change within the magnetic ramp region. Figure 1 is a sketch (based upon the results of (Eselevich et al., 1971)) of the change in the mag-nitude of the magnetic field and the accompanying change in the electrostatic potential.
Using data generated from numerical simulations, Lemb`ege et al. (1999) analysed the scale size of both the magnetic ramp region and the region in which the change in potential was observed. Their results showed that the scale lengths were of the same order, i.e. LBr≈Lφ. This view is
supported by the simulations of Scholer et al. (2003). The lat-ter authors also show that during the shock reformation pro-cess, the main potential drop occurs over several ion scales in the foot region and the steepened magnetic ramp region also contributes a significant fraction of the change in total poten-tial over much smaller scales, typically 5–10 Debye lengths. From Fig. 1 it can be seen that there are two different length scales that may be associated with the change in the electrostatic potential as the shock is crossed. The first, indi-cated by the lightly shaded bar at the foot of the plot, shows that overall the potential changes on scales similar to that of the magnetic ramp region are in agreement with the results of Lemb`ege et al. (1999). This corresponds to an enhance-ment of the electric field observed as the shock is crossed. The second scale, indicated by the darkly shaded bar, corre-sponds to a region within the shock front in which a large increase in the potential is observed over a short time period. Such changes in the potential result from a large amplitude spike, such as features in the electric field.
This paper reports the results of a study of the large am-plitude, short duration features in the electric field observed
−500 0 500 −600 −400 −200 0 200 400 600 GSE−X GSE−Y −500 0 500 −600 −400 −200 0 200 400 600 GSE−X GSE−Z −500 0 500 −600 −400 −200 0 200 400 600 GSE−Y GSE−Z Cluster separations Max sep: 726.3 Min sep: 522.7
Cluster tetrahedron quality Elongation: 0.1268 Planarity: 0.2309
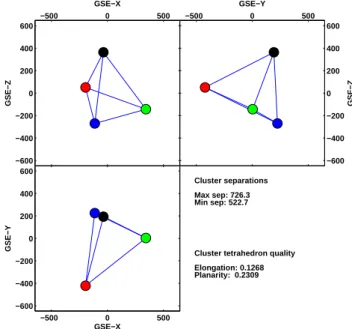
Fig. 2. The configuration of the Cluster tetrahedron as they
en-countered the shock on 31 March 2001 at 17:18 UT. The different satellites are shown using the colour scheme black, red, green, and blue for satellites 1, 2, 3, and 4, respectively. This colour scheme is used throughout this paper when multi-satellite data are plotted.
by the Cluster satellites during a number of crossings of the quasi-perpendicular bow shock. These features contribute significantly to the overall change in potential observed at a shock crossing but their short duration implies that they are very localised. Their scale size amplitudes are determined. These parameters are then studied in relation to the upstream shock parameters. The structure of the rest of this paper is as follows. Section 3 describes the electric field variations for two crossings, one typical, one not. Section 4 investi-gates statistically the relationship between the electric field signatures and various upstream parameters.
2 Data
The data used in this investigation were collected by the Cluster-II satellites as they crossed the terrestrial bow shock during the first half of April, 2001. The electric field mea-surements were made by the Electric Fields and Waves (EFW) instrument (Gustafsson et al., 1997). The EFW in-strument uses two pairs of spherical probes with a probe sep-aration 88m to measure the two components of the electric field that lie in the spin-plane of each of the Cluster satel-lites. These data have then been despun to remove most ar-tifacts due to the spin of the satellites. In the despun coordi-nate system, the Z axis lies along the spin axis of the satellite whilst the X axis lies in the plane containing the spin axis and the sun vector. Since the GSE latitude of the spin vec-tor is ≈−84◦ the despun system is almost coincident with an inverted GSE frame. For the shocks presented here the sampling rate of the data is 25 Hz with a 10 Hz anti-aliasing
S. N. Walker et al.: Electric fields at quasi-perpendicular shocks 2293 17:17:40 17:17:45 17:17:50 17:17:55 −100 −50 0 50 Ey −20 0 20 40 60 80 Ex 0 20 40 60 80 100 |E| 20 40 60 80 100 120 |B|
Cluster shock crossings 31st March 2001
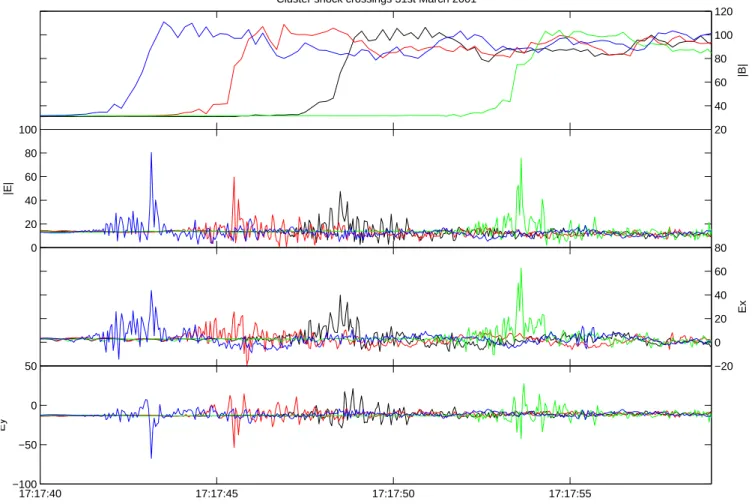
Fig. 3. Overview of the shock crossing on 31 March 2001 at 17:18 UT. The top panel shows the magnitude of the magnetic field measured
by FGM. The second panel shows the magnitude of the electric field measured in the satellites spin plane. The lower two panels show the spin plane components Exand Ey.
filter. It should be noted that whilst the spin component has been removed the data still contains some artifacts that are due to the individual probes passing through the wake of the satellite. These effects show up in the data as peaks in the electric field occurring at a frequency corresponding to twice the spin period. This effect is most prominent in the solar wind. This implies that the estimate of the actual solar wind electric field in the satellite spin plane will be overestimated. Magnetic field data from the fluxgate magnetometer (FGM) (Balogh et al., 1997), have been used to identify the shock regions and therefore, put the electric field observations into context. These data have a sampling frequency of 5Hz. The upstream plasma density was calculated from the plasma line observed in the WHISPER (D´ecr´eau et al., 1997) spectra.
3 Shock crossings
In this section the analysis of two example shocks is de-scribed. A total of 54 shock crossings, occurring on 11 sepa-rate days were investigated but not all could be analysed fully for various reasons, such as unavailability of certain data sets, or the accuracy of the shock normal.
3.1 Shock 1: 31 March 2001, 17:18 UT
The first shock crossing discussed occurred on 31 March 2001 at around 17:18 UT. At this time, the satellites were on the outbound leg of their orbit, at a position (9.4, 1.4, 9.0) RE
GSE and travelling at around 2 kms−1. The satellite tetrahe-dron configuration is shown in Fig. 2 and is fairly regular in nature with an elongation e=0.12 and a planarity p=0.23. It should be noted that on this day the conditions in the solar wind were somewhat abnormal due to the passage of a CME. Measurements in the solar wind by Cluster indicated that the magnitude of the magnetic field was of the order of 30 nT, the normal for this shock (based upon FGM crossing times) is
nB=(0.94, −0.17, 0.293) (in the GSE frame), and the shock
velocity was determined to be 48.92 kms−1. Other relevant parameters are θBn≈87◦and a density n≈19 cm−1. The high
value of the field resulted in an unusually small β≈0.07. The Alfv´en Mach number for this shock (Ma≈3.6) lies close to
the First and Second Critical Mach numbers and therefore the state of the solar wind would lead to favourable condi-tions for the formation of quasi-electrostatic sub-shocks at the shock front (Balikhin et al., 2002). Alfv´enic Mach num-bers are quoted rather than Magnetosonic Mach numnum-bers, as
17:17:46 17:17:48 17:17:50 17:17:52 −40 −20 0 20 40 60 80 100 120 E (mVm −1 ) |B| (nT) C1 − WF C1 31 Mar 2001 0 100 200 300 400 500 600 700 800 Potential
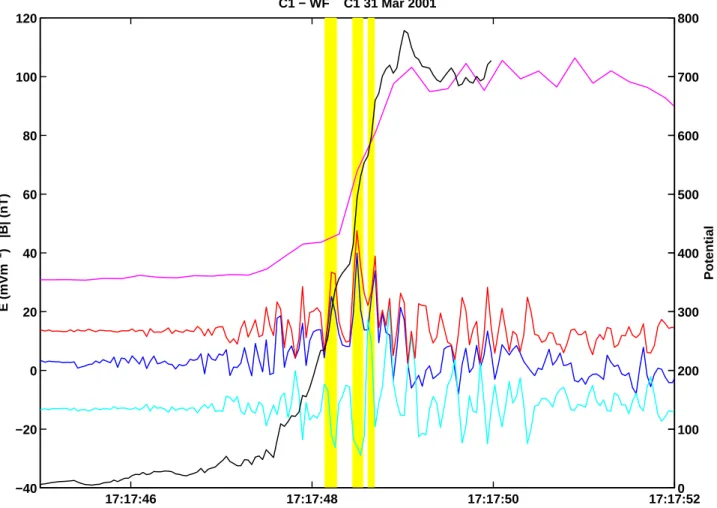
Fig. 4. The FGM magnetic and EFW electric fields measured by Cluster 1 on 31 March 2001 around 17:18 UT. The magnetic field
magnitude is shown by the magenta line. The spin plane electric field magnitude , and Exand Eycomponents are shown in red, blue and
cyan, respectively. The yellow regions highlight the periods when large amplitude short duration spikes in the electric field are observed. The black line (Y scale of RHS) represents the change in potential within the shock.
it is felt that the Alfv´en Mach number was more trustwor-thy. In the plasma regime being considered, the plasma beta is usually small and so the two Mach numbers have similar values. As a result, the Alfv´en Mach number will be a very good approximation to the Magnetosonic Mach number, es-pecially in the current case being considered which, as has already been mentioned, has a very low value of β.
Figure 3 shows an overview of the magnetic and electric field measurements made by FGM and EFW, respectively, during this shock crossing. The top panel shows the mag-nitude of the magnetic field measured by FGM. Initially, all four Cluster spacecraft are in the solar wind just upstream of the outward moving bow shock which subsequently swept over the satellites in the order C4 (17:17:43.5), C2 (17:17:45.5), C1 (17:17:48.5), and finally C3 (17:17:53.5). The magnetic field profiles show a set of clean shock cross-ings that possess clearly discernible foot, ramp and overshoot regions. The second panel shows the magnitude of the elec-tric field measured by EFW in the spin plane of each satel-lite. In the solar wind, the typical magnitude of the electric field is around 14 mVm−1 in the satellite spin plane. It is possible to estimate the Ezcomponent of the upstream
elec-tric field, assuming that E·B=0. This assumption is valid for estimating the field upstream and downstream of the shock but not within the shock region itself. Upstream of the shock, Ez≈5 mVm−1. This value is higher than the
mea-sured Ex component (≈2.5 mVm−1) and less than the Ey
component (−13 mVm−1). Comparing the top two panels it can be seen that the disturbances measured in the electric field begin in the foot region of the shock and continue un-til the satellites are downstream of the overshoot/undershoot. These general disturbances have amplitudes generally in the range 5–30 mVm−1. During their crossings, each of the satellites recorded a number of large amplitude, short du-ration features in the electric field. The largest of these spikes have maximum amplitudes of approximately 30, 40, 60, and 65 mVm−1 for satellites 1, 2, 3, and 4, respectively, above the field measured in the solar wind just upstream of the shock front. These values represent lower limits of the strength of the electric field, since the component perpen-dicular to the spin plane is not considered. They are seen to occur within the ramp region but there is no strong fea-ture within the FGM data with which they correlate. It is also observed that the largest electric field peaks observed
S. N. Walker et al.: Electric fields at quasi-perpendicular shocks 2295 on each satellite appear to occur in pairs which may suggest
field rotation. The two lower panels show the components of the electric field measured in the satellite spin planes. Both panels show that the components of the field exhibit a twin peaked structure, similar to that observed in the field mag-nitude and that the direction of rotation is the same for both peaks. Thus, the overall structure is not due to a single rota-tion of the field. A more in-depth study of the fields is beyond the scope of the current paper and will be dealt with in a fu-ture publication. This report limits itself to a statistical study of the widths of these short-lived, large amplitude features.
Using the four-point measurements it is possible to deter-mine the occurrence time of these peaks in the electric field and hence compute a normal. Examining the Excomponent,
the time differences between the observations of the first peak in the electric field are 1t12=−3.01 s, 1t13=5.03 s, and 1t14=−5.35 s. When coupled with the respective positions of the satellites this yields a normal direction
nE=(0.946, −0.155, 0.283) and a velocity of ≈50 kms−1.
The difference between this normal nEand that determined
from the magnetic field (nB) is less than a degree. Thus,
it appears that the electric field spikes correspond to layers within the overall shock structure.
Figure 4 shows the results from Cluster 1 in greater detail. The magenta line shows the magnitude of the magnetic field. The foot region was entered around 17:17:47.3 UT whilst the ramp was crossed between 17:17:48.3 and 17:17:48.9 UT. Several large spikes in the electric field are observed in the region of the foot and shock ramp. The three largest occur around 17:17:48.2 (20 mVm−1), 17:17:48.5 (30 mVm−1), and 17:17:48.6 (15 mVm−1). Their short duration implies that their scale size is of the order of 3–5c/ωpe. The black
line in Fig. 4 represents an estimation of the electrostatic po-tential measured in the normal direction. This was calculated by removing an average of the field measured in the region just upstream of the shock from the field measured within the shock region and then integrating the projection of this electric field along the normal direction. Whilst the actual potential cannot be calculated due to the incomplete vector measurements, it can be estimated by assuming that the field perpendicular to the spin plane Ez=0. This assumption is
valid because for this particular shock, the normal lies close to the spin plane. This calculation can be used to show that the largest jumps in the potential coincide with the spikes observed in the electric field and that these occurrences con-tribute a significant fraction of the total potential change ob-served at the shock. During this period, the electric field en-hancements contribute around 40% of the total change. 3.2 Shock 2: 5 April 2001, 20:25 UT
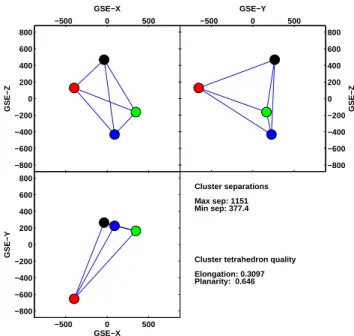
The second shock crossing presented is the one that occurred around 20:25 UT on 5 April 2001. At this time the satellites were moving on an outbound trajectory, situated at a position (14.8, −7.5, −6.7)RE GSE and travelling at ≈1.3 kms−1.
The configuration of the tetrahedron is shown in Fig. 5 and has a variance ellipsoid shaped like a thick pancake
(elon-−500 0 500 −800 −600 −400 −200 0 200 400 600 800 GSE−X GSE−Y −500 0 500 −800 −600 −400 −200 0 200 400 600 800 GSE−X GSE−Z −500 0 500 −800 −600 −400 −200 0 200 400 600 800 GSE−Y GSE−Z Cluster separations Max sep: 1151 Min sep: 377.4
Cluster tetrahedron quality Elongation: 0.3097 Planarity: 0.646
Fig. 5. Configuration of the Cluster tetrahedron during the shock
crossing that occurred on 5 April 2001 at 20:24 UT.
gation factor 0.31, planarity of 0.65). The separation dis-tances of the satellites were between 377 and 1150 km. For this particular shock the normal direction, as determined from the crossing times in the FGM data set, was (0.948,
−0.292, 0.129) in the GSE frame and the shock normal ve-locity −49 kms−1. The upstream density, determined from the electron plasma emissions observed by WHISPER, was 4.8 cm−3. This value was then used to compute the upstream ion and electron inertial lengths c/ωpi ≈103 km and c/ωpe ≈2.4 km respectively. The magnitude of the upstream mag-netic field was determined to be 8.3 nT, θBn≈85◦, β≈0.2,
and Alfv´en Mach number Ma≈6. The upstream electric field
amplitude in the spin plane is ≈1 mVm−1. As in the previ-ous example the Ez component may be estimated assuming
E·B=0. This results in a value Ez≈−3.6 mVm−1which is
substantially larger than both the Ex(−0.9 mVm−1) and Ey
(0.3 mVm−1).
Figure 6 shows an overview of the electric and magnetic fields measured during this shock for all four Cluster space-craft. The top panel shows the magnitude of the magnetic field as measured FGM on each of the four spacecraft with satellite 1 shown in black, 2 in red, 3 green, and 4 blue. At the beginning of the period the quartet was in the magne-tosheath. The magnetic ramp region of the shock was first encountered by Cluster 3 (green) at around 20:25:08 UT, fol-lowed by satellites 4 (blue) and 1 (black) (≈ 20:25:15), and finally satellite 2 (red) at 20:25:17. Upstream of the ramp, the four shock crossings show quite different foot regions. Cluster 4 exhibits a fairly smooth foot region whose mag-netic field is not very different from that observed further up-stream of the shock. Cluster 1 shows a clear foot at the base of the ramp. Satellites 2 and 3 encountered the main ramp region at around 20:25:17 and 20:25:08.8, respectively. On
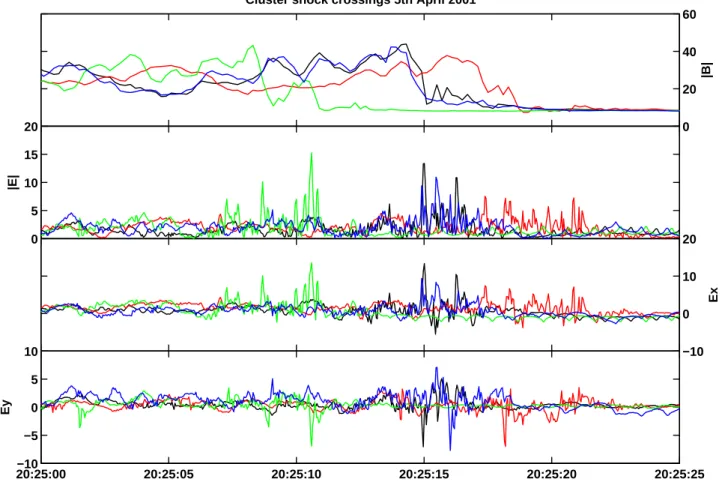
20:25:00−10 20:25:05 20:25:10 20:25:15 20:25:20 20:25:25 −5 0 5 10 Ey −10 0 10 20 Ex 0 5 10 15 20 |E| 0 20 40 60 |B|
Cluster shock crossings 5th April 2001
Fig. 6. Overview of the shock crossings on 5 April 2001 at 20:24 UT. The top panel shows the magnitude of the magnetic field as measured
by FGM. The lower panels show the electric field magnitude and components measured in the spin plane of the satellite.
the upstream side of the ramps the foot region has evolved into a large amplitude nonlinear wave.
During the period when the satellites encountered the shock front all four satellites recorded an enhancement in the electric field. Satellites 1 and 4 show enhanced electric field fluctuation levels throughout the whole shock region from the overshoot/undershoot to the foot, similar to the results presented for the first shock discussed above. In the case of satellite 3, the electrostatic wave activity is limited to the downstream, ramp and nonlinear wave regions of the shock front where as that for satellite 2 appears to continue into the region upstream of the shock.
Within the shock region there are periods in the amplitude where the electric field increases by typically >7 mVm−1for short time of ≈100–300 ms. The largest of these spikes are confined to the ramp and foot regions or the nonlinear wave in the case of satellite 3. This corresponds to a spatial scale for these features of 2–4 c/ωpe.
The lower two panels show the Ex and Ey components
of the electric field measured in the satellite spin plane. The large amplitude features observed in the field magnitude cor-respond to pronounced fluctuations in the components. This is most clearly observed in the Ey component. If the times
corresponding to the major fluctuations in Eyare determined
for the ramp regions in which the largest changes in |B| are
observed, then the resulting normal direction lies along that determined from the FGM data to within a degree.
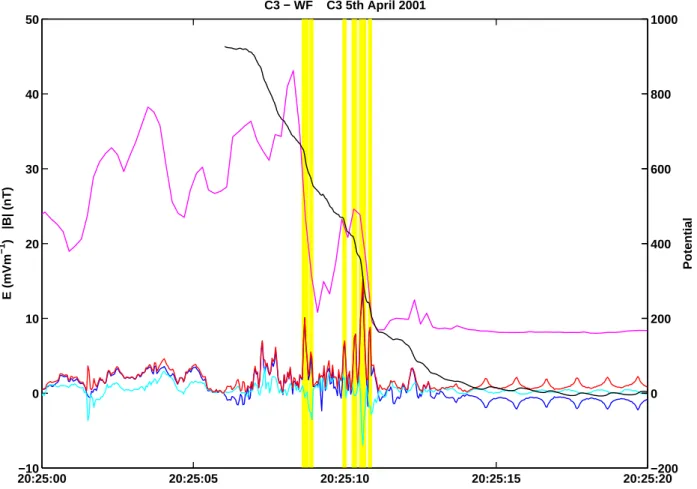
Figure 7 shows the magnitude, and Ex and Ey
compo-nents of the electric field measured by Cluster 3 (red, blue and cyan, respectively), together with the magnitude of the magnetic field (magenta). In the upstream region, the mag-nitude of the electric field is measured in the spin plane of each satellite. The yellow regions highlight the times when the largest electric field spikes are observed. It is clear to see that they occur within the ramp regions. The black line rep-resents an estimation of the shock potential along the shock normal. Since the vector measurements are incomplete, the true potential will be underestimated. However, since the normal direction lies within 10◦of the spin plane it may be assumed that this is a reasonably true estimate of the actual value. During this period, the electric field enhancements contribute around 50% of the total change.
It is clear from Fig. 7 that noise generated by the probes as they pass through the satellite wake is not the cause of the spikes that occur in the electric field, because of their timing. Also, the amplitude increases as the satellite passes from the shock front into the solar wind. A second possible cause of the large amplitudes, namely the convection Vshock×B elec-tric field may also be ruled out since there is no evidence for short period structures within the magnetic field and also
S. N. Walker et al.: Electric fields at quasi-perpendicular shocks 2297 20:25:00 20:25:05 20:25:10 20:25:15 20:25:20 −10 0 10 20 30 40 50 E (mVm −1 ) |B| (nT) C3 − WF C3 5th April 2001 −200 0 200 400 600 800 1000 Potential
Fig. 7. The magnitude (red), and Ex(blue) and Ey(cyan) components of the spin plane electric field measured by Cluster 3 on 5 April 2001
around 20:25 UT. The yellow regions highlight the periods when large amplitude short duration spikes in the electric field are observed. The black line (Y scale of RHS) represents the change in potential within the shock.
the magnitude of such electric fields is smaller than the ob-served amplitudes. Since the shock normal lies very close to the spin plane of the satellite it is possible to make a good estimate of the electric fields in the shock Normal Incidence Frame. After such a transformation, the electric field spikes are still observed, leading to the conclusion that they are a real feature within the shock layer.
4 Results
The preceding sections have presented evidence for localised increases in the electric field strength measured as the satel-lite traverses a quasi-perpendicular bow shock. All shocks analysed show evidence for an enhancement in the back-ground electric field. In most cases, the region in which this field enhancement occurs lasts longer than the crossing of the magnetic ramp. The field typically increases of the order of 1–3 mVm−1above that measured in the solar wind. How-ever, as has been noted above, the turbulence in this region is dominated by spike-like fluctuations lasting a few millisec-onds and with magnitudes of typically 4–20 mVm−1with a maximum magnitude of the order of 70 mVm−1. This ex-istence of large gradients in the electric field has
repercus-sions for processes involved in the heating of electrons. In the presence of electric field gradients the electron gyration frequency can deviate from its classically calculated value, leading to an increase in its Larmor radius and the possibility of a breakdown in adiabaticity (Balikhin et al., 1998).
Having shown that the spikes observed in the electric field at the front of a quasi-perpendicular shock appear to be phys-ical structures that form a layer within the shock front, as op-posed to being the result of noise in the data or motion of the shock, a statistical study of these features was performed to investigate their relationship to the properties of the shock front. In the rest of this section statistics collected from a number of such spike-like features are presented.
4.1 Scale size
Figure 8 shows the distribution of the scale sizes determined from the event duration and the shock velocity of these fea-tures in terms of the electron inertial length. The scale size of these events will be unaffected by the incomplete vector measurements of the electric field. The vast majority have scale sizes of the order of 1–5 c/ωpe. The data that form tail
of the distribution at longer scale sizes typically comprise events that have a multi-peak structure. These type of events
Fig. 8. Histogram of the scale sizes for the spike-like enhancements
observed during a number of crossings of the quasi-perpendicular bow shock. 0 2 4 6 8 10 12 14 0 0.5 1 1.5 Ma Scale (c/ ωpi ) plot(abs([data.ma]), abs([data.s_iil]), ’+’)
Fig. 9. Dependence of scale size on upstream Mach number.
represents an upper limit to the scale size of these short-lived events. In comparison, the typical scale of the magnetic ramp is characterised by the ion inertial length (Newbury and Rus-sell, 1996), although these authors also report one particu-lar shock as having a ramp scale as small as 0.05 c/ωpi or
2 c/ωpe.
Figure 9 shows the relationship between the Mach num-ber and scale size of the spikes observed in the electric field. From the figure, it is clear that the scale size has an upper limit that increases as the Mach number decreases.
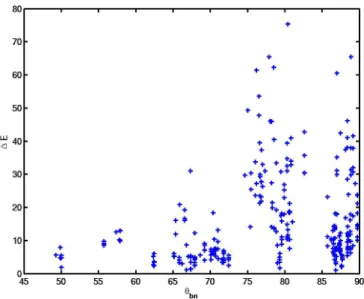
Figure 10 shows a scatter plot of the relationship between
θBnand the scale size of the electric field enhancements. In
general, there appears to be a broad range of scales. How-ever, as θBn → 90◦ the scale length decreases. For the
60 65 70 75 80 85 90 0 0.5 1 1.5 θBn (deg) Scale (c/ ωpi ) plot(abs([data.tbn]),abs([data.s_iil]), ’+’)
Fig. 10. Dependence of scale size on θBn.
Fig. 11. Scatter plot showing the relationship between the
ampli-tude of the electric field spikes as a function of Mach number. The red crosses are used to highlight the data for the shocks that oc-curred on 31 March 2001.
shocks analysed with θBn≈90◦the scale lengths are of the
order of 2 c/ωpe. This compares favourably with theoretical
estimates that for perpendicular shocks the scale width is es-timated to be of the order of the electron inertial length, as proposed by Karpman (1964).
4.2 Amplitude
The examples presented above show that the increase in the electric field (1E=Espike−Eupstream) observed during en-counters with these spike-like structures varies between 4 and 70 mVm−1above the average field that is measured in
S. N. Walker et al.: Electric fields at quasi-perpendicular shocks 2299 the solar wind just upstream of the shock. In this section the
relationship between this change (1E) and the shock Mach number, and the angle θBnis investigated.
Figure 11 shows a scatter plot of the peak amplitude ob-served in the electric field spike event (1E) as a function of the shock Mach number Ma. For shocks whose Mach
number Ma>5 there is a fairly constant trend in which 1E<15 mVm−1. In the Mach number range 3<Ma<5
the range of observed amplitudes varies between 5 and 60 mVm−1. It appears that in this Mach number range the structure of the shocks may differ markedly from those with a higher Mach number. The red crosses highlight the shocks observed on 31 March 2001. All of these shocks fall into this range of Mach numbers. This set of shocks have been shown to possess Mach numbers that lie between the First and Sec-ond Critical Mach numbers. As a result, their structure re-sembles that of viscous electrostatic sub-shocks. Sub-shocks are a class of shocks that occur when the Mach number of the shock lies in the small range between the first and second critical Mach numbers. As a result, resistive processes can-not provide all of the necessary dissipation since the shock Mach number is greater than the first critical Mach num-ber and a reflection shock can not be formed since the shock Mach number is less than the second critical Mach number. The additional dissipation is provided by viscous processes such as the ion sound or other plasma mode. A characteris-tic signature of sub-shocks is the occurrence of small scale electrostatic fluctuations, such as those observed on this par-ticular day. The scale of the electrostatic fluctuations will be determined by the particular plasma mode operating. Ion sound sub-shocks have been observed in laboratory plasmas with scales of ≈100 Debye lengths. For the shocks observed on 31 March 2001, the observed shock scale is closer to to characteristic scale of the fast magnetosonic mode (Balikhin et al., 2002).
The relationship between 1E and θBnis shown in Fig. 12.
It clearly shows that as θBn→90◦the range of the observed
amplitudes of the electric field spikes increases.
5 Conclusions
In this paper we have looked at the changes observed in the electric field during the crossing of a number of quasi-perpendicular bow shock crossings. It has been shown that the electric field is enhanced during the crossing of the shock and that the scale size over which this enhancement is ob-served is larger than that of the magnetic ramp region. Within the shock region, short-lived electrostatic structures are ob-served. The scale size of these structures is of the order of a few c/ωpe and was shown to decrease as θBn → 90◦
which compares favourable with theoretical estimates. The amplitudes of these structures is typically of the order of 5–20 mVm−1but under special circumstances may reach as high as 70 mVm−1. The highest amplitudes appear to be ob-served for shocks whose Mach number is in the range 3 to 5. This may be an indication that such shocks are actually
Fig. 12. The relationship between 1E and θBn.
quasi-electrostatic sub-shocks. It was also demonstrated that these small-scale structures make a substantial contribution to the overall change in potential observed across the shock and that the potential change is not linear.
Acknowledgements. SNW was supported by PPARC grant PPA/G/R/1999/00487. The authors wish to thank Rico Behlke for his comments. The authors also wish to thank the UK Cluster Data Centre for providing access to prime parameter data files that were used for event identification and selection.
Topical Editor T. Pulkkinen thanks M. Gedalin and another referee for their help in evaluating this paper.
References
Balikhin, M., Krasnosel’skikh, V., and Gedalin, M.: New mecha-nism for heating in shocks, Phys. Rev. Lett., 70, 1259, 1993. Balikhin, M., Gedalin, M., and Petrukovich, A.: The scales in
quasiperpendicular shocks, Advances in Space Research, 15, 247, 1995.
Balikhin, M. A., Krasnosel’skikh, V., Woolliscroft, L. J. C., and Gedalin, M.: A study of the dispersion of the electron distribu-tion in the presence of E and B gradients: Applicadistribu-tion to electron heating at quasi-perpendicular shocks, J. Geophys. Res., 103, 2029, 1998.
Balikhin, M. A., Nozdrachev, M., Dunlop, M., Krasnosel’skikh, V., Walker, S. N., Alleyne, H. S. K., Formisano, V., Andr´e, M., Balogh, A., Eriksson, A., and Yearby, K.: Observation of the terrestrial bow shock in quasi-electrostatic sub-shock regime, J. Geophys. Res., 107, 10, 2002.
Balogh, A., Dunlop, M. W., Cowley, S. W. H., Southwood, D. J., Thomlinson, J. G., Glassmeier, K. H., Musmann, G., L¨uhr, H., Buchert, S., Acu˜na, M. H., Fairfield, D. H., Slavin, J. A., Riedler, W., Schwingenschuh, K., and Kivelson, M. G.: The Cluster mag-netic field investigation, Sp. Sci. Rev., 79, 65–91, 1997. D´ecr´eau, P. M. E., Fergeau, D., Kranosels’kikh, V., L´evˆeque, M.,
P., M¨ogensen, P., and Investigators, W.: WHISPER, A Reso-nance Sounder and Wave Analyser: Performances and Perspec-tives for the Cluster Mission, Sp. Sci. Rev., 79, 157–193, 1997. Eselevich, V. G., Eskov, A. G., Kurtmullaev, R. C., and Malyutin,
A. I.: Isomagnetic discontinuity in a collisionless shock wave, Sov. Phys. Jetp, 33, 1120, 1971.
Farris, M. H., Russell, C. T., and Thomsen, M. F.: Magnetic struc-ture of the low beta, quasi-perpendicular shock, J. Geophys. Res., 98, 15 285, 1993.
Formisano, V.: Measurement of the potential drop across the Earth’s collisionless bow shock, Geophys. Res. Lett., 9, 1033, 1982. Formisano, V.: Collisionless shock waves in space and
astrophysi-cal plasmas, in Proc. ESA workshop on future missions in solar, heliospheric and space plasma physics, vol. ESA SP-235, p. 83, 1985.
Formisano, V. and Torbert, R.: Ion acoustic wave forms generated by ion-ion streams at the earth’s bow shock, Geophys. Res. Lett., 9, 207, 1982.
Gustafsson, G., Bostrøm, R., Holback, B., Holmgren, G., Lund-gren, A., Stasiewicz, K., ˚A´ehlen, L., Mozer, F. S., Pankow, D., Harvey, P., Berg, P., Ulrich, R., Pedersen, A., Schmidt, R., But-ler, A., Fransen, A. W. C., Klinge, D., Thomsen, M., Faltham-mar, C.-G., Lindqvist, P.-A., Christenson, S., Holtet, J., Lybekk, B., Sten, T. A., Tanskanen, P., Lappalainen, K., and Wygant, J.: The electric field and wave experiment for the Cluster mission, Sp. Sci. Rev., 79, 137–156, 1997.
Heppner, J. P., Maynard, N. C., and Aggson, T. L.: Early results from ISEE-1 electric field measurements, Sp. Sci. Rev., 22, 777, 1978.
Karpman, V. I.: Structure of the shock front propagating at an angle of the magnetic field in a low density plasma, Sov. Phys. Tech. Phys. Engl. Trans., 8, 715, 1964.
Krasnosel’skikh, V.: Nonlinear motions of a plasma across a mag-netic field, Sov. Phys. Jetp, 62, 282, 1985.
Lemb`ege, B., Walker, S. N., Savoini, P., Balikhin, M. A., and Kras-nosel’skikh, V.: The Spatial Sizes of Electric and Magnetic Field Gradients in a Simulated Shock, Advances in Space Research, 24, 109–112, 1999.
Leroy, M. M., Winske, D., Goodrich, C. C., Wu, C. S., and Pa-padopoulos, K.: The structure of perpendicular bow shocks, J. Geophys. Res., 87, 5081, 1982.
Liewer, P. C., Decyk, V. K., Dawson, J. M., and Lemb`ege, B.: Numerical studies of electron dynamics in oblique quasi-perpendicular collisionless shock waves, J. Geophys. Res., 96, 9455, 1991.
Newbury, J. A. and Russell, C. T.: Observations of a very thin col-lisionless shock, Geophys. Res. Lett., 23, 781, 1996.
Scholer, M., Shinohara, I., and Matsukiyo, S.: Quasi-perpendicular shocks: Length scale of the cross-shock potential, shock ref-ormation, and implication for shock surfing, J. Geophys. Res. (Space Physics), 108(A1), pp. 4–1, 2003.
Scudder, J. D.: A Review of the Physics of Electron Heating at Col-lisionless shocks, Advances in Space Research, 15, 181, 1995. Walker, S. N., Balikhin, M. A., Alleyne, H. S. K., Baumjohann, W.,
and Dunlop, M.: Observations of a Very Thin Shock, Advances in Space Research, 24, 47–50, 1999.
Wygant, J. R., Bensadoun, M., and Mozer, F. S.: Electric field mea-surements at subcritical, oblique bow shock crossings, J. Geo-phys. Res., 92, 11 109, 1987.