HAL Id: hal-00296825
https://hal.archives-ouvertes.fr/hal-00296825
Submitted on 16 Dec 2005
HAL is a multi-disciplinary open access
archive for the deposit and dissemination of
sci-entific research documents, whether they are
pub-lished or not. The documents may come from
teaching and research institutions in France or
abroad, or from public or private research centers.
L’archive ouverte pluridisciplinaire HAL, est
destinée au dépôt et à la diffusion de documents
scientifiques de niveau recherche, publiés ou non,
émanant des établissements d’enseignement et de
recherche français ou étrangers, des laboratoires
publics ou privés.
Evaluation of hydrological models for scenario analyses:
signal-to-noise-ratio between scenario effects and model
uncertainty
H. Bormann
To cite this version:
H. Bormann. Evaluation of hydrological models for scenario analyses: signal-to-noise-ratio between
scenario effects and model uncertainty. Advances in Geosciences, European Geosciences Union, 2005,
5, pp.43-48. �hal-00296825�
SRef-ID: 1680-7359/adgeo/2005-5-43 European Geosciences Union
© 2005 Author(s). This work is licensed under a Creative Commons License.
Advances in
Geosciences
Evaluation of hydrological models for scenario analyses:
signal-to-noise-ratio between scenario effects and model uncertainty
H. Bormann
University of Oldenburg, Department of Biology and Environmental Sciences, Germany
Received: 7 January 2005 – Revised: 1 August 2005 – Accepted: 1 September 2005 – Published: 16 December 2005
Abstract. Many model applications suffer from the fact that
although it is well known that model application implies dif-ferent sources of uncertainty there is no objective criterion to decide whether a model is suitable for a particular application or not. This paper introduces a comparative index between the uncertainty of a model and the change effects of scenario calculations which enables the modeller to objectively de-cide about suitability of a model to be applied in scenario analysis studies. The index is called “signal-to-noise-ratio”, and it is applied for an exemplary scenario study which was performed within the GLOWA-IMPETUS project in Benin. The conceptual UHP model was applied on the upper Ou´em´e basin. Although model calibration and validation were suc-cessful, uncertainties on model parameters and input data could be identified. Applying the “signal-to-noise-ratio” on regional scale subcatchments of the upper Ou´em´e comparing water availability indicators for uncertainty studies and sce-nario analyses the UHP model turned out to be suitable to predict long-term water balances under the present poor data availability and changing environmental conditions in subhu-mid West Africa.
1 Introduction
The background of this study was the assumption that ongo-ing global environmental change has a significant impact on the water cycle of regional scale catchments in many parts of the world. A lot of research projects such as the projects within the GLOWA programme of the German ministry of education and research, BMBF (GLOWA = global change of the water cycle, GLOWA, 2005) investigated the global change impact on regional scale hydrological systems. The GLOWA projects investigate basin scale water related effects of global change in regional river catchments on three conti-nents: Europe, Africa and Near East. The focus thereby lies
Correspondence to: H. Bormann
on the prediction of future changes with respect to hydrolog-ical quantities. The GLOWA-IMPETUS project focuses on the prediction of water availability in Benin (West Africa). Predicting future water fluxes under changing environmen-tal conditions requires the use of hydrological models fed by changing boundary conditions and input data represent-ing climate change, a change of the society and a change of the environment. These changes can be described by a set of realistic scenarios of possible future developments of a re-gion.
To assess the hydrological consequences these changes need to be translated by hydrological models into changes in hydrological quantities (e.g. annual water budget). Due to the limited data availability in developing West African countries models have to be used which are able to calculate the catchment water fluxes right based on poor input data (information on soils, topography, weather, etc.). The catch-ments of interest are poorly gauged basins, and therefore also the model predictions are assumed to be uncertain. If so-phisticated, process based model concepts are used, they can only be parameterised and driven with significant parameter and data uncertainty due to lacking input data. If conceptual models are used, then the simplified model structures may cause a large uncertainty of the model results. Thus the final question arises whether the used model is suitable with re-spect to the aim of the study and the target quantities of the model calculations.
In order to answer this question of model suitability this study looked for an objective index which directly compares the uncertainty caused by data availability and/or model pa-rameters to the calculated effects of the scenarios. This index shall enable an assessment of the suitability of the model con-cept in addition to standard quality measures (e.g. model ef-ficiency according to Nash and Suttcliffe (1970), coefficient of determination, etc.) and standard procedures analysing “only” the model uncertainty (e.g. Monte-Carlo simulations, GLUE-method after Beven and Binley, 1992).
44 H. Bormann: Evaluation of hydrological models for scenario analyses
$
Z
$
Z
$
Z
$
Z
$
Z
$
Z
$
Z
$
Z
$
Z
$
Z
# # # # # # # # # # # # # # # # # # # # # # # # # # # # # # # # # # # # # # # # # # # # # # # # # # # # # # # # # # # # # # # # # # # # # # # # # # # # # # # # # # # 50 0 50 KilometersN
Upper Ouémé
catchment
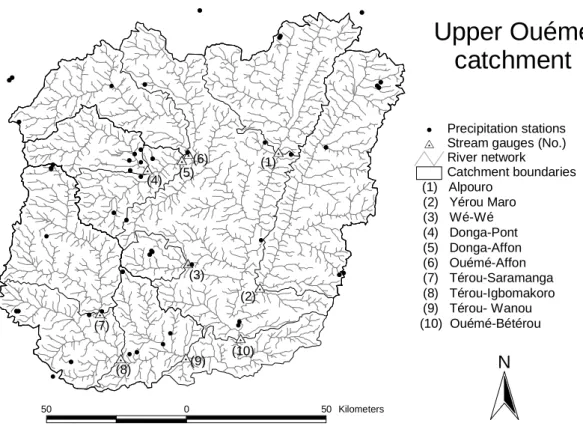
(10) Ouémé-Bétérou (9) Térou- Wanou (8) Térou-Igbomakoro (7) Térou-Saramanga (6) Ouémé-Affon (5) Donga-Affon (4) Donga-Pont (3) Wé-Wé (2) Yérou Maro (1) Alpouro Catchment boundaries River network $Z Stream gauges (No.)
# Precipitation stations (1) (6) (5) (10) (9) (8) (7) (3) (4) (2)
Fig. 1. Subcatchments, drainage network and stream gauges in the upper Ou´em´e catchment (central Benin).
2 Signal-to-noise-ratio
In general within case studies, scenario calculations and model uncertainty are discussed and evaluated separately. However the model used for scenario calculations is not free from uncertainties, and therefore a direct relation between both quantifications is necessary. If the uncertainty analysis of a model reveals a high uncertainty, then also calculated scenario effects may be caused by model artefacts. And if a model reveals almost no uncertainty in a particular case then also small scenario effects can be reliable and significant.
Based on the fact that the evaluation of the uncertainty of a model is often a result of an individual and subjective rat-ing, a ratio between uncertainty and scenario effects is pro-posed here which directly and objectively links both, quan-tification of model uncertainty and scenario effects. It en-ables the comparison of total model uncertainty to the effects of integrative scenarios (combination of different changing influencing factors) as well as the comparison of particular uncertainty sources to the effects of single parts of scenarios. The “signal-to-noise-ratio” (SNR) is defined by Eq. (1) for measurable values: SN R = |Xreference−Xscenario| Xreference 1 n n P i=1 |Xobserved−Xi,uncertain| Xobserved −1 (1)
Where SNR = signal-to-noise ratio, Xreference= value of the
reference scenario, Xscenario= value of the scenario, Xobserved
= observed value, Xi,uncertain = value of the n realisations of
the uncertainty analysis, i = control variable.
Values can be water balance terms and state indicators. As only measurable indicators can be selected for calcula-tion of SNR following Eq. (1), and measurable indicators are often scarce in regional scale poorly gauged basins (e.g. annual stream flow volume), a second signal-to-noise-index called SNRrefis defined by Eq. (2) where the observed values
in the denominator of Eq. (1) are replaced by the values of the reference simulation. Using this index SNRref, also
non-measurable values can be used for comparison of model un-certainty and scenario effects (e.g. regional scale actual evap-otranspiration, regional scale soil moisture deficit):
SN Rref= |Xreference−Xscenario| Xreference 1 n n P i=1 |Xreference−Xi,uncertain| Xreference −1 (2)
SNR and SNRref indices should be interpreted as follows:
positive SNR values indicate that scenario effects are larger than model uncertainty effects. Values lager than 1 (scenario effect at least doubles model uncertainty) are called high SNR values and demonstrate a sufficient suitability of a model for a given case study. Negative SNR values imply that a model is not suitable for scenario analysis in the particular case.
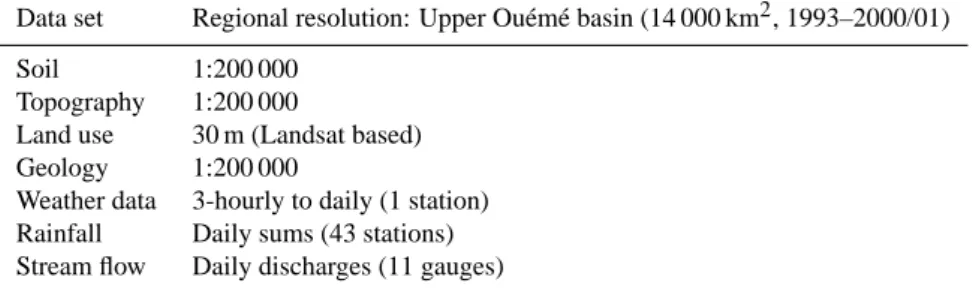
Table 1. Regional scale data availability in Benin: time series (weather and stream flow data) and spatial information (Soil and geological
map, vegetation classification, topographic map).
Data set Regional resolution: Upper Ou´em´e basin (14 000 km2, 1993–2000/01)
Soil 1:200 000
Topography 1:200 000
Land use 30 m (Landsat based)
Geology 1:200 000
Weather data 3-hourly to daily (1 station)
Rainfall Daily sums (43 stations)
Stream flow Daily discharges (11 gauges)
3 Exemplary study – UHP model application in Benin
This study is being performed on the upper Ou´em´e basin in central Benin. The upper Ou´em´e basin (Fig. 1) has a size of approx. 14 000 km2and shows a subhumid climate charac-terized by a unimodal rainy season. The mean annual pre-cipitation amount is about 1100 mm/a, falling between April and October. The vegetation cover mainly consists of tree sa-vannah whereas especially in the northern part sasa-vannah veg-etation is replaced by agricultural land. Crusted and lateritic soils are characteristic for the region, causing a significant portion of lateral flow components, surface runoff and inter-flow. Groundwater recharge only takes places locally where preferential flow paths exist.
For regional model application only regionally available data can be used. The data availability in the upper Ou´em´e basin is presented by Table 1. Although the data availability is above-average for West African conditions and all general data sets are available, they do not suffice for process based hydrological modelling. For example soil data do not include spatially distributed soil textures or soil physical parameters, and rainfall data are resolved only in daily resolution, rain-fall intensities are almost not available. Therefore a concep-tual and lumped model concept (UHP model) has been se-lected to reproduce the long-term water fluxes and the wa-ter balance of the upper Ou´em´e region. The UHP model is based on four storages representing interception, root zone, soil and groundwater storages. The main process descrip-tions are given by Bormann and Diekkr¨uger (2004).
Calibration of the UHP model was performed manually for the T´erou subcatchment (3133 km2, gauge (9) in Fig. 1) for the 1993–1999 time period by maximising the model ef-ficiency according to Nash and Suttcliffe (1970). Besides model efficiency the quality assessment focused on the long-term water balance, on the coefficient of delong-termination and on the recession curve in the end of the rainy season. For the calibration period model efficiency was 0.75 for weekly stream flow, r2was 0.82 and the difference of the long-term stream flow concerning cumulative stream flow was smaller than 1% (0.1%).
The validation of the UHP model was firstly realised by a split sample test of the data available for the T´erou river. For the validation period (year 2000) the same simulation quality
was observed (model efficiency=0.76). Secondly the UHP model was applied on 6 neighboured regional scale subcatch-ments within the upper Ou´em´e (580 to 10 300 km2)without a recalibration (years 1997/1998–2000). The quality assess-ment of the validation procedure revealed comparable model efficiencies compared to the calibration period and water bal-ance deviations below ±10% which was defined to be ac-ceptable. Details on the quality measures of calibration and validation procedure for the different catchments are given by Bormann and Diekkr¨uger (2004).
Simulation results for the entire upper Ou´em´e basin (sum of gauges T´erou-Wanou and Ou´em´e-B´et´erou) which repre-sents the target scale of the IMPETUS project are shown in Fig. 2. Quality measures of this simulation are a model effi-ciency of 0.74, an r2of 0.84 (with y=1.105∗x) and a devia-tion between measured and simulated water balance of 5.3%.
4 Model applications – uncertainties and scenarios
The aim of the hydrological investigations in Benin was the calculation of environmental change scenarios to assess pos-sible changes in the future water availability of the upper Ou´em´e basin. To evaluate the predictions for possible future developments a detailed analysis of the model performance in addition to “classical” model validation is required. The most important uncertainty sources identified for the upper Ou´em´e basin are model parameter and input data uncertainty. Bormann and Diekkr¨uger (2003) tried to quantify the uncer-tainty of the model concept. They came to the conclusion that process based regional scale hydrological models cannot be applied in the target basin due to data constraints while the application of the conceptual UHP model only leads to small deviations between simulated and observed stream flow. In contrast on local scale process based models can be success-fully applied if additional data on the catchment properties are available (Bormann et al., 2005; Giertz, 2004).
Dominant uncertainties in the upper Ou´em´e basin are in-formation on rainfall distribution (in time and space) and soil properties. Precipitation shows a very high spatial and temporal variability due to different, partly small scale rain-fall generation mechanisms (e.g. squall lines, local thunder storms, monsoonal rainfall). This high rainfall variability cannot be detected exhaustively by the existing, limited rain
46 H. Bormann: Evaluation of hydrological models for scenario analyses 15 0 100 200 300 400 500 600 700 800
Jan. 97 Jul. 97 Jan. 98 Jul. 98 Jan. 99 Jul. 99 Jan. 00 Jul. 00
time (month. year)
s tr e a m fl o w [m ³/ a ] observed simulated
Figure 2. Simulation results of the upper Ouémé river (14.000 km², result of superposition of the observed and simulated hydrographs of the stream gauges Ouémé-Bétérou and Térou-Wanou).
Formatierung der Abbildungen in etwa wie in der formatierten Version: Fig 1: über die Breite der ganzen Seite (ca. 15,5 X 11,5cm)
Fig 2: über die Breite der ganzen Seite (ca. 15,3x7,6cm)
Fig. 2. Simulation results of the upper Ou´em´e river (14 000 km2, result of superposition of the observed and simulated hydrographs of the stream gauges Ou´em´e-B´et´erou and T´erou-Wanou).
gauge network (43 rain gauges on 14 000 km2), whereas the rain gauge network underlies frequent malfunctions. The in-vestigation of a decreasing number of rainfall data on the simulation results revealed an increasing uncertainty on dis-charge volume with decreasing number of rainfall stations. Using the in average available density of rain gauges implied an uncertainty of about 10% with regard to annual stream flow. Furthermore the method how to derive catchment rain-fall from point station data was investigated. Different meth-ods were applied and compared (e.g. Thiessen polygons, arithmetic mean). While significant effects on single runoff events could be identified the effect on annual stream flow and therefore also on the long-term water balance was rel-atively small (about 5%). The analysis of model parameter uncertainty focused on the parameters representing the soil properties (e.g. soil water storage capacity, curve numbers, initial abstraction). The Monte-Carlo-method based investi-gation revealed a parameter uncertainty comparable in quan-tity to uncertainty of rainfall input into the model. The ef-fect on annual stream flow was about 9%. Details on the un-certainty analysis are presented by Bormann and Diekkr¨uger (2004).
Based on regional to global scale future predictions of the Intergovernmental Panel on Climate Change (IPCC, 2001) on climate change and based on local to regional scale in-vestigations on soil degradation in the upper Ou´em´e region (Junge, 2004), a set of scenarios was defined. For the time scale of 2020 scenarios of rainfall decrease and soil degra-dation and of a combination of both effects were described and calculated (Bormann, 2005). Three scenarios only fo-cusing on one changing factor and one scenario combining two factors are:
– “rain-1”: This scenario shows a decrease in rainfall by
10%, whereas each rainfall event is reduced by 10%. This scenario implies decreasing rainfall intensities and a constant duration of the rainy season.
– “rain-2”: This scenario is characterised by a decrease
of rainfall by 10%, whereas the rainfall amounts of the events stay constant, but the rainy season is shortened by the last 10%. This scenario implies a shorter rainy season but constant rainfall intensities.
– “degradation”: This scenario describes the degradation
of the land surface by intensification and increase of agriculturally used areas and therefore intensified ero-sion (decrease of soil storage, increase of curve number, decrease of leaf area index).
– “Combination scenario”: This scenario summarises the
changes assumed by scenario “rain-2” and “degrada-tion”. Observations show that “rain-2” is more likely than “rain-1”, and therefore “rain-2” is combined with a land degradation scenario assuming an ongoing busi-ness as usual with respect to the extension of agricul-tural area, cutting down of tropical wood and the ensu-ing soil erosion.
Details on derivation and definition of the environmental sce-narios with respect to changes in single components as well as in combinations are presented by Bormann (2005).
To evaluate the simulation results the definition of state indicators is necessary. These indicators are needed to as-sess the severity of changes in an objective manner. They of course should show significance with respect to the main target of the study (water availability in the upper Ou´em´e basin). Furthermore – if possible – they should be measur-able to be measur-able to set the scenario effects in relation to quan-tifiable uncertainty components. In this study the following indicators were used:
– Annual / long-term stream flow volume (indicator for
changes in the water balance).
– Annual ETA (indicator for changes in water balance and
plant productivity, but difficult to observe at regional scale).
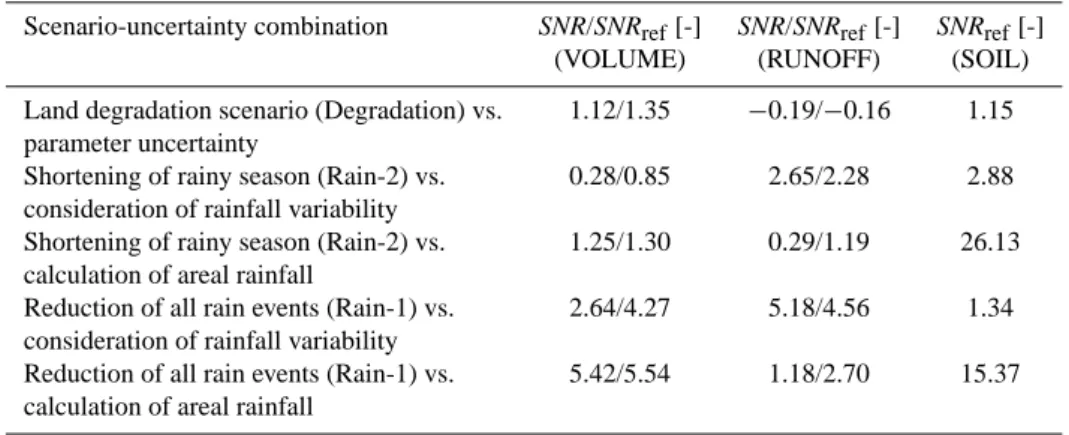
Table 2. Signal-to-noise-ratios for three different target quantities (VOLUME = annual stream flow volumes, RUNOFF = number of days
per year with stream flow >10 m3/s, SOIL = number of days per year with soil water storage >40%).
Scenario-uncertainty combination SNR/SNRref[-] SNR/SNRref[-] SNRref[-]
(VOLUME) (RUNOFF) (SOIL)
Land degradation scenario (Degradation) vs. 1.12/1.35 −0.19/−0.16 1.15
parameter uncertainty
Shortening of rainy season (Rain-2) vs. 0.28/0.85 2.65/2.28 2.88
consideration of rainfall variability
Shortening of rainy season (Rain-2) vs. 1.25/1.30 0.29/1.19 26.13
calculation of areal rainfall
Reduction of all rain events (Rain-1) vs. 2.64/4.27 5.18/4.56 1.34
consideration of rainfall variability
Reduction of all rain events (Rain-1) vs. 5.42/5.54 1.18/2.70 15.37
calculation of areal rainfall
– Annual number of days with stream flow (indicator for
water availability in the rivers, but error-prone indicator in the subhumid tropics due to measurement errors, e.g. if water stands in the river bed but is not flowing); alter-natively: days with stream flow exceeding a threshold (e.g. 1 m3/s or 5 m3/s).
– Days with soil moisture exceeding a threshold
concern-ing the charge of the soil water storage (indicator for length of growing season; can be observed at point scale, but difficult to measure at regional scale). Hydrological effects of these scenarios were calculated for three subcatchments of the upper Ou´em´e river: T´erou-Wanou (3133 km2), Ou´em´e-Affon (1165 km2)and Donga-Affon (1329 km2). Simulated results on changing hydrolog-ical processes were comparable for the three catchments. A decrease in rainfall input (scenarios rain-1 / rain-2) leads to decreasing evapotranspiration (−4.4%/−8.7%), decreasing stream flow (−35.3%/−12.4%) and decreasing plant avail-able water (−10 days/−18 days above a threshold on soil water content), whereas the land surface degradation leads to an increase in stream flow (+19.5%). The combination sce-nario leads to an increasing stream flow (+7.3%), a decrease in evapotranspiration (−11.1%) and a dramatic decrease in soil available water (−6 to −7 weeks over a threshold on soil water content). For details on the results of the scenarios on the catchment hydrology see Bormann (2005).
5 Application of the signal-to-noise-ratio to the T´erou basin
The application of the “signal-to-noise-ratio” indices (SNR and SN Rref)on the three following water availability
indica-tors
1. long-term stream flow volume,
2. number of days per year when stream flow exceeds 10 m3/s and
3. number of days per year when root zone water storage exceeds 40% of storage capacity
for the T´erou catchment in central Benin reveals following results for the UHP model which are summarised in Table 2. In general – according the SNR indices defined – the UHP model is suitable to be used for the calculation of environ-mental change scenarios in central Benin. All water avail-ability indicators are meaningful with regard to questions of water availability. Except one case (comparison of the degra-dation scenario vs. model parameter uncertainty for the num-ber of stream flow days) all SNR indices are positive, and except three cases the indices exceed the value 1 and there-fore are called high SNR values indicating a sufficient model suitability.
The application of the SNRref index mostly leads to
slightly increased values compared to SNR which is caused by the increase of model uncertainty in case of comparison to measurements instead of the reference simulation. If the ref-erence simulation is used particular uncertainty sources are not regarded (e.g. measurement errors) or slightly underes-timated. But the differences between SNR and SNRref are
small. Thus also (on the catchment scale) non-measurable water availability indicators such as the “length of the time period with sufficient available water in the root zone” can be used as indicator.
The two different rainfall scenarios lead to different SNR indices caused by different scenario effects. But the two scenarios also have different probabilities as meteorologists rather expect a shorter rainy season instead of decreasing rainfall intensities in the subhumid tropics of West Africa. This fact needs to be considered for the rating of SNR results (Table 2)
Finally, attention should be drawn on the fact that the sce-narios which underlie case studies such as this investigation must be as realistic and plausible as possible. Applying in-dices comparable to SNR defined in this paper may lead to the temptation to alter scenarios in a way producing high SNR values instead of spending intensive work in reducing model uncertainty by improving the model concept or the input data
48 H. Bormann: Evaluation of hydrological models for scenario analyses quality. This – of course – would be absolutely undesirable
and would disqualify the approach to provide a subjective indicator for model suitability.
6 Conclusions
An index called signal-to-noise-ratio has been presented which can be used for objective evaluation of model suit-ability for scenario analysis depending on the detected un-certainty related to a particular case study. A high index in-dicates a large signal (scenario effect) compared to the noise (relatively small uncertainty). Thus in addition to partly sub-jective assessment of results of uncertainty analyses an ob-jective index is now available. It requires the use of spe-cific indicators (depending on the aim of the study, e.g. water availability indicators for the GLOWA-IMPETUS project) and an objective function to evaluate models for a particu-lar application. Guaranteeing a careful definition of scenar-ios the model evaluation can be done based on an intensive analysis of model uncertainty.
With regard to the case study presented in this paper, the conceptual UHP model used is suitable for calculation of sce-nario effects in central Benin based on a poor data base. Only one of 15 SNR values is negative indicating a low suitability, 14 of 15 values are positive and 12 of 15 indicators indi-cate a sufficient suitability. These results support the suc-cessful validation of the UHP model for the upper Ou´em´e valley and the suitability of the conceptual model for sce-nario analysis under the assumption that scesce-narios are based on well-founded investigations and are defined in a realistic and plausible manner.
Acknowledgements. The authors thank the BMBF for funding the
IMPETUS project (grant No. 07 GWK 02), the organisers of the Jena-Workshop on “Großskalige hydrologische Modellierung in der Hydrologie” for the excellent organisation of the workshop and the referees for improving this paper.
Edited by: P. Krause, K. Bongartz, and W.-A. Fl¨ugel Reviewed by: anonymous referees
References
Beven, K. J. and Biley, A. M.: The future of distributed models – model calibration and uncertainty prediction, Hydrological Pro-cesses, 6 (3), 279–298, 1992.
Bormann, H.: Regional hydrological modelling in Benin (West Africa): Uncertainty issues versus scenarios of expected future environmental change, Phys. Chem. Earth, 30 (8–10), 472–484, 2005.
Bormann, H. and Diekkr¨uger, B.: A conceptual hydrological model for Benin (West Africa): Validation, uncertainty assessment and assessment of applicability for environmental change analyses, Phys. Chem. Earth, 29 (11–12), 759–768, 2004.
Bormann, H. and Diekkr¨uger, B.: Possibilities and limitations of regional hydrological models applied within an environmental change study in Benin (West Africa), Phys. Chem. Earth, 28 (33– 36), 1323–1332, 2003.
Bormann, H., Giertz, S., and Diekkr¨uger, B.: Hydrological catch-ment models between process representation, data availability and applicability for water management – case study for Benin, IAHS Publication 295, 86–93, 2005.
Giertz, S.: Analyse der hydrologischen Prozesse in den
sub-humiden Tropen Westafrikas unter besonderer Ber¨ucksichtigung der Landnutzung am Beispiel des Aguima-Einzugsgebietes in Benin, Dissertation, Math.-Nat.-Fakult¨at, Universit¨at Bonn, 249 p. (in German), 2004.
IPCC: Climate change 2001: The scientific basis, Contribution of the working group I to the third assessment report of the intergov-ernmental panel on climate change, Cambridge, 882 p., 2001.
Junge, B.: Die B¨oden des oberen Ou´em´e-Einzugsgebietes in
Benin/Westafrika – Pedologie, Klassifizierung, Nutzung und De-gradierung. Dissertation, Landwirtschaftliche Fakult¨at, Univer-sit¨at Bonn, 291 p. (in German), 2004.
GLOWA: Homepage of the GLOWA-programme of the BMBF, www.glowa.org (date of access: 22.4.2005), 2005.
Nash, J. E. and Sutcliffe, J. V.: River flow forecasting trough con-ceptual models, part I – a discussion of principles, J. Hydrol., 10, 272–290, 1970.