HAL Id: hal-00317074
https://hal.archives-ouvertes.fr/hal-00317074
Submitted on 1 Jan 2002
HAL is a multi-disciplinary open access
archive for the deposit and dissemination of
sci-entific research documents, whether they are
pub-lished or not. The documents may come from
teaching and research institutions in France or
abroad, or from public or private research centers.
L’archive ouverte pluridisciplinaire HAL, est
destinée au dépôt et à la diffusion de documents
scientifiques de niveau recherche, publiés ou non,
émanant des établissements d’enseignement et de
recherche français ou étrangers, des laboratoires
publics ou privés.
Neural network prediction of relativistic electrons at
geosynchronous orbit during the storm recovery phase:
effects of recurring substorms
M. Fukata, S. Taguchi, T. Okuzawa, T. Obara
To cite this version:
M. Fukata, S. Taguchi, T. Okuzawa, T. Obara. Neural network prediction of relativistic electrons
at geosynchronous orbit during the storm recovery phase: effects of recurring substorms. Annales
Geophysicae, European Geosciences Union, 2002, 20 (7), pp.947-951. �hal-00317074�
Annales
Geophysicae
Neural network prediction of relativistic electrons at
geosynchronous orbit during the storm recovery phase:
effects of recurring substorms
M. Fukata1, S. Taguchi1, T. Okuzawa1, and T. Obara2
1Dept. of Information and Communication Engineering, University of Electro-Communications, Chofu, 182-8585, Japan 2Communications Research Laboratory, Koganei, 184-8795, Japan
Received: 1 October 2001 – Revised: 5 March 2002 – Accepted: 30 April 2002
Abstract. During the recovery phase of geomagnetic storms,
the flux of relativistic (>2 MeV) electrons at geosynchronous orbits is enhanced. This enhancement reaches a level that can cause devastating damage to instruments on satellites. To predict these temporal variations, we have developed neural network models that predict the flux for the period 1–12 h ahead. The electron-flux data obtained during storms, from the Space Environment Monitor on board a Geostationary Meteorological Satellite, were used to construct the model. Various combinations of the input parameters AL, 6AL, Dst and 6Dst were tested (where 6 denotes the
summa-tion from the time of the minimum Dst). It was found that
the model, including 6AL as one of the input parameters, can provide some measure of relativistic electron-flux pre-diction at geosynchronous orbit during the recovery phase. We suggest from this result that the relativistic electron-flux enhancement during the recovery phase is associated with re-curring substorms after Dstminimum and their accumulation
effect.
Key words. Magnetospheric physics (energetic particles,
trapped; magnetospheric configuration and dynamics; storms and substorms)
1 Introduction
During the recovery phase of geomagnetic storms, the flux of relativistic (>2 MeV) electrons at geostationary orbits (GEO) is enhanced. This enhancement often reaches a level that is higher than the prestorm value (e.g. Nagai, 1988; Baker et al., 1997; Obara et al., 2000a). This enhancement is not accounted for by the flux of energetic electrons in the interplanetary medium alone (Li et al., 1997). This implies that some energization or transportation process operates on the energetic electrons in the magnetosphere. Although the
Correspondence to: S. Taguchi (taguchi@ice.uec.ac.jp)
mechanism for this process has been suggested by several re-searchers (e.g. Freeman et al., 1998; Nakamura et al., 1998; Obara et al., 2000b), there is still considerable uncertainty about the details.
High flux levels of relativistic electrons can cause irrepara-ble damage to the instruments on satellites (Gussenhoven et al., 1991; Baker et al., 1997), and this practical consequence of the flux enhancement has promoted the development of empirical models. Nagai (1988) designed a linear prediction filter for the prediction of daily averages of electron flux at GEO, using the Kpindex as an input. This model predicted
successfully the electron flux on a daily scale. Koons and Gorney (1991) also made predictions of the daily average flux at GEO using artificial neural networks (ANN).
Modeling using ANN has predicted successfully the energetic-electron flux with a time resolution of 1 h (Stringer et al., 1996; Freeman et al., 1998). Although the energy range of the electrons for these two models is different (3– 5 MeV for Stringer et al., 1996 and 100 keV to 1.5 MeV for Freeman et al., 1998), both models used the Dst index,
and the electron flux as input data. Stringer et al. (1996) used the current flux of energetic electrons (3–5 MeV), and those which existed 1 to 3 h earlier. Freeman et al. (1998) used the current low-energy (35 keV) electron flux, plus those existing 15 min and 75 min earlier, to predict the en-ergetic (100 keV to 1.5 MeV) electron flux for the storm of 3–4 November 1993. It would appear that the high perfor-mance of these models is due to the inclusion of the varia-tion of electrons existing earlier as data. Since the use of the model has important practical applications, it not only needs to help us understand the physical mechanism, but also must use widely available input parameters. In this paper, we show ANN modelling of the relativistic-electron flux for the recov-ery phase is possible using 6AL (the summation of AL from the time of Dst minimum in the main phase), and we suggest
the significance of recurring substorms in the flux enhance-ment.
948 M. Fukata et al.: Neural network prediction of relativistic electrons
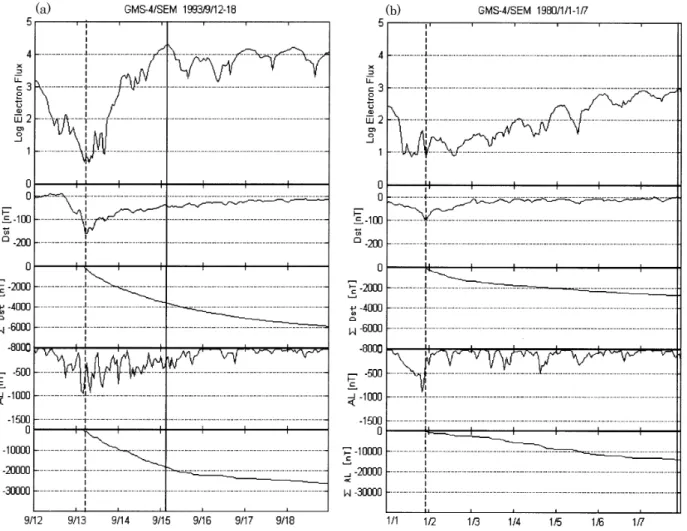
Fig. 1. Examples of enhancements of relativistic (>2 MeV) electron flux observed by Geostationary Meteorological Satellite and Dst/AL
indices (a) for the the storm of 12–18 September 1993, and (b) for the storm of 1–7 January 1980. 6Dst and 6AL are also plotted, where
6denotes the summation from the time of the minimum Dst. The minimum Dstis represented with a dashed vertical line, and a solid line
represents the time for the peak electron flux for the six-day period after the Dst minimum.
2 AL index as model input
We used data for relativistic (>2 MeV) electrons that were obtained from the Space Environment Monitor of Geosta-tionary Meteorological Satellite (GMS), located at about 140◦E. From the GSM data between August 1978 and
Au-gust 1998, we selected 29 storm events, by examining the Dstindex variations. Figure 1 shows two examples from the
29 storms, where the logarithms of electron flux, Dst 6Dst
AL, and 6AL are plotted from top to bottom, respectively. For the AL and 6AL, we used the hourly average AL index. Figure 1a shows that the electron flux reaches a maximum of more than 104count cm−2sec−1sr−1MeV−1about 2 days after the Dst minimum. In Fig. 1b, the electron flux about
2 days after the Dstminimum is still low. When we compare
Dst, 6Dst AL, and 6AL in the region of the flux maximum
for Fig. 1a with those for Fig. 1b, it is evident that there is a significant difference. In Fig. 1b, AL does not exceed 500 nT after the Dstminimum, whereas for Fig. 1a, such large values
of AL occur several times. Consequently, the magnitude of
6ALbetween the two sets of conditions is rather different: in Fig. 1a, the magnitude of 6AL about 2 days after the Dst
minimum (at the solid vertical line) is more than three times as large as its magnitude at the same time in Fig. 1b. These facts suggest that AL and 6AL serve as proxies for factors that influence the peak electron flux.
For each storm event, we examined the peak electron flux for the six-day period after the Dst minimum, and the
corre-sponding magnitude of 6AL. Figure 2 shows scatter plots of the electron flux (logarithmic scale) against the magnitude of 6AL, for all 29 storm cases. Although log flux values greater than 4 occur for a wide range of |6AL| (from 18 000 to 43 000), the electron flux tends to be large with increas-ing |6AL|. The correlation coefficient (CC) is calculated to be 0.64. This rough correlation supports the proposition that 6ALmay be a measure of the control factors in determin-ing the peak electron flux. We also checked if 6Dst shows
a similar correlation, but a clear relation was not identified (CC = 0.11).
Fig. 2. Scatter plots of the peak electron flux versus the absolute
value of 6AL for all 29 events. The solid line indicates the least-squares fit.
3 ANN model construction and performance
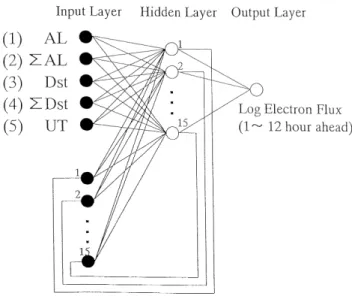
In order to construct an ANN model for the relativistic elec-tron flux, we adopted AL, 6AL, Dst 6Dst, and UT (=
LT−9 h for GMS) as input parameters. The Dst index is
known to be one of the important parameters that determines the maximum electron flux (e.g. Reeves, 1998). The impor-tance of the history of Dst has been suggested by Stringer
et al. (1996), and Freeman et al. (1998), although simple comparison between 6Dst and the peak electron flux does
not necessarily identify a clear relation between them. UT is used in the form of sin(UT/24), in order to reproduce a daily variation (or LT dependent structure) of the flux. The recent history of the five parameters was fed to the model. We used an Elman ANN, which is known as a two-layer back-propagation network with feedback connections from the hidden layer to the input layer (Elman, 1990; Wu and Lundstedt, 1997; Kugblenu et al., 2001). The hidden layer has the context neurons, as well as the true input neurons, and the context neurons act as an integrator of temporal in-formation dating back to its initial state; i.e. this gives the network a nonlinear memory capacity.
For the data set for the network training, we selected nine of the 29 storm events in such a manner that the training data set could have various types of flux variations. The nine events consisted of storms on 28 August 1978, 1 Jan-uary 1980, 6 FebrJan-uary 1980, 3 November 1985, 29 Novem-ber 1985, 4 June 1993, 4 NovemNovem-ber 1993, 4 April 1994, and 17 April 1994. A total of 1043 h from these nine events was used for the training. As the learning parameters for train-ing, we chose an RMS error goal of 0.01, an initial adaptive learning ratio of 0.001, an increasing rate-of-learning ratio of 1.05, a decreasing rate-of-learning ratio of 0.7, a momen-tum constant of 0.95, an error ratio of 1.04, and used 5000 learning cycles.
First, we constructed the model for one-hour forward pre-diction. The performance of the model was then evaluated by comparing the predictions with the observations for the
Fig. 3. Architecture of the optimized Elman neural network.
Fig. 4. The storm of 5–9 Oct 1985 for which the best predictability
was obtained. The solid and dashed curves represent the observa-tion and one-hour forward predicobserva-tion, respectively.
remaining 20 storm events (2146 h). It was found that the op-timized ANN had the design shown in Fig. 3, i.e. the number of hidden neurons was 15. This ANN model produced both the highest average value of CC (between the predicted and observed variations), and the highest prediction efficiency (PE) for the 20 test cases. The averages values for CC and PE were 0.84 and 0.71, respectively. The average of the RMS error was 0.47. Figure 4 shows a storm for which this ANN model produced the highest CC (0.97) and PE (0.86) of all the 20 cases. The prediction (dashed curve) follows the ob-servation (solid curve) reasonably well, although the model does not capture the steepness of the rise in flux on 5 October. We also made some other training data sets by adding sev-eral storms to the nine events, and checked the ANN model’s performance. The increase in the number of the training data sets did not necessarily improve the prediction performance
950 M. Fukata et al.: Neural network prediction of relativistic electrons
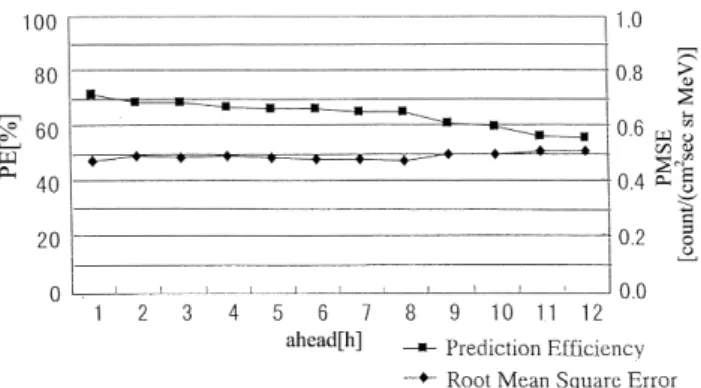
Fig. 5. Change of prediction efficiency (PE) and root-mean-square
error (RMSE) for the period 1 to 12 h ahead.
of the model. However, when we reduced the number of the training data sets, the performance became worse. Although this may be dependent on which storms are included in the training data sets, it is likely that the selected nine events for the training cover various types of flux enhancements.
To identify which input parameters were the most crucial, we dropped Dst and AL from the input parameters, and
de-signed a new ANN. In this model, PE was approximately 0.71, the same as for the original model. Then, we also dropped 6Dst from the inputs, i.e. the model had only two
inputs, 6AL and UT. For this model, PE was about 0.68, and still close to the original value, indicating that the effect of 6Dst is not very strong. Next, we dropped 6AL instead
of Dst, i.e. two input parameters, 6Dst, and UT, were used.
For this model, the prediction efficiency became 0.47, which is much lower than the original efficiency of 0.71. We also designed a model with only the 6AL index as the input pa-rameter, i.e. no UT input. The prediction efficiency was 0.64, which is just below the value of 0.68 that was obtained us-ing the model with 6AL and UT as inputs. From these re-sults, 6AL proved to be the most crucial factor for the flux-enhancement. It should be noted, however, that this 6AL is the quantity after Dst minimum, by which storm times were
identified in the first place.
Using the ANN model with inputs of 6AL, 6Dst, and
UT, we attempted to predict the electron fluxes for the pe-riod 2 to 12 h ahead. The results are summarized in Fig. 5. Although PE gradually decreased from 0.71 as the predic-tion time increased, it was 0.60 or more for the predicpredic-tions up to 9 h. Similar ratios and trends were obtained with the five-input model.
If real-time Dst and AL are available, our model can be
used for real-time operation. For this, it should be noted that the model starts to produce outputs several hours after the time of Dst minimum, since it is not until Dst recovers to a
certain degree that we can determine the time of Dst
mini-mum. However, this delay does not cause a significant prob-lem for the flux prediction, since the flux usually reaches a maximum much later than such a short period of time.
Using a neural network, Koons and Gorney (1991) have shown that up to 10 days of inputs are required to model
accurately the electron flux. Our model is not inconsistent with their result. Our model includes 6Dst and 6AL as
inputs. Although neural network feedback of our model is a one-hour step (Fig. 3), these two parameters can have the history of Dst and AL from the time of Dst minimum. The
maximum of the electron flux usually occurs a few days or more after Dst minimum, and this means that Dst and AL
for several days of inputs are used to model.
4 Concluding remarks
We have predicted successfully the electron flux using an El-man recurrent-ANN with inputs of AL, 6AL, 6Dst, Dst
and UT, or with inputs of 6AL, 6Dst, and UT. The feedback
connections of the ANN can model effectively the enhance-ment of the electron flux as a function of the above input parameters, in particular, 6AL. The substorm effect repre-sented by 6AL (i.e. the accumulation effect of AL history after Dst minimum) has a significance influence on the flux
enhancement in the recovery phase.
It has been accepted that substorms occur more often dur-ing southward IMF than northward IMF (e.g. Kamide et al., 1977), although all substorms are not triggered by southward turnings of IMF (e.g. Rostoker, 1983; Lyons et al., 1997). This may appear to indicate that 6AL effects simply re-flect the accumulation effect of southward IMF. It should be noted, however, that |AL| tends to be large with the in-crease in solar wind speed, as well as with the inin-crease in the southward IMF component (e.g. Maezawa and Murayama, 1986). They showed that velocity dependence of the AL index is steeper than linear, approximately proportional to V2. Hence, our result that the substorm effect represented by 6ALhas a significance influence on the flux enhancement is not inconsistent with the result obtained by Paulikas and Blake (1979), who showed that there is a good correlation between the solar wind velocity and the MeV electron flux. Some recent papers (e.g. Li et al., 2001) also have indicated the significance of the solar wind speed for the electron flux. Several researchers (e.g. Baker et al., 1997; Nakamura et al., 1998; Obara et al., 2000b) have suggested that during the main phase, the inward transport of intermediate-energy electrons occurs, and that seed electrons form. This main-phase transport process may be related to substorm activity, such as substorm injections. Our results suggest that as far as the flux level in the recovery phase is concerned, such a sub-storm process in the main phase of the sub-storm is not important. Rather, recurring substorms after the storm maximum, or the related magnetospheric state, determine to what extent the electrons, which presumably formed in the main phase, are energized.
Acknowledgements. Assistance of computational aspects by H. Nishimura is gratefully acknowledged. The relativistic electron flux data and Dst/AL indices are provided from the Meteorological
Satellite Center, Japan, and WDC-C2 of Kyoto University, Japan, respectively. This study was partly supported by the joint research
program of the Solar-Terrestrial Environment Laboratory, Nagoya University.
Topical Editor C. Chanteur thanks H. Koons and another referee for their help in evaluating this paper.
References
Baker, D. N., Li, X., Turner, N., et al.: Recurrent geomagnetic storms and relativistic electron enhancements in the outer mag-netosphere: ISTP coordinated measurements, J. Geophys. Res., 102, 14 141, 1997.
Elman, J. L.: Finding structure in time, Cognitive Sci., 14, 179, 1990.
Freeman, J. W., O’Brien, T. P., Chan, A. A., and Wolf, R. A.: En-ergetic electrons at geostationary orbit during the November 3-4,1993 storm: Spatial/temporal morphology, characterization by a power law spectrum and, representation by an artificial neural network, J. Geophys. Res., 103, 26 251, 1998.
Gussenhoven, M. S., Mullen, E. G., Brautingam, D. H., Hole-man, E., and Jorda, C.: Preliminary comparison of dose mea-surements on CRESS to NASA model predictions, IEEE Trans. Nucl. Sci., 38, 1655, 1991.
Kamide, Y., Perreault, P. D. , Akasofu, S.-I., and Winningham, J. D.: Dependence of substorm occurrence probability on the interplan-etary magnetic field and on the size of the auroral oval, J. Geo-phys. Res., 82, 5521, 1977.
Koons, H. C. and Gorney, D. J.: A neural network model of the rel-ativistic electron flux at geosynchronous orbit, J. Geophys. Res., 96, 5549, 1991.
Kugblenu, S., Taguchi, S., and Okuzawa, T.: Consequences of the neural network investigation for Dst −ALrelationship, Earth
Planets Space, 53, 207, 2001.
Li, X., Baker, D. N., Temerin, M., Larson, D., Lin, R. P., Reeves, G. D., Looper, M. D., Kanekal, S. G., and Mewaldt, R. A.: Are energetic electrons in the solar wind the source of the outer radiation belt?, Geophys. Res. Lett., 24, 923, 1997.
Li, X., Temerin, M., Baker, D. N., Reeves, G. D., and Larson, D.: Quantitative prediction of radiation belt elecrons at geostationary orbit based on solar wind measurements, Geophys. Res. Lett., 28, 1887, 2001.
Lyons, L. R., Blanchad, G. T., Samson, J. C., Lepping, R. P., Ya-mamoto, T., and Moretto, T.: Coordinated observations demon-strating external substorm triggering, J. Geophys. Res., 102, 27 039, 1997.
Maezawa, K. and Murayama, T.: Solar wind velocity effects on the auroral zone magnetic disturbances, in: Solar Wind-Magnetosphere Coupling, (Eds) Kamide, Y. and Slavin, J. A., pp. 59–83, Terra Scientific Publishing Company, Tokyo, 1986. Nagai, T.: “Space weather forecast”: prediction of relativistic
elec-tron intensity at synchronous orbit, Geophys. Res. Lett., 15, 425, 1988.
Nakamura, R., Kamei, K., Kamide, Y., Baker, D. N., Blake, J. B., and Looper, M.: SAMPEX observation of storm-associated elec-tron flux variation in the outer radiation belt, J. Geophys. Res., 103, 26 261, 1998.
Obara, T., Nagatsuma, T., Den, M., Sagawa, E., and Onsager, T. G.: Effects of the IMF and substorms on the rapid enhancement of relativistic electrons in the outer radiation belt during storm re-covery phase, Adv. Space Res., 26, 89, 2000a.
Obara, T., Nagatsuma, T., Den, M., Miyoshi, Y., and Morioka, A.: Main-phase creation of “seed” electrons in the outer radiation belt, Earth, Planets and Space, 52, 41, 2000b.
Paulikas, G. A. and Blake, J. B.: Effects of the solar wind on mag-netospheric dynamics: Energetic electrons at the synchronous or-bit, in: Quantitative Modeling of the Magnetospheric Processes, (Ed) Olson, W. P., Geophys. Mongr. Ser., vol. 21, pp. 180–202, AGU, Washington D. C., 1979.
Reeves, G. D.: Relativistic electrons and magnetic storms: 1992– 1995, Geophys. Res. Lett., 25, 1817, 1998.
Rostoker, G.: Triggering of expansion phase intensifications of magnetospheric substorms by northward turnings of the inter-planetary magnetic field, J. Geophys. Res., 88, 6981, 1983. Stringer, G. A., Heuten, I., Salazar, C., and Stokes, B.:
Artifi-cial neural network (ANN) forecasting of energetic electrons at geosynchronous orbit, in: Radiation Belts: Models and Stan-dards, (Eds) Lemaire, J. F., Heynderich, D., and Baker, D. N., Geophys. Mongr. Ser., vol. 97, pp. 291–295, AGU, Washington, D. C., 1996.
Wu, J. and Lundstedt, H.: Geomagnetic storm predictions from so-lar wind data with the use of dynamic neural networks, J. Geo-phys. Res., 102, 14 255, 1997.