HAL Id: hal-00196481
https://hal.archives-ouvertes.fr/hal-00196481
Submitted on 12 Dec 2007HAL is a multi-disciplinary open access archive for the deposit and dissemination of sci-entific research documents, whether they are pub-lished or not. The documents may come from teaching and research institutions in France or abroad, or from public or private research centers.
L’archive ouverte pluridisciplinaire HAL, est destinée au dépôt et à la diffusion de documents scientifiques de niveau recherche, publiés ou non, émanant des établissements d’enseignement et de recherche français ou étrangers, des laboratoires publics ou privés.
suspensions
Andreea Iordan, Alain Duperray, Claude Verdier
To cite this version:
Andreea Iordan, Alain Duperray, Claude Verdier. Fractal approach to the rheology of concentrated cell suspensions. Physical Review E : Statistical, Nonlinear, and Soft Matter Physics, American Physical Society, 2008, 77, pp.011911. �hal-00196481�
hal-00196481, version 1 - 12 Dec 2007
suspensions
A. Iordana, A. Duperrayb,c, C. Verdiera∗ (a) Laboratoire de Spectrom´etrie Physique, CNRS and Universit´e Joseph-Fourier (UMR5588),
140 avenue de la physique, BP87 38402 Saint Martin d’H`eres cedex, France.
(b) INSERM, U823, Grenoble, France. (c) Universit´e Grenoble I – Institut Albert Bonniot, Centre de Recherche Ontog´en`ese et Oncog´en`ese mol´eculaires,
Grenoble, France.
Abstract
New results on the rheological behavior of CHO cell suspensions in a large range of concentrations are reported. The concentration–dependent yield stress and elastic plateau modulus are formalized in the context of fractal aggregates under shear, and quite different exponents are found as compared to the case of red blood cell suspensions. This is explained in terms of intrinsic microscopic parameters such as the cell-cell adhesion energy and cell elasticity but also the cell’s individual dynamic properties, found to correlate well with viscoelastic data at large concentrations (φ ≥ 0.5).
PACS numbers: 83.60.La 47.57.Qk 47.57.E- 83.85.Cg
Keywords: rheology, CHO cells, Yield stress, Viscoelasticity, Fractal, aggregates
∗ Author to whom correspondence should be addressed verdier@ujf-grenoble.fr Tel. +33 4 76 63 59 80 Fax
I. INTRODUCTION
The rheology of complex fluids has been studied extensively over the past decades [1] and has revealed very intriguing behaviors, in particular properties of suspensions, either micronic or colloidal, are still a subject of interest [2, 3, 4, 5]. Classical behaviors of sus-pensions usually reveal shear–thinning effects, but other unusual ones like shear–thickening [6] (i.e. viscosity increase with shear rate) or yield stress have been observed [2, 3]. The yield stress is the critical value of the shear stress needed to induce flow for a given fluid. It is closely related to the internal structure of the fluid therefore its ability to form (or break) particle clusters under flow. In this respect most studies have focused on solid sphere suspensions.
On the other hand, there are much less works dedicated to suspensions of deformable particles, such as biological cell suspensions. The main works can be found in the field of blood rheology. Suspensions of Red Blood Cells (RBC) within plasma were first investigated by Chien [7, 8] and revealed a shear–thinning behavior, but a more detailed inspection of the viscosity–shear rate diagrams showed that at low shear rates, the stress level is close to a constant σs (Pa), called the yield stress. The well–known Casson’s model [9] relating the
shear stress σ to the shear rate ˙γ (µ being a constant viscosity) can be used to determine the yield stress:
√
σ = √σs+qµ ˙γ (1)
Chien and co–authors obtained σs for a large range of hematocrit (H), i.e. the RBC
volume concentration [10]. They showed a relationship of the type σs ∼ (H − b)3 (b being
a constant hematocrit).
It is still not known yet whether this type of behavior is universal, or if it could depend on cell type, cell shape or other biological effects such as cell adhesion or cell elasticity. In particular, one proposed explanation of the yield stress in RBCs suspensions is based on the existence of ’rouleaux’ which build due to cell interactions and exhibit large shape aspect ratios [8] and a fractal dimension D. Therefore it is necessary to apply strong enough stresses in order to break such aggregates, in close relation with the yield stress.
In this work we propose to investigate the rheology of a new cell suspension, consisting of CHO cells (Chinese Hamster Ovary cells) in a large range of concentrations. Such cells
are commonly used in biology, easy to culture, and can be genetically modified to induce different adhesive properties. These cells are spherical when suspended in a culture medium, and organized in a specific manner leading to particular aggregation patterns of fractal type. This leads to the determination of scaling laws based on fractal exponents (for the yield stress σs and elastic modulus G0) which are seen to be non universal but dependent on cell type.
The flow curves constitute a basis to test classical empirical models (Bingham, Casson, Herschel–Bulkley models) and other ones [11, 12] based on kinetic theories describing the rupture and formation of particle clusters. The latter ones successfully relate macroscopic effects to microscopic parameters, such as the cell–cell adhesion energy and the cell elasticity. The microscopic parameters that we find match well the ones found in the literature using other techniques. This is important in the context of recent studies related to tumour growth [13, 14, 15] which consider cell assemblies with interactions as well as cell elastic deformations. Furthermore, this study emphasizes the relationship between the dynamic rheological properties of suspensions [16] and the single cell properties.
The paper is organized as follows. In §II, we describe the materials and methods of investigation (i.e. mainly rheometry and microscopy). Then steady shear and dynamic oscillatory shear results are presented in §III. In the light of the typical scaling laws obtained, we suggest the use of the model of Snabre and Mills [11] presented in §IV, to analyze our data, and find the corresponding microscopic parameters. Finally, we present an aternative approach based on structural similarity [17] in §V.
II. MATERIALS AND METHODS
In our model system, adherent CHO cells are grown in culture medium (DMEM con-taining 10% Fetal Calf Serum) using standard T 75 boxes under proper conditions (37◦C,
5% CO2), until they are detached using trypsin, when they reach a confluency of ∼ 70%.
Suspended cells are centrifuged at 1200 rpm, a high enough velocity to get a concentrated suspension, but slow enough in order to maintain the cells alive. Cell volume concentration φ (i.e. similar to the hematocrit H) is determined accurately after centrifugation in hema-tocrit tubes containing the CHO cells. Then the right amount of remaining supernatant is removed until the desired concentration is obtained (between 0 and 60 %). Different exper-iments were carried out on a conventional Rheometer (Bohlin Gemini 150). Both steady
shear and oscillatory measurements were made at T = 20oC. Due to the large amount of
cells needed (we usually require twelve T 75 flasks in order to obtain a volume of roughly 0.3 mL of cells), we chose to use a plate–plate geometry (20 mm diameter) with a small gap (between 400 µm and 1 mm) for the concentrated suspensions whereas the smaller concentra-tions (below 10 %) were tested using the 60 mm cone–plane geometry (2o angle). Typically
in our fluid, the suspended cells are spherical and monodisperse with a radius a ∼ 10µm.
III. RESULTS
Experimental results for constant steady state shear rate ˙γ are presented in Fig.1. The viscosity η is shown to vary over several decades, within shear rates typically between 10−3s−1
and 103s−1. In some cases, we limited ourselves to the higher shear rates because of
exper-imental reasons (i.e. steady state not reached). By a first inspection of the curves, we recognize the signature of a yield stress fluid as depicted by the slope close to −1 in the viscosity–shear rate diagram (or equivalently a constant shear stress at low shear rates), especially at the largest concentrations φ, which will be particularly of interest here. The existence of this yield stress is attributed to weak interactions which can exist after prepa-ration of the system. Already existing proteins are available on cell membranes and can be recruited to form bonds, leading to particular structure arrangments. This explains the presence of a yield stress related to the formation of such structures. The yield stress is found to depend on volume concentration φ in a manner to be discussed later.
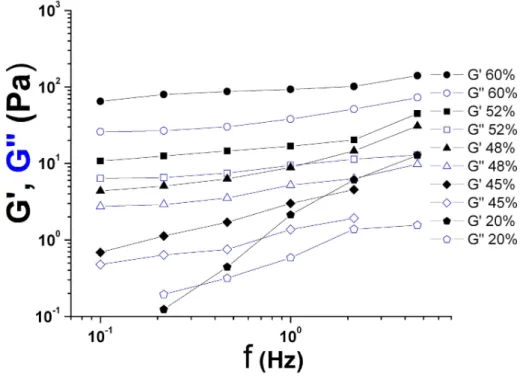
A second series of experiments was carried out in order to study the systems under oscillatory strains at frequency f . Small deformations (1% or less) within the linear regime were performed in order to characterize the elastic modulus G′(f ) and the loss modulus
G”(f ). The frequency values were limited to the narrow range corresponding to fast modes, in order to limit a possible time–dependence of the results, due to sedimentation, protein expression, or cluster formation–destruction. We find an interesting behavior as shown in Fig.2. Moduli G”(f ) usually prevails over G′(f ) at small concentrations (e.g. φ = 0.2),
but as φ increases, the system becomes elastic with a much larger G′(f ). This behavior
is the signature of a viscoelastic medium, due to the fact that interactions between elastic cells become effective at large concentrations (φ ≥ 0.4). The slow increase of the elastic modulus G′ against frequency reveals the presence of a so–called ’elastic plateau’ modulus
FIG. 1: Color online. Viscosity η (Pa.s) vs. shear rate ˙γ (s−1) at different volume concentrations φfrom 0 to 60%
(G0) determined by the value of G′(f ) at intermediate frequencies (1 Hz typically). The
presence of elasticity has been observed previously for RBC suspensions [18], above a critical volume fraction around φ = 0.2, and is believed to come from the elasticity of the cells as they are packed more closely at large concentrations such as the ones also encountered in tumour spheroids [14]. Finally, we observe that the trends in the G′ − G” plots for large
concentrations (φ ≥ 0.5) are remarkedly similar to previous microrheological results obtained on single cells [19, 20, 21]. Indeed, they show a slowly increasing G′ and G” (increasing
slightly faster at frequencies above 1Hz), where the elasticity dominates (G′ ≥ G”).
As in the case of suspensions, we define a maximum packing fraction φ0 (which is usually
0.64 or even 0.74 for solid spheres in a face–centered–cubic crystal), depending on cell elas-ticity, i.e. their compactness [22]. Due to the presence of soft spherical cells, it is expected that the value of φ0 will be in this range. φ0 is determined using the reduced viscosity plot
η
η0 as a function of φ (η at a shear rate of 10
2s−1, η
FIG. 2: Color online. Shear moduli G′ and G” (Pa) vs. frequency f at different volume concen-trations φ ranging from 20% to 60%
our case, this data (not shown) is found to match the well–known equation
η
η0 = (1 −
φ φ0
)−2.5φ0 (2)
proposed by Krieger and Dougherty [23], this providing the value φ0 ∼ 0.65. Note that
this relationship is interesting because it matches Einstein’s viscosity for hard spheres [24, 25] η/η0 = 1 + 2.5 φ as well as Batchelor’s correction for non colloidal spherical particles [26]
η/η0 = 1 + 2.5 φ + 5.2φ2 (here an expansion of (2) for small φ gives a second coefficient in
the expansion of ∼ 5 instead of 5.2, when using φ0 = 0.65). Finally, (2) diverges as expected
when φ → φ0, the limiting packing fraction.
In order to investigate the effect of the volume concentration φ, we first need to obtain the flow curve σ( ˙γ) of the suspensions, as well as the relevant parameters, such as the yield stress σs. From the viscosity curve in Fig.1, we plot the stress σ = η( ˙γ) ˙γ vs. shear rate ˙γ
in Fig.3, and fit the data with the Herschel–Bulkley law [2] σ = σs+ M ˙γn, where M is a
FIG. 3: Color online. Determination of the yield stress σs using Herschel–Bulkley’s model.
fluid, and the case of the Newtonian fluid is recovered for n = 1, σs = 0). Parameters have
been optimized using a standard Newton–Raphson method. The parameter n is found to be very close to 1 at small concentrations (0, 10, 20 %) and decreases with concentration, taking respective values of 0.89, 0.71, 0.57, 0.55, 0.47, 0.47 for concentrations of 40, 42, 46, 48, 52 and 60 %. This point will be further discussed in §V.
This leads to the determination of the yield stress σs as a function of volume fraction
φ. Such measurements are usually difficult [10] because of possible slip, sedimentation and evaporation [27]. Care has been taken to avoid such problems, therefore only shear rates larger than 10−3s−1 (lowest value) are considered. The empirical Herschel–Bulkley model
(involving a yield stress) is then used when sufficient data points are available. The fits are in satisfactory agreement with the data which gives good confidence in the values of the yield stresses for φ ≥ 0.42. Another attempt has been made using Casson’s model and gives similar data. The Bingham model was found to give less accurate values.
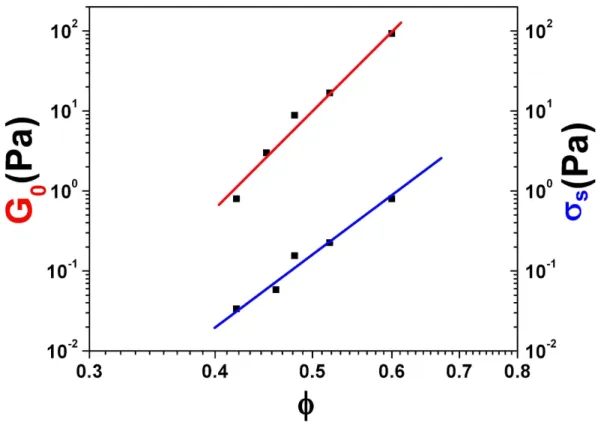
FIG. 4: Color online. Yield stress σs and Shear elastic modulus G0 = G′(f = 1Hz), vs. volume concentration φ, log-scale.
frequency f = 1 Hz) are plotted in Fig.4 as a function of volume concentration. This plot shows power law dependences of the form σs ∼ φm1 and G0 ∼ φm2 and reminds previous
results [11] obtained in the case of the rheology of RBCs suspensions, at least for the yield stress σs. From Fig.4 we find that m1 ∼ 8.4 and m2 ∼ 11.6. The m1 exponent is quite
different from the one obtained in the case of RBCs suspensions (m1 ∼ 3) as this will be
discussed below.
IV. MODELLING
As seen above, rheological modelling of such suspensions should therefore predict shear– thinning behavior, as well as yield stress properties at low shear rates ˙γ → 0 and a con-centration dependence of σs and G0. In addition, cell suspensions correspond to aggregated
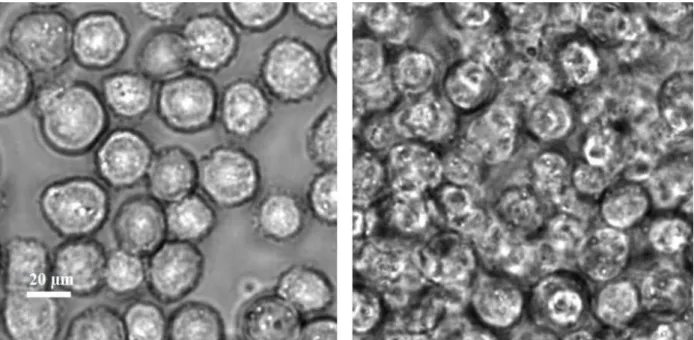
FIG. 5: Color online. Phase contrast microscopy of CHO cell suspension : 10% and 52%. Same scale for both images.
the cells with respect to each other as they exhibit deformations, rotations, possible rolling and/or separation. During such events, cells may form clusters of size Rf to be compared
with the cell size a (radius). The formation and destruction of cell clusters is the major ingredient to understand the rheological properties of the cell system, in order to explain our data.
For example, when sheared under stress σ, clusters break into smaller ones, leading to shear–thinning effects. On the other hand, the possible encounter of clusters leads to the formation of larger structures, increasing the viscosity. Clusters are organized in a fractal way. First, one needs to consider a cluster at rest. Its size is Rf and it contains N cells,
linked by the following relationship [28]:
Rf
a ∼ N
1/D (3)
where D is the fractal dimension. To determine D, we follow a previous approach [29] and consider circles (instead of rectangles) of radius Rf containing a cluster. Then cells
(radius a) are counted for two rather small concentrations (10% and 20%). Clich´es like the left one in Fig.5 are used to draw circles and count the number of cells N. For larger clusters containing more cells, we obtain a linear relationship between log10(Rf/a) and log10(N),
FIG. 6: Color online. Plot of Rf
a as a function of N to determine the fractal dimension D. Two concentrations are used: 10% and 20%. There are noticeable differences at low values of N but there is an increased accuracy for large N , where the two concentrations give rise to the same slope. D = 1.47.
as shown in Fig.6. Note that the two cases studied (10% and 20%) give the same slope for large values of N, this justifying the fractal hypothesis indicated by equation (3). For our system, we determine D ∼ 1.47 from the 2D images. Thus, in three dimensions, we expect a fractal dimension of the order D ∼ 2 [30]. This number is similar to the ones found for RBCs suspensions, although the scaling exponents for yield stresses are quite different.
In the semi–empirical model proposed by Snabre and Mills [11, 12], the formation and dissociation of clusters under flow is taken into account. A change in Rf as a function of
Rf
a = 1 + ( σ∗
σ )
m (4)
where m is a dimensionless parameter. σ∗ is a critical stress related to the interfacial
adhesion between cells : σ∗ = Γ/a, and Γ is the cell adhesion free energy. Using the concept
of effective medium with volume fraction
φA= φ (
Rf
a )
3−D (5)
one assumes an effective viscosity :
η(σ) = η0 1 − φA
(1 − φA
φ0)
2 (6)
and obtains the constitutive equation [31] which contains the yield stress given by :
σs ∼ σ∗(
φ φ0
)m(3−D)1 (7)
The last parameter to be used in the formula, φ0, is the maximum packing concentration
found previously.
We use the previous model to explain our experimental data. The exponent m1 = 8.4
found for the yield stress σsis plugged into the previous scaling law (7) for determination of
the parameter m = 0.078. This is smaller than the values of m found for RBC suspensions (typically m ∼ 0.3). This means that the size of clusters is not so sensitive to the applied stress, indeed one can consider that the cell aggregates are easy to form (or hard to break) because of the round shape of the cells, in contrast with RBCs which need to bind in a very special way to form ’rouleaux’. Thus, once broken by stress, ’rouleaux’ are difficult to re– form. We have obtained the value of the critical stress σ∗ = 1.4 N/m2, and a corresponding
value of Γ = 1.4 10−5N/m. This value of σ∗ is higher than the ones obtained for RBCs [11]
but the interfacial energy Γ is in the range of the small values indicated for vesicles [32]. This is in favor of the initial assumption that few adhesion molecules are involved in the region of contact between the cells.
Finally, we postulate a similar relationship [28] for the shear elastic modulus
G0 ∼ G∗(
φ φ0
where G∗ is an effective elastic modulus, but we include an additional exponent n to be
determined. We come up with p = 0.056 and G∗ = 234P a. This value of the reference
modulus G∗, as explained in the concept of fractal exponents [28], is to be related to typical
values for single cells. In particular, it corresponds to a Young’s elastic modulus E∗ = 702P a
(assuming that the cell is incompressible) which is typical for adherent Wild Type CHO cells, of the order 0.5 − 1 kP a as measured by AFM [33, 34].
V. AN APPROACH BASED ON STRUCTURAL SIMILARITY
Another method for having access to parameters like the yield stress σs and the viscosity
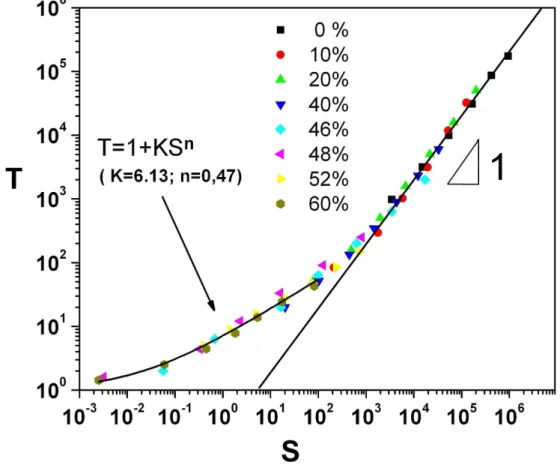
η of such suspensions has been proposed earlier [17]. It can be of interest to mention such an approach since it is relevant to our case, in the context of concentration–dependent laws. The idea consists in assuming a dependence of the reduced shear stress T = σ/σs as a
function of the reduced shear rate S = η ˙γ/σs. This similarity is interesting because it can
allow to superpose the different curves onto a single master curve. Such an approach has been used previously with success in the case of clay–water suspensions. The master curve is shown in our case for CHO cell suspensions (Fig.7).
We note again a good superposition of the data, although the few available data points for low reduced shear rates do not allow very accurate results for the parameters under inves-tigation. In an attempt to model the first part of the curve (low shear rates), a relationship of the following kind was found :
T = 1 + 6.13 S0.47 (9)
The value of the exponent close to 1/2 recalls the well–known Casson’s equation but in a slightly different form. In fact, this form is a limiting case of Casson’s equation, corre-sponding to an asymptotic expansion of equation (1) for small enough shear rates. The use of equation (1) instead of (9) does not fit the whole data. Proceeding further, we can obtain values of the yield stress σs and viscosity η from the ’ad–hoc’ data reduction. This
has led us to similar relationships for the yield stress dependence vs. concentration (as in section IV). Similarly, the analysis of the viscosity (η) dependence against concentration φ also shows that equation (2) and the following equation η/η0 = [1 + 0.75/(φ0/φ − 1)]2 from
FIG. 7: Color online. Master curve of the reduced shear stress T vs. reduced shear–rate S.
packing fraction of the order φ0 ∼ 0.65. Therefore we can conclude that this approach is
complementary to the previous one in the sense that it can lead to an increased accuracy, when sufficient data is available, although it does not provide physical correlations between microscopic and macroscopic parameters, like the model that we chose to use in the above analysis [11].
VI. CONCLUSIONS AND PERSPECTIVES
To sum up, the system studied here provides unique features important for the rheology of biological suspensions and tissues. These concentrated cell suspensions behave as yield stress fluids (also called visco–plastic materials), for which a fractal approach has been used. Under shear, the fractal structure changes and can be modelled using a yield stress σs and
elasticity modulus G0related to the fractal dimension D. Two other microscopic parameters
of interest have been introduced in the model: the cell adhesion energy Γ, and the cell’s effective elastic modulus E∗ found to be :
Γ ∼ 10−5N/m, E∗
∼ 700 P a (10)
The first is in the range of typical values of cell adhesion energies, and the second in agreement with previous microrheology experiments. We also found a similar behavior between the dynamic shear moduli G′(f ) and G”(f ) in this study (at φ ≥ 0.5), and the ones
obtained from microrheological studies on single cells [19, 20, 21] using various techniques. Both show slowly increasing dynamic moduli in terms of frequency, with the same relative positions. This idea probably deserves more attention and should be tested in the future, in particular further works may focus on the characterization of other cellular suspensions including cells with different elastic properties.
Finally, such a study can naturally lead to the understanding of biological tissues, by including stronger adhesion properties between the cells, or by taking into account the addition of Extra-Cellular Matrix components.
Acknowledgments – The authors wish to thank the EC Marie Curie Research Train-ing Network MRTN-CT-2004-503661 on ”ModellTrain-ing, mathematical methods and computer simulation of tumour growth and therapy” (http://calvino.polito.it/˜ mcrtn/) for financial support, and C. Misbah for fruitful discussions about the manuscript.
[1] R. G. Larson, The structure and rheology of complex fluids (Oxford Univesity Press – New-York, 1999).
[2] P. Coussot, Rheometry of pastes, suspensions and granular materials (Wiley - New York, 2005).
[3] R. J. Flatt and P. Bowen, J. Am. Ceram. Soc. 89, 1244 (2006).
[4] A. N. Alexandrou and G. Georgiou, J. Non-Newtonian Fluid Mech. 142, 199 (2007).
[5] J. M. Brader, T. Voigtmann, M. E. Cates, and M. Fuchs, Phys. Rev. Lett. 98, 058301 (2007). [6] H. M. Laun, Angew. Makromol. Chem. 124–125, 335 (1984).
[7] S. Chien, S. Usami, R. J. Dellenback, and M. I. Gregersen, Science 157, 827 (1967).
[8] S. Chien, S. Usami, R. J. Dellenback, M. I. Gregersen, L. B. Nanninga, and M. Mason-Guest, Science 157, 829 (1967).
[9] N. Casson, A flow equation for pigment–oil suspensions of the printing ink type (Pergamon– London, 1959), chap. 5.
[10] S. Chien, S. Usami, H. M. Taylor, J. L. Lundberg, and M. I. Gregersen, J. Appl. Physiology 21, 81 (1966).
[11] P. Snabre and P. Mills, J. Phys. III. France 6, 1811 (1996).
[12] P. Snabre and P. Mills, Colloids Surf. Physicochem. Eng. Aspects 152, 79 (1999). [13] D. Drasdo and S. H¨ohme, Phys. Biol. 2, 133 (2005).
[14] J. Galle, M. Loeffler, and D. Drasdo, Biophys. J. 88, 62 (2005). [15] D. Ambrosi and L. Preziosi (2007), unpublished.
[16] C. Verdier, J. Theor. Medicine 5, 67 (2003). [17] P. Coussot, Phys. Rev. Letters 74, 3971 (1995). [18] G. B. Thurston, Biophys. J. 12, 1205 (1972).
[19] B. Fabry, G. N. Maksym, J. P. Butler, M. Glogauer, D. Navajas, and J. J. Fredberg, Phys. Rev. Lett. 87, 148102 (2001).
[20] J. Alcaraz, L. Buscemi, M. Grabulosa, X. Trepat, B. Fabry, R. Farr´e, and D. Navajas, Biophys. J. 84, 2071 (2003).
[21] B. D. Hoffman, G. Massiera, K. M. V. Citters, and J. C. Crocker, Proc. Natl Acad. Sci. USA 103, 10259 (2006).
[22] D. Quemada, Eur. Phys. J. AP 1, 119 (1998).
[23] I. M. Krieger and T. J. Dougherty, Trans. Soc. Rheology 3, 137 (1959). [24] A. Einstein, Annals der Physik 19, 289 (1906).
[25] A. Einstein, Annals der Physik 34, 591 (1911).
[26] G. K. Batchelor and J. T. Green, J. Fluid Mech. 56, 401 (1972).
[27] Y. C. Fung, Biomechanics. Mechanical properties of living tissues (Springer – New York, 1996).
[28] P. G. de Gennes, Scaling concepts in polymer physics (Cornell University Press, 1979). [29] C. Allain and B. Jouhier, J. Physique Lett. 44, 421 (1983).
[30] M. Kolb and R. Jullien, J. Physique Lett. 45, 977 (1984).
[31] The 1D–constitutive equation is given by η(σ) = σ˙γ = η0 1−φ(1+(
σ∗ σ)
m)3−D
(1−φ0φ(1+(σ∗σ )m)3−D)2 which is implicit
for σ but provides an explicit relation for ˙γ in terms of σ. Letting ˙γ → 0 allows to determine the yield stress σs.
[32] Z. Guttenberg, B. Lorz, E. Sackmann, and A. Boulbitch, Europhys. Lett. 54, 826 (2001). [33] E. Canetta, A. Duperray, A. Leyrat, and C. Verdier, Biorheology 42, 321 (2005).
[34] M. Zhao, C. Srinivasan, D. J. Burgess, and B. D. Huey, J. Mater. Res. 21, 1906 (2006). [35] J. S. Chong, E. B. Christiansen, and A. D. Baer, J. Appl. Polym. Sci. 15, 2007 (1971).