HAL Id: hal-02170625
https://hal.archives-ouvertes.fr/hal-02170625
Submitted on 2 Jul 2019
HAL is a multi-disciplinary open access
archive for the deposit and dissemination of sci-entific research documents, whether they are pub-lished or not. The documents may come from teaching and research institutions in France or abroad, or from public or private research centers.
L’archive ouverte pluridisciplinaire HAL, est destinée au dépôt et à la diffusion de documents scientifiques de niveau recherche, publiés ou non, émanant des établissements d’enseignement et de recherche français ou étrangers, des laboratoires publics ou privés.
Relationship between land-use in the agro-forestry
system of les Landes, nitrogen loading to and risk of
macro-algal blooming in the Bassin d‘Arcachon coastal
lagoon (SW France)
R. de Wit, J. Leibreich, Françoise Vernier, François Delmas, H. Beuffe, P.
Maison, J.C. Chossat, Christophe Laplace-Treyture, R. Laplana, M. Torre, et
al.
To cite this version:
R. de Wit, J. Leibreich, Françoise Vernier, François Delmas, H. Beuffe, et al.. Relationship between land-use in the agro-forestry system of les Landes, nitrogen loading to and risk of macro-algal blooming in the Bassin d‘Arcachon coastal lagoon (SW France). Estuarine, Coastal and Shelf Science, Elsevier, 2005, 62 (3), pp.453-465. �10.1016/j.ecss.2004.09.007�. �hal-02170625�
e note th at this is an aut hor-pr oduc ed PDF of an article a cce pted for publ icatio n foll owin g pe er revi ew. T he defin iti ve pu b lish er-a uthentic ated ve rsion is av ail ab le on the pub lis her W eb site
Estuarine, Coastal and Shelf Science February 2005; 62(3) : 453-465
http://dx.doi.org/10.1016/j.ecss.2004.09.007
© 2004 Elsevier Ltd All rights reserved
Archimerhttp://www.ifremer.fr/docelec/
Archive Institutionnelle de l’Ifremer
Relationship between land-use in the agro-forestry system of les Landes, nitrogen loading to and risk of macro-algal blooming in the Bassin
d'Arcachon coastal lagoon (SW France)
R. De Witaµ, J. Leibreichb, F. Vernierb, F. Delmasb, H. Beuffeb, Ph. Maisonb, J.-C. Chossatb, C. Laplace-Treytureb, R. Laplanab, V. Clavéb, M. Torreb, I. Aubyc, G. Trutc, D. Maurerc
and P. Capdevilled
aUMR-5805 “Environnements et Paléoenvironnements Océaniques”, CNRS & Université Bordeaux 1, 2 rue du Pr.
Jolyet, F-33120 Arcachon, France
bCemagref-Bordeaux, 50 Avenue de Verdun, F-33612 Cestas cedex, France cIFREMER-Arcachon, Quai du Cdt Silhouette, F-33120 Arcachon, France
dService Intercommunal d'hygiène et de Santé (Syndicat Intercommunal du Bassin d'Arcachon), 20, Allée Ernest
de Boissière, Audenge, France
*: Corresponding author : UMR 5119 CNRS-Université Montpellier II Ecosystèmes lagunaires, Université Montpellier II, Case 093, 34095 Montpellier Cedex 05, France. rde-wit@univ-montp2.fr
Abstract: Nitrogen loading to the Bassin d'Arcachon coastal lagoon (SW France) was evaluated by studying land-use and nitrogen output in its 3001 km2 catchment. At present, the catchment is dominated by forestry (79%), while intensive agriculture occupies 9% of the surface. The N-output of two hydrological subunits, i.e. the Tagon subunit dominated by pine forestry and the Arriou II subunit comprising both forestry and intensive agriculture, were monitored for a seven year period (1996– 2002). From these observations it was calculated that forestry contributes on average 1.6 kg total N ha−1 yr−1, which is dominated by organic nitrogen (DON + PON are 70% of N). On an areal basis, intensive agriculture contributes 26 times more than forestry, i.e. 41.6 kg total N ha−1 yr−1, which is mainly in the form of nitrate (65% of N). These data were upscaled to the catchment and the upscaling was validated by comparison to gauged nitrogen throughputs for the catchment of the Leyre river that is the major tributary to the system. Taking into account the other known N sources and the interannual variability in the catchment it was estimated that nitrogen loading to the lagoon was on average 90 kg ha−1 yr−1 (range from 54 to 126 kg ha−1 yr−1). The sandy soils of the catchment have a clear potential for denitrification, but anoxic conditions (waterlogged) and input of organic matter to fuel this process are required. Currently, agricultural practices and spatial planning do not make use of this potential. Nitrogen loading in the Bassin d'Arcachon is reflected by 10–40 μM nitrate concentrations in winter, which became depleted during spring as a result of uptake by vegetation. Short-term uptake experiments showed that the macroalga Monostroma obscurum is well adapted to temperatures between 10 to 20 °C and competitive with respect to the seagrass Zostera noltii when the nitrate concentrations are above 10 μM. Spring conditions with high nitrate and high insolation are therefore favourable for M. obscurum and this species presents a high risk for algal blooming. In contrast, the macroalga Enteromorpha clathrata well adapted to summertime temperatures around 25 °C, forms occasionally blooms in the lagoon. This phenomenon is limited due to the low DIN concentrations in summer.
INTRODUCTION
The Bassin d’Arcachon is a mesotidal lagoon on the SW coast of France with a volume at mean sea level of 317 . 106 m3 and an average annual freshwater inflow of 1.25 . 109 m3 (Bouchet et al., 1997). The 3000 km2 catchment of the Bassin d’Arcachon is dominated by sand soils of pleistocene origin which are typical for the Les Landes system. The catchment is typical lowland, the average slope is as low as 0.25 % and land-use is dominated by forestry, mainly pine trees. The lagoon is home of the largest seagrass meadows (70 km2), comprising Zostera noltii Hornem. and Zostera marina L., in Western Europe (Auby & Labourg, 1996) and a major site for oyster-farming in France. Recognised ecosystem functions and services of such coastal lagoon ecosystems encompass i) biogeochemical functions as element cycling and control of nutrient flows, ii) biodiversity and landscape functions , iii) resources for aquaculture and fishing activities, and iv) tourism. Macroalgal blooming in such systems impairs ecosystem functions and services. This phenomenon has been observed sometimes during the last twenty years in the
Bassin d’Arcachon. While, fortunately occurrence and extension of algal blooming were limited
both in time and space, it has been related to increased eutrophication and changing land-use in the catchment (Auby et al., 1994). Since the early 1990’s, Monostroma obscurum (Kützing) J. Aghard is the dominant blooming algal species, but Enteromorpha spp have also been frequently observed. Wordwide, seagrasses have suffered severe losses during the last decades, particularly in Western Europe. Several cases have been documented where macroalgal communities have completely displaced original seagrass communities as a result of eutrophication (Duarte, 1995; Valiela et al., 1997a; Hemminga, 1998; Flindt et al., 1999; Hauxwell et al., 2003). Understanding of eutrophication phenomena in coastal lagoons and estuaries strongly depends on knowledge on nutrient fluxes in the catchment (i.e. Valiela et al., 1997b).
A major concern for environmental management of the Bassin d’Arcachon is to ensure the conservation of seagrass meadows, which support high biodiversity and nurseries, that is compatible with a qualitative and quantitive phytoplankton production to support the
conchyliculture. The aims of the present study were i) to study the link between land-use and nitrogen loading in the Bassin d’Arcachon, ii) to identify and study possibilities to use
denitrification potential in the catchment, and iii) to evaluate how changing N loading can change the competitive position of seagrasses with respect to macroalgae.
Study Area
Lagoon environment
The Bassin d’Arcachon is a mesotidal lagoon on the SW coast of France (see Fig. 1). The
tidal difference ranges from 1.1 m (neap tides), 3 m (mean tides) to 4.9 m (spring tides) and the tidal prism ranges from 200 . 106 to 400 . 106 m3 (Bouchet et al., 1997). The total area of the lagoon is approximately 180 km2, which includes the very dynamic tidal inlets and changing sand banks in the S.W. corner of the lagoon. However, most studies have excluded these tidal inlets and sand banks from the surface area of the lagoon and considered the lagoon environment
sensu stricto as the part of the lagoon located North of the line Cap-Ferret-Le Mouleau, which
corresponds to the meridian 59.6 ° N. The lagoon defined this way is nearly triangular in shape with a surface equal to 156 km2 and a volume at mean sea level of 317 . 106 m3 (L’Yavanc, 1995). Only 40 km2 remains submerged at low tide. An average annual freshwater inflow has been estimated of 1.25 . 109 m3 (Bouchet et al., 1997), corresponding to a flow of 40 m3 s-1. However, preliminary hydrodynamic modelling has assumed an average net fresh water inflow of 60 m3 s-1 (Salomon and Breton, 1995), which is more characteristic for wet periods. The residual flows in the tidal inlets range from + 25 m3 s-1 (into the lagoon) to – 135 m3 s-1 (out of the lagoon). Accordingly, the lagoon shows a net import of oceanic water during 3 to 4 days periods around spring tide, while it shows a net export to the ocean during the rest of the time, the volume of which corresponds to the sum of the temporarily imported oceanic water and the freshwater loading (Salomon and Breton, 1995). Using these extreme flows to calculate the flushing time (Tf ) as recommended by Monsen et al. (2002), Tf ranges from 27 to 146 days. The
average residence times of freshwater in the lagoon have been calculated from averaged
measured salinities and freshwater loading. Accordingly, the residence time of fresh water in the lagoon varied from 10 to 24 days, during periods of high (120 m3 s-1) and low (10 m3 s-1)
freshwater loading, respectively (Bouchet et al., 1997).
Catchment
The catchment (see Fig. 1) is typical lowland, as the average slope is as low as 0.25 %. The catchment sensu stricto is oriented NW-SE, has a surface of 3001 km2 and is drained by the Leyre river with an outlet into the lagoon in the SE corner, and by about 17 small streams, which are direct tributaries to the lagoon. In addition, canals built in the 19th century bring in water from regulated dune lakes, i.e., Etang de Lacanau and Etang de Cazaux et Sanguinet, which occur N
and S of the Bassin d’Arcachon, and have catchments of 829 km2 and 307 km2, respectively. The catchment is poorly urbanised (mean population density of 35 inhabitants/km2) except the littoral zone of the Bassin d’Arcachon, which is an urbanised area of about 80,000 inhabitants and a holiday resort with increased occupation > 200,000 persons during the summer months. One hundred percent of the urban wastewater from the entire urban zone encircling the Bassin
d’Arcachon is collected in a collectively operated wastewater collection system and directly
diverted to the open ocean after treatment. Thus, household and industrial wastewater from this zone stopped contributing to contamination and nutrient loading of the lagoon since the early 1980’s. In the remaining rural area (6,000 inhabitants) wastewater is treated in different autonomous wastewater treatment plants, which constitute point sources of N and P in the catchment.
The catchment has undergone important changes during the last centuries. In the early 19th century, it was a pastoral area mainly used for sheep herding, some forest exploitation and subsistence farming. It then comprised heather vegetation, Molinia type of temporal wetlands, dunes, coniferous and deciduous woods and a very minor proportion of agriculture around villages. This area has been massively drained and forested with pine trees (Pinus pinaster L.) following the imperial decree of 1857 (Sargos, 1997), and currently pine forestry is the major surface occupation. However, new surface occupations have arisen since the 1960’s as intensive farming (corn, carrots and other vegetables) and more recently pisciculture. In this study we use a detailed cartography to quantify the different land uses and present estimates of contributions of the different land-uses to N-loading in the lagoon.
Materials and Methods
Cartography and quantification of land occupation and land use in the catchment sensu
stricto (see Fig. 1) was elaborated by remote sensing using a Landsat image of 1998, by
combining with other techniques as areal photography and by consulting public data bases (Rivet and Vernier, 2000). The data bases consulted included the National Inventory of Forestry of 1994 and 1998, and the CORINE land cover held by IFEN, the French Institute of the Environment. This was completed by ground truthing and complementary data collection concerning the cultivated crops for 3800 ha of agricultural surface, representing 14 % of the total agricultural surface. The agricultural surface area and land use was thus updated to the 1998 situation by using a supervised classification; the Erdas Imagine software was used.
Two hydrological subunits were chosen to follow the output of N compounds during the seven-year period from 1996-2002. The Arriou subunit (see Fig. 1) has an area of 9360 ha and comprises both pine forests, which occur both upstream and downstream, and a mixture of intensive agriculture and pine forestry in the intermediate section. It has an outlet into the Leyre river. From 1996-1999, six stations were monitored along the surface hydrological flow path, two of which were equipped with ultrasonic probes for continuously monitoring water height that were connected to Datataker DT50 (Dymelco) for data storage. The water cross section of the channels was correlated with water flow using manual current velocity measurements. This way, water height was used as a proxy for water flow. All six station were visited weekly for manual flow measurements and sampling of water samples, which were transported in coolboxes to the laboratory where they were analysed for physicochemical parameters. This strategy allowed within this subunit separating a section of 2322 ha that comprised both intensive agriculture corn and field cropping (702 ha) and forestry and was labelled Arriou II. By considering the
difference between the hydrological input and output of Arriou II and by substracting contributions from forestry extrapolated from the measurements in the Tagon subunit (see below). Thus, it was possible to measure specifically the contribution of agriculture to N-loading (Beuffe and Vernier, 1999). After 1999, the sampling strategy was changed. The stations with the ultrasonic probes measuring water height located at the outlet of and the station directly upstream Arriou II, were equipped with automatic samplers that were programmed to take samples after a constant volume had passed, with refrigerated sample storage. This way, water samples have been obtained that were better representatives of the throughflow than the punctual samples taken at weekly intervals during field visits. The stored samples were collected biweekly and
transported in coolboxes to the laboratory where they were analysed for physicochemical
parameters. The Tagon hydrological subunit (see Fig. 1) has an outlet directly into the SE corner of the Bassin d’Arcachon and is predominated by pine trees, Pinus pinaster, at 89 % of the area and 11 % of open urbanised area close to the lagoon. Two stations, i.e. one upstream and one downstream of the forest area of 2490 ha were equipped with ultrasonic probes for continuously monitoring water height that were connected to Datataker DT50 (Dymelco) for data storage. From 1996-1999 these stations were sampled on a weekly basis for physicochemical parameters. After 1999, both station were also equipped with the same automatic samplers that were
programmed to take samples after a constant volume had passed, with refrigerated sample storage. These samples were collected and analysed on a biweekly basis from 2000 onwards.
Pluviometric data for the hydrological subunits were obtained from Météo France. The mean value of the meteorological stations located in Biganos and Mérignac were used for the
Tagon subunit, and the mean value of meteorological stations located in Belin-Beliet, Saint-Symphorien, Pissos and Sore were used for the Arriou subunit. The latter value was also considered as representative for the entire catchment of the Leyre river.
Using the data from 1996 – 1999, the outputs of N from the hydrological subunits were used for upscaling to the total catchment sensu stricto and to calculate the respective
contributions of agriculture and forestry to the average annual N-loading in the lagoon. This is based on the assumption that N-abatement is neglectable in the river systems. Transport distances in the Leyre river until the outflow into the lagoon range between 0- 115 km corresponding to transport times of upto 5 days Furthermore, it assumes that agricultural and forestry practices were homogeneous throughout the catchment and that the monitored subunits are representative for the land use in the entire catchment. therefore, a typology of the hydrological subunits (2000) was done using land cover criteria and physical criteria caracterising each one of the 63 subunits (Rivet, 2000). Agricultural practices and forestry were analysed to identify main factors of environmental impact (Beuffe and Vernier,1999). These studies confirmed that the Tagon and Arriou II subunits were good representatives of land-use in the catchment. The output values were upscaled by using the surface areas calculated from the quantification of land use and occupation in the catchment (see above). The average areal contribution of forestry to N-loading was based on the measurements in the Tagon subunit. The average areal contribution of intensive irrigation agriculture was calculated from the Arriou II subunit by substracting the area and the N-loading of the forest in this subunit.
These data were further complemented with calculations based on N delivery from point sources including wastewater treatment plants and fishfarming activities, and cattle rearing to calculate the total N-loading into the lagoon (Leibreich et al., 2000).
The potential of denitrification was studied by combining field observations and
laboratory pilot experiments. In the catchment, the agriculture fields are drained and the outflow of the drain flows directly into collecting channels that connect with the rivers. Most often, crops are grown unto the borders of these fields. But, in some cases a buffer zone occurs between the cornfield and the collecting channels with a water table at 1 to 2 m below the field level. Such a buffer zone, which was located within the Arriou subunit, was equipped with two ground water samplers that were placed in between drains (minimum distance to drain 8 m) at 15 m and 24 m distance from the border of the cornfield in the flowpath of the groundwater table from the corn field to the collecting channel. The second sampler (24 m distance from the cornfield) was located at 1.8 m distance from the collecting channel. Groundwater samples were taken at
defined depths by suction, with sampling ports located at 1, 1.5, 2, 3, 3.5 and 4 m depth. The samples were immediately stored at 4°C and transported to the laboratory for nutrient analyses. Within the same buffer zone, sand was collected at 1 to 2 m depth that was used to fill 70 l reactors for laboratory denitrification studies. The experimental pilot is depicted in Fig. 2. The sand in the reactor was saturated with water simulating conditions of the aquifer in the catchment and was percolated by solutions of approximately 100 mg l-1 NO3- (1.6 mM) and different
concentrations of sodiumproprionate (NaC3H5O2) as a model for DOC. All conditions were
assayed in duplicate, i.e. the same reservoir was used as the input for two reactors that were run in parallel. The solutions were made in tap water and pH was adjusted to 5.8 by adding H2SO4.
The reactors were percolated from the reservoir by gravity-driven flow, which resulted in linear flow rates ranging from 0.03 to 0.14 m day-1. Experiments were performed in a temperature-controlled room (20 °C). The outflow was regularly collected in ice-cooled recipients and analysed for nitrate concentrations. Nitrate concentrations were also regularly measured in the reservoir.
N fluxes in the Leyre river were obtained from monitoring of N-compounds and water flow in water at the Lamothe station close to the Leyre outflow in the Bassin d’Arcachon. Most data correspond to the SIBA-IFREMER sampling programme based on biweekly sampling, but some missing data were obtained from the RNB data base (11 samplings per year).
DIN concentrations in the water column of the lagoon were taken from the
SIBA-IFREMER sampling programme at the le Tès station in the Bassin d’Arcachon (see Fig. 1). This station is considered to be a good representative of the water mass of the Southern part of the lagoon as it is located at the confluent of the Chenal du Teychan and Chenal de Gujan, which are the major tidal channels in this part of the lagoon. Sampling was biweekly and alternating
samplings at high and low tides.
Short-term nitrate-uptake experiments were performed with leaves of the seagrass
Zostera noltii Hornem. and with thalli of the macroagae Monostroma obscurum (Kützing) J.
Aghard and Enteromorpha clathrata. Samples were taken at the locations and dates indicated in the legend of Fig. 9. The samples, i.e. sediment cores with Z. noltii and thalli of M. obscurum and
E. clathrata were stored in 400 l fiberglass pools with continuous renewal of seawater (dilution
rate approximately 0.2 h-1) placed in a greenhouse with nearly natural light conditions. Z. noltii plants were cut at the base of the stems. The leaves and thalli were carefully rinsed under flowing seawater to separate them from animals, detritus and other plants. Serum bottles were filled with
250 ml lagoon water sampled at the rade d’Eyrac and a portion of plant material (corresponding to 0.13 – 0.18 g DW) was added. These bottles were preincubated overnight in darkness at the temperature selected for the experiments. Nitrate was added from a 1.125 mM NaNO3 solution
corresponding to NO3- amendments of 0, 5, 10, 20 and 40 µM. Bottles were incubated in the light
(30 µmol photons m-2 s-1 of cool white light) and in darkness. Nitrate uptake rates were calculated from the linear decrease of nitrate concentrations measured at t= 0, 1, 2 and 3 h of incubation. Each condition was assayed in triplicate. Experiments were performed at four
different temperatures and all experiments were achieved within five days after sampling. Kinetic parameters Vmax and Km were estimated using the direct linear plot technique (Eisenthal and
Cornish-Bowden, 1974)
DIN concentrations were analysed colorimetrically according standardised techniques (Aminot and Chaussepied, 1983). Total nitrogen was assayed on whole water samples following acidic digestion and mesured according the Kjeldahl technique (Aminot and Chaussepied, 1983). Organic nitrogen was calculated as the difference between total nitrogen and DIN. Hence,
organic nitrogen comprised DON and PON. Plant and algal dry weight were assayed after several rinsings. First the material was rinsed with abundant seawater to clean it from other plants, detritus and animals. Afterwards a rapid rinsing was done in running tap water and the material was dried at 60 °C until constant weight (at least 48 h).
Results
Land use in the catchment and N fluxes
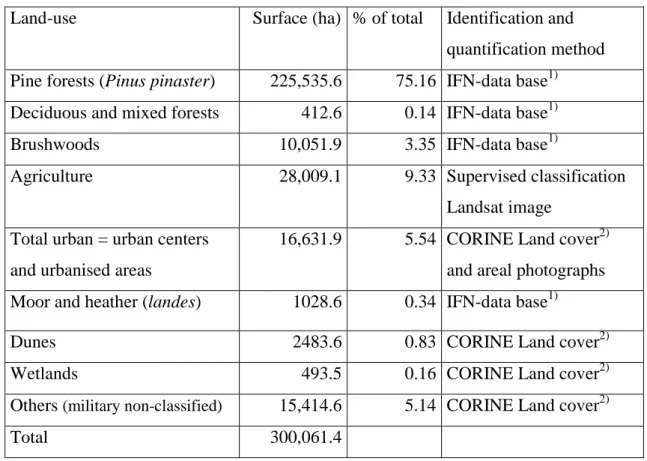
Land use in the 3001 km2 catchment of the Bassin d’Arcachon is listed in Table 1. The area is largely dominated by woods (2360 km2, 78.6 % of the total) of which pine forests (Pinus
pinaster L.) are predominant (2255 km2, 75.2 % of total). This highlights the change in the catchment since the early 1800’s when the catchment was predominated by moors, heather, wetlands (collectively designated as landes in French) and dunes. These ecosystems nowadays occupy only 40 km2, which is less than 1.4 % of the surface. Agriculture surface was quantified from a Landsat image of 1998 and found to be equivalent to 280 km2, which is 9.33 % of the surface. The main cultured crop is corn, and other crops include carrots, beans, potatoes, tomatoes, asparagus, and leek. Agricultural practices are homogeneous in the area (Beuffe and Vernier, 1999). The area occupied by agriculture is quite stable since 1998, because conversion of woods to agricultural fields was subjected to regulation measures and has been limited this way.
Yearly averages of N-output specified for NO3-, NO2-, NH4+ and organic nitrogen (DON
+ PON) through streams for the two small subunits Tagon (2490 ha) and Arriou II (2322 ha) and annual rainfall are depicted in Fig. 3 for the period 1996-2002. This seven-year period was characterised by the period 1996-1999 when annual rainfall showed minor fluctuations, while the period 2000-2002 included the particularly wet year 2000 and two dry years, i.e., 2001 and particularly 2002. Data from the period 1996-1999 have been used for upscaling. Therefore, we have calculated average values and coefficients of variations (C.V.) separately for that 1996-1999 period and the entire 1996-2002 period, respectively, and the results are reported in Table 2. Despite the fact that the area of both subunits is quite similar, the average N-output of the Arriou II subunit is 6 to 8 times higher than of Tagon, which is explained by the output from the 702 ha of agriculture. The difference for DIN is even much higher i.e. a factor of 16 to 19. There were significant fluctuations between years (see Fig. 3), which are reflected by C.V. (1996-2002) for all N-compounds of around 50 % for both Arriou II and Tagon. A part of this variation can be explained by rainfall, which showed positive correlations with output of NO3-, DIN and total N in
both basins (see Table 2).
A typology of the catchments using different land cover and physical criteria caracterised the 63 subunits in five homogeneous groups including Tagon and Arriou ( Rivet, Vernier,2000). Tagon can be considered as representative of forested subunits, and Arriou of mixed agriculture-forestry subunits. Hence, the specific contribution of agriculture-forestry to N-loading was calculated from
the 1996-1999 data in the Tagon subunit measured excluding the urbanised area close to the lagoon and the average obtained was equal to 1.59 kg N ha-1 yr-1. The contribution of agriculture to N-loading was obtained from the 1996-1999 data of the Arriou II subunit by subtracting the area occupied by forestry with an assumed areal contribution of N-loading obtained from the Tagon data; accordingly, agriculture contributes on average 41.63 kg N ha-1 yr-1. The
composition of this N-loading is shown in Fig. 4. Hence, on an areal basis, agriculture
contributes 26 times more total N than forestry. Moreover, the output of N from agriculture into channels and streams is dominated by DIN mainly as NO3- (90 % of total), while forest output is
dominated by organic N (65 %), with NO3- representing less than 25 %.
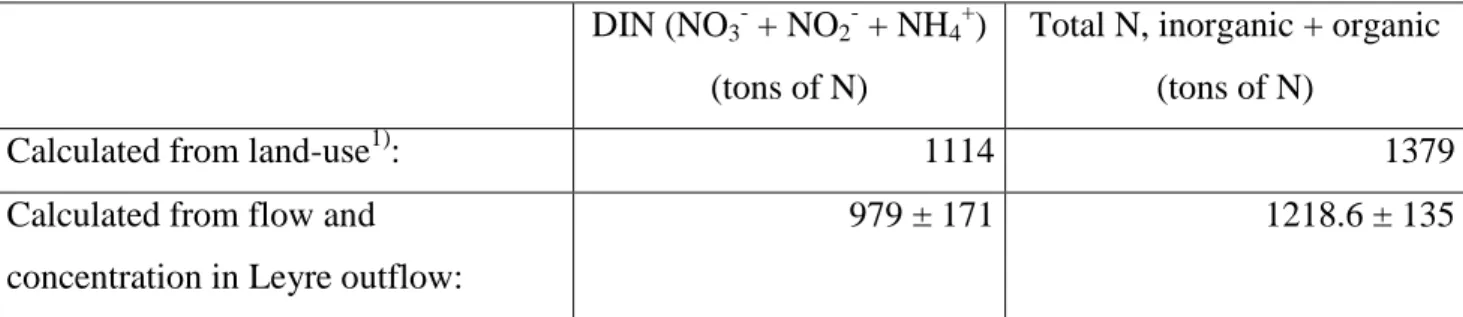
These data were upscaled to the whole catchment by multiplying these areal contributions with the surface areas for both categories (see Table 1). To these values have been added 22 tons of N from wastewater treatment plants and 54 tons of N due to fish-farming (Leibreich et al., 2000). The values are reported in Table 3. The upscaling exercise was validated by comparing the N-loading for the catchment of the Leyre river with the values calculated from monitoring data of water flow and N concentrations close to the outflow of the Leyre into the lagoon. This comparison is reported in Table 3, which also reports the averages and ranges of water flow in the Leyre river. The upscaling approach gives a result that is very close, albeit slightly higher than has been calculated at the Leyre outflow from the monitoring data; i.e. the differences were about 13 % for both DIN and total N. This confirms that very few N is retained in the channels, streams and rivers and that this upscaling approach is valuable for this specific area.
The annual loading of N into the lagoon from the Leyre river recorded for the period 1996-2002 is depicted in Fig. 5. The period 1996-1999 showed remarkably low interannual variability (C.V. of total N 11.0 %), while considering the entire 1996-2002 period again added variability related to wet and dry years (see Table 3). This flux correlated strongly with the annual rainfall (0.898, n = 7).
Dinitrification potential in the catchment
On 21 June 2000 the groundwater from the sampler close to the cornfield in the buffer zone showed a concentration peak of NO3- of 28 mg N l-1 (2 mM) at 2 m depth, while the rest of
depth showed values lower than 0.34 mM. The peak indicates the input of nitrate from fertiliser into the groundwater, and such peaks were regularly observed at 1.5-2 m depth in this sampler. The sampler located further away from the cornfield showed on 21 June 2000 concentrations of NO3- below 0.05 mM throughout the profile. This is a clear indication that nitrate abatement due
to denitrification takes place below ground in the water-saturated layers. However, it is very difficult to quantify the water flows and the total mass of nitrate subjected to abatement in situ, because most of the waterflow from the cornfield to the collecting channel was short-circuited by the drainage system and did not pass through the ground water. To better approach the process times and the influence of major driving factors on the denitrification kinetics, we evaluated the potential of denitrification in a laboratory pilot study.
The pilots were fed with about 100 mg NO3- l-1 (1.3 mM) and different DOC
concentrations and run at 20 °C. Figure 6 gives the average nitrate concentrations in the inflow and outflow for the different DOC additions after stabilisation of the system. Nitrate abatement was less than 10 % when no DOC was added in the water, the nitrate abatements were about 20 % and 60 % at 15 mg l-1 DOC and 25 mg l-1 DOC, respectively. Hence, the sand soil of les
Landes has the clear potential for denitrification. However, organic matter is needed to fuel this
process and the amounts of OC in clean soils may be insufficient.
Interannual and seasonal variation of environmental conditions in the Bassin d’Arcachon
Figure 7 shows the variations of water column temperature and of NO3- + NO2
-concentrations in the tidal channel at the Le Tès monitoring station and Fig. 8 shows the
variations of the monthly averaged solar irradiance at the metereological station in Arcachon for the period 1996-2002. The average concentration of NO3- + NO2- was 6.2 µM and the values
ranged from undetectable to 49.8. The average concentration of NH4+ and of PO43- were 1.29 µM
and 0.16 µM, respectively, and the values ranged from undetectable for both compounds to 6.5 and 1.3 for NH4+ and of PO43-, respectively. The DIN:DIP molar ratio was on average 60.3,
ranged from 0 to 551, and were clearly not normally distributed (SD= 88). Thus, on average N was in excess to P with respect to the Redfield ratio (N:P = 16). The sum of NO3- + NO2- is
mainly NO3-, which was checked by considering the 1998 data of Eyrac located in the same tidal
channel downstream, where it was found that NO2- was on average 5 % of NO3- concentrations
(Service d’Observation en Milieu Littoral de l’OASU, UMR EPOC & UMS 2567). Hence, DIN was predominated by NO3- in the le Tès station. Nitrate concentrations were high during the
winter periods often between 10 and 40 µM, with the exception of the winter in 2002 when nitrate never exceeded 10 µM. Nitrate became depleted from the water column during spring periods and remained very low during summer into autumn. However, the time of nitrate depletion was quite variable between years; i.e., early depletion (early April) was observed in 1996 and 1997, and late depletion (end of May) was observed in 1998, 2000 and 2001; 1998 was intermediate. NO3-. Temperatures fluctuated between 8 and 25 °C, with an exceptionally high
26.6 °C end of July 1997 and a value of 3.1 °C mid-December 2001. The year 2002 was both very dry (see above) and also rather cold in summer related to low radiant fluxes in June and July.
N uptake by Zostera noltii and macroalgae in the Bassin d’Arcachon
Figure 9 shows the specific nitrate uptake rate of Zostera noltii leaves, and thalli of
Monostroma obscurum and Enteromorpha clathrata measured at 40 µM initial NO3- and
different incubation temperatures. E. clathrata is typically adapted to higher temperatures and was blooming in the Bassin d’Arcachon by the end of July 2001, when it showed maximum uptake rates at 25 °C. In contrast, M. obscurum showed maximum rates between 10 and 20 °C, it still showed nitrate uptake at 25 °C albeit at a lower rate. For Z. noltii leaves the uptake rate was maximal at 15 °C; although this maximum appeared to be adapted to the growth temperature as it shifted upwards for samples taken later during the season (data not shown). The NO3- uptake rate
of E. clathrata increased linearly with the initial NO3- concentration until 40 µM (highest
concentration tested). In contrast, both M. obscurum thalli and Z. noltii leaves showed saturation of uptake rates, which were nearly maximal at 40 µM of NO3-. For both species the uptake could
be described by Michaelis-Menten kinetics, with for M. obscurum a Km of 13.2 µM ± 2.6 µM
(SD) and for Z. noltii a Km of 6.7 ± 4.5 µM (data lumped, because there was no clear trend for
temperature). At 15 °C, the Vmax values were 11.7 and 7.25 µmol g-1 h-1 for M. obscurum thalli
and Z. noltii leaves respectively. The uptake curves intercept and while Z. noltii is competitive at low NO3- concentrations, M. obscurum has a clear competetive advantage at high NO3- (roughly
above 10 µM).
Discussion
Based on the upscaling from land-use activities and using the average values for the period 1996-1999, the average annual N-loading entering the lagoon through rivers and streams equals 1616 tons of total N of which 1270 (79 %) as DIN. The Leyre river contributed 85 % of total N and 81 % of DIN for the riverine inputs. For the Leyre catchment, the upscaling was validated by comparing the calculated values with the calculations obtained from the water flow and concentration measurements in the outflow of the Leyre into the lagoon. The values were remarkably similar, as only 13 % lower values were obtained by the latter method for both DIN and total N. An obvious uncertainty for upscaling is possible heterogeneity of land use in the
catchment and the representativity of Tagon and Arriou II basins. However, a careful analyses (Rivet and Vernier, 2000) has highlighted the striking homogeneity of land-use in this catchment and shown that the Tagon can indeed be considered as representative of forested subunits, and Arriou of mixed agriculture-forestry subunits. Thus, the small difference between the value calculated from the upscaling and the measured fluxes in the Leyre outlet indicate that N is virtually not retained in the river and streams. This is partly explained by the short residence time of water in the river system (1 to 5 days, see Materials and Method section). In addition, the Leyre river and the smaller tributaries are all characterised by sandy bottoms, well-oxygenated and dark-colored waters due to humic substances and have large sections shaded by riverine forests. Therefore, they are characterised by extremely low aquatic primary production and biofilms are not important. These features explain the virtual absence of N abatement in these lowland rivers.
Nitrogen also enters the lagoon through groundwater flow and from atmospheric
deposition; for coastal ecosystems the latter input source is receiving increasing attention at the global level related to anthropogenic activities (e.g. Seitzinger et al., 2002). Previously, DIN inputs from groundwater and atmospheric deposition have been quantified to be equal to 7 tons and 80.5 tons, respectively (Rimmelin et al., 1998) the sum of which is less than 7 % of the calculated DIN loading entering the lagoon through rivers and streams. The very low value for DIN input from groundwater flow has been attributed to low flow velocities related to shallow slope of the groundwater table and due to nitrate abatement by denitrification (Rimmelin et al., 1998). Interestingly, our study confirmed the clear potential for denitrification of these sand soils from Les Landes. From the data by Rimmelin et al (1998) it can be calculated that averaged atmospheric deposition in the lagoon is 520 kg N km-2 year-1, which is a bit higher than the predicted 250-350 kg N km-2 year-1 according the global map presented for 1990 (Seitzinger et al., 2002). However, the atmospheric N-deposition in the lagoon is still low in this Atlantic lagoon due to the prevailing western winds and is of minor importance with respect to the riverine loading. The lagoon also receives freshwater inputs through channels from the two regulated dune lakes (see section Study Area) and the corresponding annual N-loading has been previously estimated to equal 27 tons of total N in 1990 (Auby et al., 1994), which is a small amount with respect to the N loading from rivers and streams.
Because all the other N inputs are of minor importance with respect to the loading entering the lagoon through rivers and streams, it becomes clear that the N-loading to the lagoon is very strongly dependent on land-use in the catchment. Currently, agriculture in the catchment is the main contribution to N-loading in the lagoon; despite the fact that it only occupies 9.3 % of
the surface this activity contributes 85 % of the DIN loading and 78 % of the total N loading entering the lagoon through rivers and streams. This is explained by the fact that on an aerial basis, N-output from agriculture exceeds N-output from forestry by a factor of 26. Furthermore, N-output from agriculture is dominated by NO3- (90 % of total N), while forestry delivers mainly
organic N with NO3- representing less than 25 % (see Fig. 4).
The seven-year data series allowed to estimate the interannual variability of the riverine N-loading. For the small subunits, the coefficient of variation for all N output variables were about 50 % both in the Tagon basin and in the Arriou II basin (see Table 2), while for total N flux at the outflow of the Leyre we found a C.V of 37 % (see Table 3). It seems that we can therefore assume a C.V. of annual riverine N loading of 35-50 %, which gives a measure of interannual variability. Assuming that the N-loading calculated from land use has been overestimated by 13 %, assuming that N-loading is normal distributed and applying a conservative C.V. of 40 % it can be estimated that for 67 % of the years total N loading is between 843 to 1968 tons of TN, which corresponds to an average N-loading in the lagoon of 90 kg ha-1 yr-1 with a range of 54 to 126 kg ha-1 yr-1. This is a significant higher loading than the average 46 kg N ha-1 year-1 reported for Waquoit Bay (Valiela et al., 1997b; Hauxwell et al., 2003) where Zostera marina prairies have disappeared in most places and been replaced by macroalgal blooms. On the other hand, for the very eutrophic Italian lagoon Sacca di Goro, N loading of 600-800 kg ha-1 yr-1 has been reported (De Wit et al., 2001). A large part of the interannual variability can be explained by rainfall precipitation, i.e. the correlation coefficients of N-fluxes and rainfall varied from 0.536 (total N output of Tagon) to 0.898 (total N-flux in the Leyre outflow). However, in the catchment the relation between precipitation and N-output is not straightforward and conceivably a certain part of the N output cannot be directly explained by precipitation. In some cases, the water outflow is not directly linked to precipitation, as for example after a period of dryness, most of the rainfall will be retained in the catchment and contribute to a rise of the groundwater level. Mathematical modeling is currently being developed to understand and predict these non-linear effects at the catchment level.
The N-loading for the period 1996-1999 is slightly higher than has been reported for the period 1989-1994 (Auby et al., 1994), i.e. 1616 compared to 1441-1555 tons of N-total and 1270 compared to 816-1005 tons of DIN. However, these values are fully comparable if the
interannual variability is taken into account. It thus appears that after a steady increase of N-loading with time from 1970-1990 (Auby et al., 1994), the N-N-loading has now stabilised and variations are mainly due to interannual variability. This is the fruit of the policy measures taken
to limit conversion of woods into agriculture. Thus, the estimated area occupied by agriculture in 1990 was 30,056 ha., which compares with the surface of 28,009 ha quantified for 1998.
Waterlogged sand soils of les Landes have a clear potential to denitrify as was shown in the pilot experiments. However, an input from organic matter is requested. In the pilot
experiments we used sodiumpropionate (NaC3H5O2). The net equation for denitrification of
sodiumpropionate is:
5 C3H5O2- + 12 NO3- + 7 H+ -> 15 CO2 + 6 N2 + 16 H2O
Hence, five propionate ions are needed to convert twelve nitrate ions into dinitrogen gas. To denitrify 100 mg of nitrate, this corresponds to a DOC demand of 49 mg, which explains why dentrification was still limited at a DOC addition of 30 mg l-1.
At present, agricultural land use in the catchment is very inefficient with respect to using the potential of denitrification for nitrogen abatement as most of the agricultural drains and runoff enters the collecting channels and streams directly. Most often the agricultural fields are well-drained and exploited for crops to the borderline of the collecting channel, a buffer zone is only seldomly observed. The flowing surface waters are well oxygenated and on a yearly basis do not show nitrogen abatement (Leibreich et al., 2000). We propose that land-use can be better designed to reduce the nitrogen loading. For example the runoff and drainage water can be collected in channels and wetland zones where it can be forced to travel belowground before entering the river system. Nevertheless, this is difficult to put into practice in the context of Les
Landes, because of the shallow slopes and consequent low flow velocities of groundwater. On
the other hand surface is available and relatively cheap in this area to create artificial wetland systems.
The nitrogen loading into the lagoon is reflected by the winter nitrate concentrations in the lagoon as observed at the le Tès monitoring station (see Fig. 7). During winter, nitrate
concentrations peaked at 20-40 µM, with the exception of early 2002, which was a very dry year. As a result of the high winter DIN concentrations, a part of the dissolved nitrogen in the lagoon will be evacuated to the ocean by flushing. The estimated flush times were 27 to 146 days (see section Study Area). Assuming a winter DIN concentration of 30 µM for the outflowing water a wintertime DIN export to the ocean of 27 to 150 tons of N month-1 can be estimated. This is a very coarse estimate that needs to be refined using hydrodynamic modelling. The estimated value is low with respect to the annual DIN loading but not negligible considering that high DIN concentrations may persist for periods of two to five months.
Nitrate concentrations became depleted from the water column every year during spring, but this was variable between years. The depletion is mainly related to growth and corresponding N-uptake by the seagrasses Z. noltii and to a lesser extent by Z. marina that occupy 70 km2 and 0.43 km2 in the lagoon, respectively (Auby and Labourg, 1996). In some years Monostroma
obscurum also contributes significantly to primary production and nutrient uptake (Auby et al.,
1994). This algal species is well adapted to the spring temperatures (10-16 °C), cf. Fig. 7 and 9). The nitrate uptake kinetics indicate that M. obscurum is competitive with respect to Z. noltii when the nitrate concentrations exceeds 10 µM. However, growth of M. obscurum is strongly regulated by irradiance (Auby et al., 1994). Spring conditions with high nitrate and high
insulation are therefore favourable for M. obscurum and this species presents a high risk for algal blooming in this lagoon. Therefore, we checked when the water column nitrate concentrations decreased below 10 µM and also reported the average water temperature and monthly irradiance in the month prior to this date in Table 4. This gives a very good indication of the potential for
M. obscurum to proliferate in the lagoon. Accordingly, 1998, 2000 and 2001 were years that
were favorable for blooming of M. obscurum, because the period of NO3- concentrations above
10 µM lasted until mid or end May and the species could thus benefit from a longer growth period and higher irradiances. Among these years, 2000 was particularly wet and characterised by high N-loading, while 1998 and 2001 were close to average values for N-loading (cf. Fig. 5). In contrast to M. obscurum, the macroalga Enteromorpha clathrata is very well adapted to summertime temperatures around 25 °C. This species forms occasionally blooms in the lagoon; but, this phenomenon is limited due to the low summer nitrate concentrations.
Acknowledgements
This study was supported by the Ministry of Ecology and Sustainable Development (MEDD, Paris) contract LITEAU, LT 99064. The hydrological monitoring programme in the Bassin d’Arcachon and in the Leyre outflow were financed by the Syndicat Intercommunal du Bassin d’Arcachon (SIBA) and operated in collaboration with IFREMER. This is a contribution to the ELOISE (European Land Ocean Interaction StudiEs) network and has been attributed the ELOISE publication number:
References
Aminot, A., and Chaussepied, M. 1983. Manuel des analyses chimiques en milieu marin. CNEXO, Brest
Auby I., and Labourg, P.J. 1996. Seasonal dynamics of Zostera noltii Hornem in the Bay of Arcachon (France). J Sea Res 35: 269-277
Auby, I., Manaud, F., Maurer, D., Trut, G. 1994. Etude de la prolifération des algues vertes dans le Bassin d'Arcachon. Report IFREMER, Arcachon, 162 pp.
Beuffe, H., and Vernier, F. Soil occupation and water quality in the sandy " Landes de Gascogne " ecosystem. Agriculture and the Environment: Challenges and Conflicts for the new Millenium, University of Warwick, GBR, 14-16 April 1999, 1999, p. 74-82
[Publications:99/1021]
Bouchet, J-M., Deltreil, J-P., Manaud, F., Maurer, D., Trut, G. et al. 1997. Etude intégrée du Bassin d’Arcachon. Volume 1. Report IFREMER, Arcachon, 185 pp. + annexes De Wit, R., Stal, L.J., Lomstein, B. Aa., Herbert, R.A., Van Gemerden, H., Viaroli, P., et al.
2001. "ROBUST: The ROle of BUffering capacities in STabilising coastal lagoon ecosystems. Continental Shelf Research 21, 2021-2041
Duarte, C.M., 1995. Submerged aquatic vegetation in relation to different nutrient regimes; Ophelia,
41, 87-112
Eisenthal, R., and Cornish-Bowden, A. 1974. The direct linear plot. A new graphical procedure for
estimating enzyme kinetic parameters. Biochem. J. 139, 715-720
Flindt, M.R, Pardal, M.A., Lillebø, A.I., Martins, I. and Marques, J.C., 1999. Nutrient cycling and
plant dynamics in estuaries: a brief review. Acta Oecologica 20, 237-248
Hemminga, M.A., 1998. The root rhizome system of seagrasses: an asset and a burden. J Sea Res 39,
183-196
Leibreich, J., Beuffe, H., Delmas, F., Laplana, R., and Vernier, F. 2000. Programme TERRA; mise au point d’indicateurs pour l’aide à la décision en matière de gestion des espaces d’influence du Bassin d’Arcachon. Report CEMAGREF, Bordeaux 79 pp. + 24 annexes Monsen, N.E., Cloern, J.E., Lucas, L.V., and Monsmith, S.G. 2002. The use of flushing time,
Rimmelin, P., Dumon, J.-C., Maneux, E., and Gonçalves, A., 1998. Study of annual and seasonal dissolved inorganic nitrogen inputs into the Arcachon lagoon, Atlantic coast (France).
Estuar. Coast. Shelf Sci., 47, 649-659
Rivert A., and Vernier, F. 2000. Watersheds typology of the Arcachon basin hydrological area - Report CEMAGREF BORDEAUX ADBX
Salomon, J-C., and Breton, M. 1995. Arcachon – l’hydrodynamique par la modélisation
mathématique. Rapport provisoire IFREMER/DEL/HS12-96, Brest, 23 pp. + 54 fig.
Sargos, J. 1997. Histoire de la Forêt Landaise, Du désert à l’âge d’or. l’Horizon chimérique, Bordeaux, 559 pp.
Seitzinger S.P., Kroeze, C., Bouwman, A.F., Caraco, N., Dentener, F., and Styles, R.V. 2002. Global patterns of dissolved inorganic and particulate nitrogen inputs to coastal systems: recent conditions and future projections. Estuaries 25, 640-655
Valiela, I., Collins, G., Kremer, J., Lajtha, K., Geist, M., Seely, B., Brawley, J., and Sham, C.H.
1997b. Nitrogen loadings from coastal watersheds to receiving estuaries : new mathod and
application. Ecological Applications 7 35_-380
Valiela, I., McClelland, J., Hauxwell, J., Behr, P.J., Hersh, D., Foreman, K., 1997a. Macroalgal
blooms in shallow estuaries: Control and ecophysiological and ecosystem consequences.
Limnol. Oceanogr. 42, 1105-1118
Vernier, F. Trut, G., and Maurer, D. 2002. Inventory and modelling of data with UML (Unified Modelling Language) to build a geographic and thematic information system for the Arcachon Bay Colloque Géo- événement 14ème rencontre européenne de la géomatique, Paris, 9-11 avril 2002
Tables
Table 1 Classification of land use in the catchment of the Bassin d’Arcachon (see Fig. 3) with surfaces and percentages of total area for the different classes
Land-use Surface (ha) % of total Identification and quantification method Pine forests (Pinus pinaster) 225,535.6 75.16 IFN-data base1) Deciduous and mixed forests 412.6 0.14 IFN-data base1)
Brushwoods 10,051.9 3.35 IFN-data base1)
Agriculture 28,009.1 9.33 Supervised classification Landsat image
Total urban = urban centers and urbanised areas
16,631.9 5.54 CORINE Land cover2) and areal photographs Moor and heather (landes) 1028.6 0.34 IFN-data base1)
Dunes 2483.6 0.83 CORINE Land cover2)
Wetlands 493.5 0.16 CORINE Land cover2)
Others (military non-classified) 15,414.6 5.14 CORINE Land cover2) Total 300,061.4
1) Inventaire Forestier National (National Inventory of Forestry) of 1994 and 1998 held by the ONF-
2) CORINE land cover held by Institut Français de l’Environnement (French Institute of the Environment), Orléans, France
Table 2 Averaged values, standard deviations (SD) and coefficient of variation (CV) for annual rainfall precipitation, annual N output and correlation between N-output variables and rainfall in the hydrological subunits Arriou II and Tagon within the catchment of the
Bassin d’Arcachon (see Fig. 1). The Arriou II subunit of 2322 ha is mixed agriculture
(702 ha crops, mainly corn) and Pinus pinaster forestry, while the Tagon subunit of 2490 ha is predominated by Pinus pinaster forestry.
________________________________________________________________________
Arriou II – rain:
Annual N output as NO3-:
Annual DIN output: Annual total N output:
Tagon – rain:
Annual N output as NO3-:
Annual DIN output: Annual total N output:
1996-1999 mean and SD 1042 ± 57.7 mm 29,066 ± 9,236 kg 30,130 ± 9,692 kg 34,328 ± 10,642 kg 1052 ± 51.8 mm 1,081 ± 258 kg 1,552 ± 317 kg 4,277 ± 934 kg C.V. 5.5 % 31.8 % 20.4 % 31.0 % 4.9 % 23.9 % 20.4 % 21.8 % 1996-2002 mean and SD 1012 ± 155.1 mm 25,052 ± 12,832 kg 25,930 ± 13,297 30,554 ± 14,622 990 ± 183.2 mm 1,068 ± 550 kg 1,627 ± 781 kg 4,903 ± 2,532 kg C.V. 15.3 % 51.2 % 51.3 % 47.9 % 18.5 % 51.5 % 48.0 % 51.6 % --- Pierson correlation coefficient N-output versus rain precipitation (period 1996- 2002, n=7):
Arriou II Tagon
NO3- output vs rain: 0.8246 0.8716
DIN output vs rain: 0.8263 0.7497
Table 3: Water outflow from the Leyre river and average N-loading to the Bassin d’Arcachon (calculated over the period 1996-1999)
Water outflow from the Leyre river into the Bassin d’Arcachon:
Period 1996-1999 1996-2002
annual average of flow: 15.5 m3 s-1 18.5 m3 s-1 minimum of monthly-averaged flow: 4.63 m3 s-1 4.63 m3 s-1 maximum of monthly-averaged flow: 47.2 m3 s-1 74.5 m3 s-1
average annual total N-flux*) 1218.6 tons 1158.1 tons S.D. of annual total N-flux 134.5 tons 422.5 tons C.V. of annual total N-flux 11.0 % 36.5 %
__________________________________________________________________________
Annual nitrogen loading to the Bassin d’Arcachon through the Leyre river, averaged values for the period 1996-1999*):
DIN (NO3- + NO2- + NH4+)
(tons of N)
Total N, inorganic + organic (tons of N)
Calculated from land-use1): 1114 1379
Calculated from flow and concentration in Leyre outflow:
979 ± 171 1218.6 ± 135
Annual nitrogen loading to the Bassin d’Arcachon from the catchment sensu stricto (see Fig. 1), averaged values for the period 1996-1999:
DIN (NO3- + NO2- + NH4+)
(tons of N)
Total N, inorganic + organic (tons of N)
Calculated from land-use1): 1270 1616
1) Assumptions: N-output flux for agriculture is 41.6 kg N ha-1 yr-1 (of which 38 kg DIN ha-1 yr-1) for forestry 1.59 kg N ha-1 yr-1 (of which 0.55 kg DIN ha-1 yr-1), cf. Fig. 4. To these values have been added 22 tons of N from wastewater treatment plants and 54 tons of N due to fish-farming (sturgeons and trouts).
*) Organic N data for 1996 and 1997 and DIN data for 1997 were obtained from RNB (11 samplings per year); the rest of the data were obtained from the SIBA-IFREMER monitoring programme (biweekly sampling)
Table 4: Relevant events and parameters in spring predicting the competitive success of
Monostroma obscurum in the Bassin d’Arcachon for the period 1996-2002. Date after
which the water column concentrations of NO3- + NO2- dropped below 10 µM
(event), the period before is characterised by concentrations > 10 µM; the radiant flux in the month before the event; the average water temperature in the month before the event. Hydrological data from the Le Tès monitoring station (cf. Fig. 7) and radiant flux values from the metereological station of Météo-France at Arcachon (cf. Fig. 8).
Year Date after which NO3- dropped < 10 µM
Radiant flux in month before event (KJ cm-2 month-1) Average water temperature (°C) in month before event 1996 29 March 43.3 10.3 1997 4 April 43.8 10.6 1998 19 May 52.3 13.9 1999 8 April 38.9 12.5 2000 25 May 62.1 16.6 2001 14 May 52.4 14.5
Legends to Figures
Fig. 1 Map of the study area: the Bassin d’Arcachon coastal lagoon and its catchment of 3001 km2.
Fig. 2 Experimental unit used to study the potential of denitrification of the sandy soils in the catchment. All conditions were assayed in duplicate, i.e. the same reservoir was used as the input for two reactors that were run in parallel (only one reactor depicted).
Fig. 3 Record of annual rainfall precipitation (upper panels) and annual N output and correlation between output variables (lower panels, see insert for legends of
N-compounds) in the hydrological subunits Arriou II (left panels) and Tagon (right panels) within the catchment of the Bassin d’Arcachon (see Fig. 1). The Arriou II subunit of 2322 ha is mixed comprising agriculture (i.e. 702 ha, crops mainly corn) and forestry, while the Tagon subunit of 2490 ha is predominated by Pinus pinaster forestry. Note the difference of scale for N-output.
Fig. 4 Averaged proportions (1996-1999) of the different nitrogen forms (organic nitrogen, NH4+, NO2- and NO3-, see legend in figure) in the output of the hydrological subunits
Arriou II and Tagon within the catchment of the Bassin d’Arcachon (see Fig. 1). The Arriou II subunit of 2322 ha is mixed comprising agriculture (i.e., crops mainly corn) and forestry, while the Tagon subunit of 2490 ha is predominated by Pinus pinaster forestry.
Fig. 5 Annual flux of DIN and total N at the outflow of the Leyre river into the Bassin
d’Arcachon, calculated from water flow and concentrations. Organic N data for 1996
and 1997 and DIN data for 1997 were obtained from RNB (11 samplings per year); the rest of the data were obtained from the SIBA-IFREMER monitoring programme (biweekly sampling)
Fig. 6 Concentrations of NO3- (mg of nitrate/l) in the reservoir (hatched bars) and the output
after passage through the 70 l pilot reactor (open bar) at different COD concentrations (sodiumproprionate, NaC3H5O2). Experiments were run in duplicate (two reactors fed
Fig. 7 Concentrations of NO3- + NO2- and temperature in the water column of the le Tès
monitoring station located in the Bassin d’Arcachon (see Fig. 1). Samples were taken at a biweekly basis, alternating samplings at high and low tides (SIBA-IFREMER
monitoring programme).
Fig. 8 Monthly radiant flux at the metereological station of Météo France in Arcachon, close to the Bassin d’Arcachon lagoon.
Fig. 9 Specific nitrate uptake rates at an initial NO3- concentration of 40 µM, for samples of
Zostera noltii leaves (sampled on 14 May 2001, at station A on Ile aux Oiseaux, water
T= 16.5 °C), Monostroma obscurum thalli (sampled on 18 June at the intertidal flats close to the Pré Salés Est, La Teste de Buch, water T = 20 °C) and of Enteromorpha
clatratha thalli (sampled on 27 July 2001 in the Rade de Eyrac, water T= 26 °C)
Bassin d’Arcachon
Tidal channels
and sand banks Leyre river
Outflow of Leyre river into Bassin d’Arcachon lagoon
N
S
E
W
De Wit et al.- Fig. 1
Le Tès, hydrological
monitoring station
Tagon hydrological subunit
Arriou hydrological
subunit 49.6 °N
De Wit et al.- Fig. 2
Waterlogged sand soil (70 l)
Reservoir
pH = 5.8
NO
3-= 100 mg l
-1Valve to
chase air
outlet
Waterlogged sand soil (70 l)
Reservoir
pH = 5.8
NO
3-= 100 mg l
-1Valve to
chase air
outlet
De Wit et al.- Fig. 3 0 25000 50000 1966 1997 1998 1999 2000 2001 2002 N o u tp u t (k g /y e a r ) 0 5000 10000 1966 1997 1998 1999 2000 2001 2002
Tago n (pin e forest)
0 500 1000 r a in fa ll ( mm)
Arriou II (agriculture and pin e forest)
0 500 1000 r a in fa ll (m m ) N org N-NH4+ N-NO2 -N-NO3
-De Wit et al.- Fig. 4
0%
20%
40%
60%
80%
100%
Contribution of agriculture
(Arriou II): 41.63 kg N ha
-1yr
-1)
Contribution of forestry
(Tagon): 1.59 kg N ha
-1yr
-1)
N org
N-NH
4+N-NO
2-N-NO
3-0%
20%
40%
60%
80%
100%
Contribution of agriculture
(Arriou II): 41.63 kg N ha
-1yr
-1)
Contribution of forestry
(Tagon): 1.59 kg N ha
-1yr
-1)
N org
N-NH
4+N-NO
2-N-NO
3-N org
N-NH
4+N-NO
2-N-NO
3-0 500 1000 1500 1996 1997 1998 1999 2000 2001 2002 year
N flux (tons of N/year)
N org DIN
105
103
92
100
82
38
93
80
36
0
20
40
60
80
100
120
0
15
25
DOC Addition (mg l
-1)
nitr
ate (mg l
-1)
De Wit et al.- Fig. 6De Wit et al.- Fig. 7 0 10 20 30 01/01/96 01/01/97 01/01/98 01/01/99 01/01/00 01/01/01 01/01/02 W a te r T (° C ) 0 20 40 60 01/01/96 01/01/97 01/01/98 01/01/99 01/01/00 01/01/01 01/01/02 Y ear NO 3 - + N O2 - (µ M ) 1996 1997 1998 1999 2000 2001 2002
De Wit et al.- Fig. 8 0 10000 20000 30000 40000 50000 60000 70000 80000 90000 1996 1997 1998 1999 2000 2001 2002 Year
Radiance Flux (J cm-² month-1)
De Wit et al.- Fig. 9 0 10 20 30 40 0 20 40 temperature (°C) µmol/g/h Monostroma Zostera noltii Enteromorpha