HAL Id: hal-03183048
https://hal.inrae.fr/hal-03183048
Submitted on 26 Mar 2021
HAL is a multi-disciplinary open access
archive for the deposit and dissemination of
sci-entific research documents, whether they are
pub-lished or not. The documents may come from
teaching and research institutions in France or
abroad, or from public or private research centers.
L’archive ouverte pluridisciplinaire HAL, est
destinée au dépôt et à la diffusion de documents
scientifiques de niveau recherche, publiés ou non,
émanant des établissements d’enseignement et de
recherche français ou étrangers, des laboratoires
publics ou privés.
Distributed under a Creative Commons Attribution| 4.0 International License
Daily transcriptomes of the copepod Calanus
finmarchicus during the summer solstice at high Arctic
latitudes
Laura Payton, Celine Noirot, Claire Hoede, Lukas Hüppe, Kim Last, David
Wilcockson, Elizaveta A. Ershova, Sophie Valiere, Bettina Meyer
To cite this version:
Laura Payton, Celine Noirot, Claire Hoede, Lukas Hüppe, Kim Last, et al.. Daily transcriptomes of
the copepod Calanus finmarchicus during the summer solstice at high Arctic latitudes. Scientific Data
, Nature Publishing Group, 2020, 7 (1), �10.1038/s41597-020-00751-4�. �hal-03183048�
Daily transcriptomes of the
copepod Calanus finmarchicus
during the summer solstice at high
arctic latitudes
Laura Payton
1,2✉, Céline Noirot
3, Claire Hoede
3, Lukas Hüppe
1,2,4, Kim Last
5,
David Wilcockson
6, Elizaveta A. Ershova
7,8, Sophie Valière
9& Bettina Meyer
1,2,4The zooplankter Calanus finmarchicus is a member of the so-called “Calanus Complex”, a group of copepods that constitutes a key element of the Arctic polar marine ecosystem, providing a crucial link between primary production and higher trophic levels. Climate change induces the shift of C.
finmarchicus to higher latitudes with currently unknown impacts on its endogenous timing. Here we
generated a daily transcriptome of C. finmarchicus at two high Arctic stations, during the more extreme time of Midnight Sun, the summer solstice. While the southern station (74.5 °N) was sea ice-free, the northern one (82.5 °N) was sea ice-covered. The mRNAs of the 42 samples have been sequenced with an average of 126 ± 5 million reads (mean ± SE) per sample, and aligned to the reference transcriptome. We detail the quality assessment of the datasets and the complete annotation procedure, providing the possibility to investigate daily gene expression of this ecologically important species at high Arctic latitudes, and to compare gene expression according to latitude and sea ice-coverage.
Background & Summary
The copepod Calanus finmarchicus (Crustacea, Copepoda) is a key zooplankton species in the northern Atlantic food web as it converts sugars from algae into energy rich lipids that sustain higher consumers including marine fish larvae and seabirds1–3. Its high abundance and biomass also makes it an important contributor to ocean
carbon flux4. The species inhabits a large latitudinal range from ~40° up to 80° N5. However, recent findings
show that C. finmarchicus is undergoing temperature driven geographical shifts northwards because of climate change6–8, the effects of which are at their most extreme in the Northern Atlantic and Barents Sea. Therefore,
the copepods will experience a change between the photoperiods they are adapted to at lower latitudes and the extreme high-latitude photoperiods. Photoperiodic variation is particularly pronounced in the Arctic with rapid change over short latitudinal ranges. The impact of such extreme photoperiods on non-endemic species is unknown, and the northward expansion of organisms at high latitudes may be limited by the adaptive capacity of their endogenous timing systems to extreme photoperiods8,9.
Endogenous timing systems, or biological clocks, are ubiquitous ancient and highly adaptive mechanisms enabling organisms to track and anticipate environmental cycles and prepare biological processes accordingly10,11.
1institute for chemistry and Biology of the Marine environment, carl von Ossietzky University of Oldenburg, Oldenburg, 26111, Germany. 2Section Polar Biological Oceanography, Alfred Wegener institute Helmholtz centre for Polar and Marine Research, Bremerhaven, 27570, Germany. 3Plateforme bio-informatique GenoToul, MIAT, INRAE, UR875 Mathématiques et Informatique Appliquées Toulouse, F-31326, Castanet-Tolosan, France. 4Helmholtz Institute for Functional Marine Biodiversity (HIFMB) at the University of Oldenburg, Oldenburg, 26111, Germany. 5Scottish Association for Marine Science, Oban, Argyll, PA37 1QA, UK. 6institute of Biological, environmental, and Rural Sciences, Aberystwyth University, Aberystwyth, SY23 3DA, UK. 7Department for Arctic and Marine Biology, Faculty for Biosciences, Fisheries and Economics, UiT The Arctic University of Norway, Tromsø, N-9037, norway. 8Shirshov Institute of Oceanology, Russian Academy of Sciences, 36 Nakhimova Avenue, Moscow, Russian Federation, 117997, Russia. 9Plateforme Génomique, INRAE US 1426 GeT-PlaGe, Centre INRAE de Toulouse Occitanie, 24 Chemin de Borde Rouge, Auzeville, 31326, Castanet-Tolosan cedex, France. ✉e-mail: laura.payton@ uni-oldenburg.de
DATA DESCRipToR
opEN
www.nature.com/scientificdata
www.nature.com/scientificdata/
Since the identification of circadian clock genes in C. finmarchicus12, studies have shown that this species
pos-sesses a functional clock that might be involved in the timing of both diel and seasonal events, such as the eco-logically and biogeochemically important diel vertical migration (DVM)13 or diapause14. However, the Arctic
environment is characterized by dramatic seasonality resulting in permanent illumination during Midnight Sun and permanent darkness during Polar Night15. As the circadian clock is entrained and synchronized by daily
light/dark cycles, the persistence of daily biological processes in Arctic organisms during the absence of those remains uncertain16,17, as well as the consequences for newcomer species due to global warming8,9. Moreover,
the Arctic is characterized by strong fluctuations in sea ice-cover, reflecting on biotic and abiotic factors, such as species communities and interactions or light penetration18,19.
Copepods are among the important non-model invertebrates for which genomic resources are still limited, one barrier being that many species, including C. finmarchicus, have large genomes20,21. The de novo
transcrip-tome of C. finmarchicus22 represents a useful resource for assessing the impact of global warming in this species
of high ecological interest. In addition to differential gene expression analyzes, RNA sequencing has increased the ability to study the expression of rhythmically expressed mRNAs23–25. Indeed, at the molecular level, the
endoge-nous clock machinery drives the rhythmic expression of downstream genes whose rhythmic translation and func-tion ultimately underlie daily oscillafunc-tions at cellular and organismal levels25. Note that in the field, environmental
cycles also directly generate rhythms independently from the clock. Thus, temporal transcriptomic studies allow a major breakthrough in the understanding of daily dynamics of biological processes in the field.
In this study, we performed RNA sequencing on temporally collected in situ samples to generate a daily tran-scriptome of C. finmarchicus in the high Arctic during summer solstice period when the sun remains high above the horizon with minimal altitude variation. Sampling of C. finmarchicus stage V copepodites was performed at 4 h intervals within a 24 h cycle at two ocean stations along a latitudinal gradient. The northern station (82.5 °N, Nansen Basin) was characterized by sea ice-coverage, while the southern one (74.5 °N, Barents Sea) was sea ice-free. In addition to providing the raw data, we describe its quality assessment and the alignment to the refer-ence transcriptome to verify reliability and determine transcript quantification. Finally a complete annotation is performed and two normalized datasets are provided for further transcriptomic data exploration of this species.
Methods
Sampling design.
The sampling strategy was specifically designed for the detection of rhythmic tran-scripts25,26 although it does not exclude classic differential expression analysis27. Sampling design and analysisstrategy are presented in Fig. 1, Table 1 and Supplementary Table 1. Sampling covered a complete 24 h cycle at 4 h intervals, resulting in seven time points per station. At each station, samplings were performed at similar time intervals of: 14–15 h, 18–19 h, 22–23 h, 2–3 h, 6–7 h, and 10–11 h (all times noted in local time (UTC + 2)). Sampling at “North” station, JR85, started on 18th June (3 days before the summer solstice) at 10–11 h and ended on 19th June at 10–11 h. Sampling at “South” station, B13, started on 30th June (9 days after the summer solstice) at 14–15 h and ended on 1st July at 14–15 h. At each timepoint the water column was sampled from 200 m to the surface with vertical hauls of a WP2 plankton net (opening ∅: 57 cm, net length: 236 cm, mesh size: 200 µm) with a meshed bucket cod end (mesh size: 200 µm) at a speed of 0.5 m*s−1. Transferring the animals from the net into
the stabilization solution was done within less than 12 minutes for all samplings. A 12 h period of incubation at 2–4 °C was allowed to soak the samples thoroughly with the RNAlater stabilization solution (Ambion, UK) before they were transferred to −80 °C for further transport and storage.
Sites description.
Sampling has been conducted during Cruise JR17006 of the RRS James Clark Ross in summer 2018 at two stations along a latitudinal gradient. The station “North” was sea ice-covered and located in the Nansen Basin (JR85; 82.56°N, 30.85°E). The station “South” was sea ice-free and located in the southern Barents Sea (B13; 74.5°N, 30°E). Water depth at “North” was 3700 m and at “South” was 360 m. The sun’s altitude was always above the horizon but still showed diel oscillations of altitude above the horizon from 16 ° at midnight to 30.9 ° at midday at “North”, and from 7.7 ° at midnight to 38.6 ° at midday at “South” at the times of sampling (all times noted in local time (UTC + 2)). Sites were exposed to semidiurnal tide regimes, i.e., 2 tides per day, with a maximum amplitude of ± 0.47 m at JR85 and ± 0.36 m at B13 at times of sampling. Maps with the location of the sea ice edge at the time of sampling at “North” are available from the meereisportal28 (https://data.meereisportal. de/gallery/index_new.php?active-tab1=method&ice-type=satellite&satellite=A®ion=n&resolution=dai- ly&minYear=2018&minMonth=6&minDay=18&maxYear=2018&maxMonth=6&maxDay=19&show-Maps=y&dateRepeat=n&submit2=display&lang=en_US&active-tab2=satellite). Modeled data of sun altitude were obtained from the United States Naval Observatory (https://aa.usno.navy.mil/data/docs/AltAz.php, USNO, USA). Information on the tidal dynamics have been drawn from the TPX08 model29 by using the OTPSpack-age (Tidal Prediction Software, http://www-po.coas.oregonstate.edu/~poa/www-po/research/po/research/tide/ index.html), via the mbotps program30 (MB-System). Solar altitude, tidal height and sea-ice cover during the
sampling campaign at both latitudes are detailed in Supplementary Table 2. Temperature, pressure (depth), con-ductivity (salinity), oxygen saturation (SBE 43, Sea-Bird Electronics) and Chlorophyll a (Chl a) fluorescence (Aquatracka III fluorometer, Chelsea Technologies Group, UK) were measured from the surface to 200 m depth and are available in Hueppe et al.31.
Copepod sorting.
Copepods were sorted at 2 °C under a stereo microscope for species (C. finmarchicus) and stage (CV). To distinguish C. finmarchicus from its closely related congener C. glacialis, morphological indicators were used, in particular the redness of the antenna, which has been shown to be a good indicator in the regions of sampling32; see also the molecular validation of morphological identification, below. For each timepoint andstation, 3 replicates of 15 C. finmachicus CV were sorted. The choice to pool 15 individuals was made to (1) get the sufficient amount of RNA required for RNA sequencing and quantitative real-time PCR analyses and (2)
increase the number of individuals (315 copepods per station in total) thereby decreasing the effect of individual variability.
RNA extraction.
Each replicate was distributed to a 2 ml Precellys®
homogenization tube (Bertin Instruments, France), containing a mix of 1.4 mm and 2.8 mm ceramic beads and homogenized in 600 µl of TRIzol®
reagent (ThermoFisher Scientific, USA) with a Precellys®
24 Tissue Homogenizer (Bertin Instruments, France), using two times 15 sec. of homogenization at 5000 rpm with a 10 sec. break between. For RNA extraction, a Phenol/Chloroform based single-step extraction in combination with a spin column based solid phase extrac-tion (Direct-zol™
RNA MiniPrep Kit, Zymo Research, USA) was used. Genomic DNA was removed by DNase I digestion on column as part of the RNA extraction kit and total RNA was eluted in ultra-pure water. A portion of the RNA of each of the samples was used to investigate relative expression of 8 candidate genes with SYBRGreen10-11h 14-15h 18-19h 22-23h 2-3h 6-7h 10-11h
“North”, JR85, 82.5 °N, 30 °E, ice-covered / 18.06.2018 – 19.06.2018
14-15h 18-19h 22-23h 2-3h 6-7h 10-11h 14-15h
“South”, B13, 74.5 °N, 30 °E, ice-free / 30.06.2018 – 01.07.2018
Protocol 1
Sampling at 4h intervals in the water column from 200 m to the surface, to cover a 24h cycle, at two high Arctic stations.
Protocol 3
RNA extraction of 42 samples.
Protocol 4
RNA-sequencing of 42 samples.
Protocol 2
Sorting of 3 replicates of 15 C. finmarchicus stage CV per time and per station. One day during the high Arctic summer solstice
Horizon
Time
12h 00h 12h
Fig. 1 Overview of the experimental workflow used to generate the transcriptomic data output (all times noted in local time (UTC + 2)). Sample details are available in Supplementary Table 1.
Station Number of timepoint Sampling frequency Total duration of sampling Number of replicate per timepoint Total number of
samples Sequencing strategy Reads Platform
“North” 7 4 h 24 h 3 21 RNA-seq paired-end 2 × 150 pb Illumina NovaSeq
“South” 7 4 h 24 h 3 21 RNA-seq paired-end 2 × 150 pb Illumina NovaSeq
www.nature.com/scientificdata
www.nature.com/scientificdata/
based quantitative real-time PCR (qPCR) on candidate genes, using the 2−∆Ct method32 and the geometric mean
of elongation factor 1α and 16 s rRNA as reference, as described by Hueppe et al.31. Another portion of each
sam-ples was send to GeT-PlaGe core facility in dried-ice for RNA sequencing.
RNA sequencing.
RNA sequencing was performed at the GeT-PlaGe core facility, INRAE Toulouse. The 42 RNA sequencing libraries were prepared according to Illumina’s protocols using the Illumina TruSeq Stranded mRNA sample prep kit to analyse mRNA. Briefly, mRNA were selected using poly-T beads. Then, RNA were fragmented to generate double stranded cDNA and adaptors were ligated to be sequenced. 11 cycles of PCR were applied to amplify libraries. Library quality was assessed using a Fragment Analyser (Advanced Analytical Technologies, Inc., Iowa, USA) and libraries were quantified by qPCR using the Kapa Library Quantification Kit (Roche). RNA sequencing experiments have been performed on a NovaSeq S4 lane (Illumina, California, USA) using a paired-end read length of 2 × 150 pb with the Illumina NovaSeq Reagent Kits.Reads alignment and quantification.
42 RNA sequencing libraries were obtained (Fig. 1, Table 1, and Supplementary Table 1). The number of paired reads per library was between 74 million and 276 million with an average of 126 ± 5 million (mean ± SE) reads. The RNA sequencing libraries reads quality were evaluated using FastQC33. Contamination was checked by aligning reads against E. coli, Yeast and PhiX genomes.The Calanus finmarchicus de novo transcriptome22, based on different life stages and deposited to Bioproject
PRJNA236528, was used as the reference transcriptome. It is composed of 206,012 contigs and presents good results of quality assessment, with a nearly complete BUSCO set22,34. Reads were aligned to the de novo
tran-scriptome with BWA-MEM (http://bio-bwa.sourceforge.net/bwa.shtml). Quantification was performed with SAMtools35 idxStats to generate the quantification matrix. The matrix was filtered with edgeR36 and only contigs
with more than 1 CPM (Count Per Million) in at least one sample were kept, providing a matrix of 76,550 contigs. Information on the datasets resulting from this study is available in Table 2.
Annotation.
We provided different annotations for all further analysis. Contigs were aligned with DIAMOND37 on NR (2019-09-29), Swissprot and Trembl (2018-12) to retrieve corresponding best annotations.An annotation matrix was then generated by selecting the best hit for each database if: i) the percent of the query length covered by the alignment was higher than 60%; ii) the percent of the subject length covered by the alignment was higher than 40%; iii) the percent of identity of the alignment was higher than 40%. Contigs were also processed with InterProScan38 to scan InterProScan signatures. A GO was assigned to each contig
with an InterProScan hit containing a GO annotation. Information on the datasets resulting from this study is available in Table 2. Note that a previous annotation of Calanus finmarchicus reference transcriptome22 against
Non-redundant (NR) protein database is also available at https://doi.org/10.5061/dryad.11978.
Normalization.
Two normalizations are proposed (down-sampling normalization and RLE normalization) but the choice of normalization depends on the analysis required downstream. For a rhythmic analysis, we sug-gest down-sampling the mapped reads to the lowest number among the 42 samples (down-sampling normali-zation), i.e. to 70.4 million properly mapped reads per sample for all samples (after filtering), in order to adjust for differences in sequencing depth among samples23,25,39. This was performed with StreamSampler.jar (https:// github.com/shenkers/sampling). EdgeR36 was used to perform RLE normalization, since it is more appropriatefor differential expression analysis. Information on the datasets resulting from this study is available in Table 2.
DOI Availability File Name Description File format
— https://www.ncbi.nlm.nih.gov/bioproject/PRJNA628886 SRR11748365.fastq.gz to SRR11748406.fastq.gz Raw RNA sequencing data fastq
https://doi.org/10.6084/
m9.figshare.c.5127704 https://doi.org/10.6084/m9.figshare.c.5127704
PRJNA628886_raw_
quantification_206K.tsv.gz Raw count matrix of the 206,012 contigs tsv 76k_ids_list.txt List of identifiers corresponding to the 76,550 contigs after filtering txt PRJNA628886_quantification_
downsampled_76k.tsv.gz Down-sampling normalized quantification matrix tsv PRJNA628886_quantification_
RLE_76k.tsv.gz RLE normalized quantification matrix tsv Interprot_annot_206K.gff3 Gff3 InterProScan annotation of the 206,012 contigs gff3 Interprot_annot_206K.tsv Tabulated InterProScan annotation of the 206,012 contigs tsv diamond_annotation_206k.tsv Tabulated DIAMOND annotation matrix of the 206,012 contigs
(NR,swissprot,trembl) tsv diamond_annotation_76k.tsv Tabulated DIAMOND annotation matrix of the 76,550 contigs
(NR,swissprot,trembl) tsv
Table 2. List of available datasets related to the study (NCBI Bioproject PRJNA62888640 and figshare collection
Data Records
Raw reads were gathered in the NCBI BioProject PRJNA62888640 which includes all BioSamples used for the
study (Table 2, Supplementary table 1). We also provide the following in figshare collection 512770441 (Table 2):
the quantification matrix for the 206,012 contigs; the list of identifiers corresponding to the 76,550 contigs after filtering; the two suggested normalization matrices (down-sampling and RLE) and; the datasets annotations (DIAMOND annotation matrix, InterProScan annotation, GO association).
technical Validation
Molecular validation of morphological identification.
Since C. finmarchicus’ Arctic congener C.gla-cialis also occurs in the region of sampling and differences between the species can be very subtle42,
morpho-logical identification was validated by molecular species identification on a subset of samples from the same stations21,43. DNA was extracted from individual copepods using the HotShot method44, and the species-specific
nuclear insertion/deletion (InDel) marker G-150 was amplified using a modified protocol from Smolina et al.45.
Identification was done by accessing the size of the resulting amplicon via electrophoresis on a 2% agarose gel. Results have shown that 99% of the individuals identified as C. finmarchicus by the morphological identification method were also clearly identified as C. finmarchicus by the molecular identification method, while 0.1% were not clearly identified and 0.7% were identified as the Arctic congener Calanus glacialis (n = 305 individuals).
Extraction and RNA integrity.
RNA extraction procedures were performed with randomization of sam-ples to ensure reliable and unbiased data production. RNA purity was assessed by OD measurements with a NanoDrop 8000 spectrophotometer (ThermoFisher Scientific, USA), and all 260/280 and 260/230 OD ratio was superior to 1.9. RNA integrity was evaluated with a Fragment Analyzer (Advanced Analytical Technologies, Inc., Iowa, USA; RNA Kit (15nt) Standard Sensitivity, Agilent). Due to a non-conventional 28 S/18 S ribosomal ratio in this species, sample quality was evaluated on the electropherogram46. No degradation in the inter region wasobserved. Total RNA samples were stored at −80 °C.
Raw reads assessment and quantification overview.
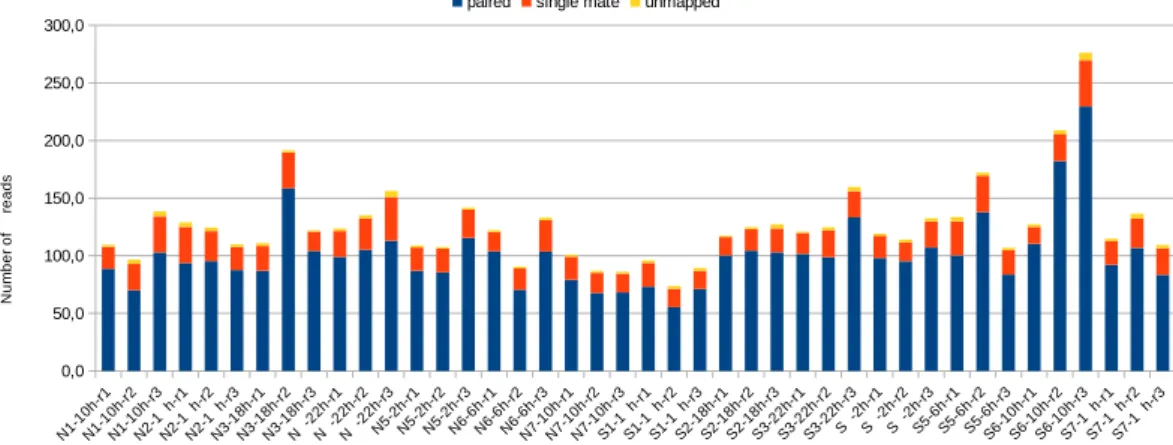
All samples passed the FastQC33 “base qualitycontrol”. No relevant contamination hit was found after the alignment against E. coli, Yeast and PhiX. The map-ping rate against the reference transcriptome22 of 206,012 contigs was higher than 72.4% for properly paired reads
and higher than 93.6% considering both paired and single mate reads, validating the raw reads quality (Fig. 2, Supplementary Table 3). Furthermore, over the 42 samples, the maximal percentage of multi-mapped alignment is of 3.31% (Fig. 2, Supplementary Table 3).
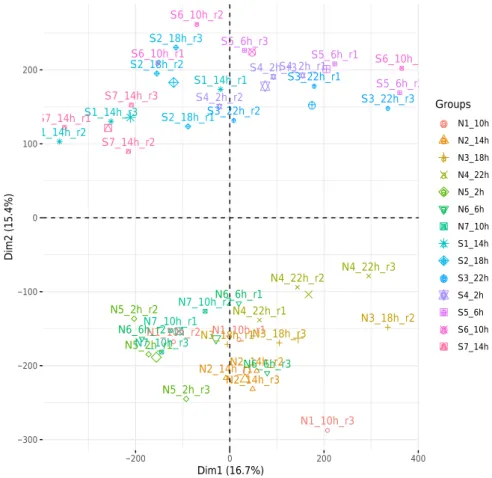
For an overview of the quantification matrix, a principal component analysis (PCA) was generated on the raw pseudo-count (log2 (count + 1)) non-normalized matrix (Fig. 3). Results showed a clear separation between samples from “North” and “South” stations, indicating environmental variations that might be due to latitude and/or sea ice-coverage.
Filtering.
Of the 206,012 transcripts, 37% (76,550) were expressed above the threshold of 1 CPM. This result corroborates previously observed results on the C. finmarchicus transcriptome22. Thus a large proportion ofthe whole contigs (63%) exhibited an extremely low level of expression, representing only 1.32 ± 0.04% of total aligned reads at “North”, and 1.27 ± 0.05% at “South” (Table 3, Supplementary Table 4).
Contigs annotation.
By selecting the best hit for each database, the annotation matrix generated with Diamond37 has led to 36,274 and 22,527 contigs with an annotation in at least one database out of the 206,012 and76,550 contigs respectively (Table 4). Moreover, the number of unique hits for each database is always lower than the number of contigs annotated by the respective database, highlighting the contigs’ functional redundancies.
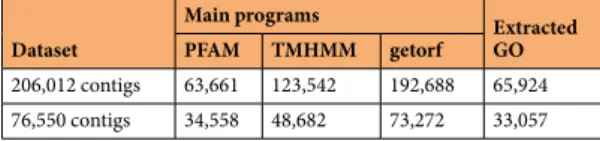
The InterProScan annotation provided annotations from many protein signature databases. The main results are presented in Table 5 and Supplementary Table 5. A GO was attributed to 65,924 contigs over the whole tran-scriptome (206,012 contigs), while 33,057 contigs out of the 76,550 contigs with an expression level higher than 1 CPM in at least one sample had a GO annotation (Table 5, Supplementary Table 5).
Fig. 2 Mapping statistics of the 42 samples against the set of 206,012 contigs. Number of million (M) reads: paired, single mate, and unmapped. Details are available in Supplementary Table 3.
www.nature.com/scientificdata
www.nature.com/scientificdata/
Quantitative real-time pCR data for normalization verification.
The relative expression of six core circadian clock genes (clock, cycle, period1, timeless, cryptochrome2, vrille) and 2 circadian clock-related genes (cryptochrome1 and doubletime2) was investigated by quantitative real-time PCR and are available in Supplementary Table 6, allowing the verification of RNA sequencing normalization for further investigations. Regarding the two normalizations, the down-sampling normalization was selected for a rhythmic analysis based on concordant temporal expression profiles with qPCR data (using RAIN algorithm47), while the RLEFig. 3 Principal component analysis of the 42 samples based on expression levels of the whole transcriptome (206,012 contigs). “Groups” grouping the 3 replicates per time and per station.
Station Average number of aligned reads on full dataset (206,012 contigs) Average number of aligned reads after filtering (76,550 contigs) Percentage of aligned reads discarded by filtering
“North” 117.9 ± 5.4 116.3 ± 5.3 1.32 ± 0.04%
“South” 129.9 ± 9.3 128.3 ± 9.2 1.27 ± 0.05%
Table 3. Average number (million, mean ± SE) of alignments per station and percentage of alignments
discarded by filtering contigs with very low expression. Details are available in Supplementary Table 4.
Dataset Database Number of contigs Number of unique hit in target database
206,012 contigs
NR 32,637 16,165
Trembl 28,845 15,518
Swissprot 11,668 5,486
With an annotation in at least one database 36,274 — 76,550 contigs
NR 21,171 11,045
Trembl 17,988 10,051
Swissprot 8,456 4,343
With an annotation in at least one database 22,527 —
Table 4. Number of contigs annotated with DIAMOND against NR, TREMBL and Swissprot and number of
normalization has been validated for differential expression analysis of the mean level of expression between stations, using the 21 samples of each stations as replicates.
Usage Notes
We present here the first in situ daily transcriptomes from the high Arctic, where molecular investigations of biological rhythms are exceptionally limited15,16. The samplings have been realized during drastic Polar photic
conditions, i.e. the summer solstice, when daily oscillations of the Sun are minimal, high in the sky and always above the horizon15. The proposed datasets are thus novel and of interest due to the unique geographical location
and time of year, the ecological importance of C. finmarchicus, and the rigorous temporal sampling strategy. Another strength of this dataset is the high depth of the RNA sequencing, with an average of 126 ± 5 million of reads (mean ± SE) per sample, which optimizes the detection of rhythmic transcripts25 in a species with a large
genome20,21. Finally, the elaborate annotation of the large transcriptome is now publicly available and is thus
accessible for further research.
The sampling strategy is optimized for rhythmic analysis, and particularly adapted for RAIN algorithm analy-sis23,25,47. Moreover, dataset allows powerful differential gene expression analysis using the 21 samples per station
as replicates providing time-integrated detection of differentially expressed genes in C. finmarchicus with latitude/ sea ice-cover. With climate driven environmental changes, this dataset ultimately constitutes new insights into transcriptomic regulation in the northward migrating copepod C. finmarchicus.
Code availability
Parameters to software tools involved are described in the following paragraph. FastQC: version 0,11,2, --nogroup --casava.
DIAMOND: version v0.9.22, parameters: -f 6 qseqid qlen qcovhsp pident score evalue length sseqid slen stitle. InterProScan: version 5.29–68.0, --goterms -t n -dp -f TSV, gff3 parameters.
BWA: version 0.7.17, standard parameters, mem algorithm.
SAMtools programs (view, sort, index and idxStats, flagstat): version 1.8, standard parameters. EdgeR: version 3.26.5.
StreamSampler.jar: version 1.0.
Received: 5 August 2020; Accepted: 29 October 2020; Published: xx xx xxxx
References
1. Prokopchuk, I. & Sentyabov, E. Diets of herring, mackerel, and blue whiting in the Norwegian Sea in relation to Calanus finmarchicus distribution and temperature conditions. ICES J. Mar. Sci. 63, 117–127 (2006).
2. Beaugrand, G., Brander, K. M., Alistair Lindley, J., Souissi, S. & Reid, P. C. Plankton effect on cod recruitment in the North Sea.
Nature 426, 661–664 (2003).
3. Berge, J., Gabrielsen, T. M., Moline, M. & Renaud, P. E. Evolution of the Arctic Calanus complex: an Arctic marine avocado? J.
Plankton Res. 34, 191–195 (2012).
4. Archibald, K. M., Siegel, D. A. & Doney, S. C. Modeling the Impact of Zooplankton Diel Vertical Migration on the Carbon Export Flux of the Biological Pump. Glob. Biogeochem. Cycles 33, 181–199 (2019).
5. Helaouët, P. & Beaugrand, G. Macroecology of Calanus finmarchicus and C. helgolandicus in the North Atlantic Ocean and adjacent seas. Mar. Ecol. Prog. Ser. 345, 147–165 (2007).
6. Murphy, E. J. et al. Understanding the structure and functioning of polar pelagic ecosystems to predict the impacts of change. Proc.
R. Soc. B Biol. Sci. 283, 20161646 (2016).
7. Reygondeau, G. & Beaugrand, G. Future climate-driven shifts in distribution of Calanus finmarchicus. Glob. Change Biol. 17, 756–766 (2011).
8. Saikkonen, K. et al. Climate change-driven species’ range shifts filtered by photoperiodism. Nat. Clim. Change 2, 239–242 (2012). 9. Huffeldt, N. P. Photic Barriers to Poleward Range-shifts. Trends Ecol. Evol. 35, 652–655 (2020).
10. Emerson, K. J., Bradshaw, W. E. & Holzapfel, C. M. Concordance of the Circadian Clock with the Environment Is Necessary to Maximize Fitness in Natural Populations. Evolution 62, 979–983 (2008).
11. Bradshaw, W. E. & Holzapfel, C. M. What Season Is It Anyway? Circadian Tracking vs. Photoperiodic Anticipation in Insects. J. Biol.
Rhythms 25, 155–165 (2010).
12. Christie, A. E., Fontanilla, T. M., Nesbit, K. T. & Lenz, P. H. Prediction of the protein components of a putative Calanus finmarchicus (Crustacea, Copepoda) circadian signaling system using a de novo assembled transcriptome. Comp. Biochem. Physiol. Part D
Genomics Proteomics 8, 165–193 (2013).
13. Häfker, N. S. et al. Circadian Clock Involvement in Zooplankton Diel Vertical Migration. Curr. Biol. CB 27, 2194–2201.e3 (2017). 14. Häfker, N. S. et al. Calanus finmarchicus seasonal cycle and diapause in relation to gene expression, physiology, and endogenous
clocks. Limnol. Oceanogr. 63, 2815–2838 (2018).
15. Schmal, C., Herzel, H. & Myung, J. Clocks in the Wild: Entrainment to Natural Light. Front. Physiol. 11 (2020).
16. Abhilash, L., Shindey, R. & Sharma, V. K. To be or not to be rhythmic? A review of studies on organisms inhabiting constant environments. Biol. Rhythm Res. 48, 677–691 (2017).
Dataset
Main programs Extracted GO PFAM TMHMM getorf
206,012 contigs 63,661 123,542 192,688 65,924 76,550 contigs 34,558 48,682 73,272 33,057
Table 5. Number of contigs with an InterProScan annotation and details on main features. Details are available
www.nature.com/scientificdata
www.nature.com/scientificdata/
17. Bertolini, E. et al. Life at high latitudes does not require circadian behavioral rhythmicity under constant darkness. Curr. Biol. 29, 3928–3936.e3 (2019).
18. David, C., Lange, B., Rabe, B. & Flores, H. Community structure of under-ice fauna in the Eurasian central Arctic Ocean in relation to environmental properties of sea-ice habitats. Mar. Ecol. Prog. Ser. 522, 15–32 (2015).
19. Falk-Petersen, S. et al. Lipids and fatty acids in ice algae and phytoplankton from the Marginal Ice Zone in the Barents Sea. Polar
Biol. 20, 41–47 (1998).
20. Bron, J. E. et al. Observing copepods through a genomic lens. Front. Zool. 8, 22 (2011).
21. Choquet Marvin et al. Towards population genomics in non-model species with large genomes: a case study of the marine zooplankton Calanus finmarchicus. R. Soc. Open Sci. 6, 180608 (2019).
22. Lenz, P. H. et al. De Novo Assembly of a Transcriptome for Calanus finmarchicus (Crustacea, Copepoda) – The Dominant Zooplankter of the North Atlantic Ocean. PLOS ONE 9, e88589 (2014).
23. Hughes, M. E. et al. Guidelines for Genome-Scale Analysis of Biological Rhythms. J. Biol. Rhythms 32, 380–393 (2017).
24. Mermet, J., Yeung, J. & Naef, F. Systems Chronobiology: Global Analysis of Gene Regulation in a 24-Hour Periodic World. Cold
Spring Harb. Perspect. Biol. 9, a028720 (2017).
25. Li, J., Grant, G. R., Hogenesch, J. B. & Hughes, M. E. Considerations for RNA-seq analysis of circadian rhythms. Methods Enzymol.
551, 349–367 (2015).
26. Ness-Cohn, E., Iwanaszko, M., Kath, W., Allada, R. & Braun, R. TimeTrial: An Interactive Application for Optimizing the Design and Analysis of Transcriptomic Times-Series Data in Circadian Biology Research. J. Biol. Rhythms 35, 439–451 (2020).
27. Payton, L. et al. Remodeling of the cycling transcriptome of the oyster Crassostrea gigas by the harmful algae Alexandrium minutum.
Sci. Rep. 7, 3480 (2017).
28. Grosfeld, K. et al. Online Sea-Ice Knowledge and Data Platform. https://www.meereisportal.de/ (2016).
29. Egbert, G. D. & Erofeeva, S. Y. Efficient Inverse Modeling of Barotropic Ocean Tides. J. Atmospheric Ocean. Technol. 19, 183–204 (2002).
30. Caress, D. W. & Chayes, D., N. MB-System Version 5.5.2284. Open source software distributed from the MBARI and L-DEO web sites. (2016).
31. Hüppe, L. et al. Evidence for oscillating circadian clock genes in the copepod Calanus finmarchicus during the summer solstice in the high Arctic. Biol. Lett. 16, 20200257 (2020).
32. Livak, K. J. & Schmittgen, T. D. Analysis of relative gene expression data using real-time quantitative PCR and the 2−ΔΔCT method.
Methods 25, 402–408 (2001).
33. Andrews, S. FastQC: a quality control tool for high throughput sequence data. (Babraham Bioinformatics, Babraham Institute, Cambridge, United Kingdom, 2010).
34. Tarrant, A. M., Nilsson, B. & Hansen, B. W. Molecular physiology of copepods - from biomarkers to transcriptomes and back again.
Comp. Biochem. Physiol. Part D Genomics Proteomics 30, 230–247 (2019).
35. Li, H. et al. The Sequence Alignment/Map format and SAMtools. Bioinformatics 25, 2078–2079 (2009).
36. Robinson, M. D., McCarthy, D. J. & Smyth, G. K. edgeR: a Bioconductor package for differential expression analysis of digital gene expression data. Bioinformatics 26, 139–140 (2010).
37. Buchfink, B., Xie, C. & Huson, D. H. Fast and sensitive protein alignment using DIAMOND. Nat. Methods 12, 59–60 (2015). 38. Jones, P. et al. InterProScan 5: genome-scale protein function classification. Bioinformatics 30, 1236–1240 (2014).
39. Koike, N. et al. Transcriptional Architecture and Chromatin Landscape of the Core Circadian Clock in Mammals. Science 338, 349–354 (2012).
40. NCBI Sequence Read Archive https://identifiers.org/ncbi/insdc.sra:SRP261032 (2020)
41. Payton, L. et al. Daily transcriptomes of the copepod Calanus finmarchicus during the summer solstice at high Arctic latitudes.
figshare https://doi.org/10.6084/m9.figshare.c.5127704.v1 (2020).
42. Nielsen, T. G., Kjellerup, S., Smolina, I., Hoarau, G. & Lindeque, P. Live discrimination of Calanus glacialis and C. finmarchicus females: can we trust phenological differences? Mar. Biol. 161, 1299–1306 (2014).
43. Choquet, M. et al. Genetics redraws pelagic biogeography of Calanus. Biol. Lett. 13, 20170588 (2017).
44. Truett, G. E. et al. Preparation of PCR-quality mouse genomic DNA with hot sodium hydroxide and tris (HotSHOT). BioTechniques
29(52), 54 (2000).
45. Smolina, I. et al. Genome- and transcriptome-assisted development of nuclear insertion/deletion markers for Calanus species (Copepoda: Calanoida) identification. Mol. Ecol. Resour. 14, 1072–1079 (2014).
46. DeLeo, D. M., Pérez-Moreno, J. L., Vázquez-Miranda, H. & Bracken-Grissom, H. D. RNA profile diversity across arthropoda: guidelines, methodological artifacts, and expected outcomes. Biol. Methods Protoc. 3 (2018).
47. Thaben, P. F. & Westermark, P. O. Detecting rhythms in time series with RAIN. J. Biol. Rhythms 29, 391–400 (2014).
Acknowledgements
This work was supported by the CHASE project, part of the Changing Arctic Ocean programme, jointly funded by the UKRI Natural Environment Research Council (NERC, project number: NE/R012733/1) and the German Federal Ministry of Education and Research (BMBF, project number: 03F0803A). We thank the NERC PRIZE cruise leader Professor Finlo Cottier (Scottish Association for Marine Science, UK) as well as the Captain and crew of the RRS James Clark Ross for their support during the cruise JR17006. Cruise time was supported by the CAO Arctic PRIZE project (NERC: NE/P006302/1). EE was supported by Arctic SIZE, a project co-funded by UiT The Arctic University of Norway and the Tromsø Research Foundation (project number 01vm/h15), and within framework of the state assignment of IO RAS (theme No. 0149- 2019- 0008). We would like to thank Vittoria Roncalli (Stazione Zoologica Anton Dohrn, Italy) for useful discussions. Open Access funding enabled and organized by Projekt DEAL.
author contributions
L.P. designed the study, coordinated RNA extraction, contributed to data analysis and wrote the manuscript; C.N. and C.H. performed reads quality assessment, reads alignment on transcriptome, transcriptome annotation and validation and wrote the manuscript; L.H. designed the study, collected samples, extracted RNA and reviewed the manuscript; K.L. and D.W. designed the study, collected samples and reviewed the manuscript; E.E. identified the copepod species on a genetic level and reviewed the manuscript; S.V performed the samples preparation for RNA sequencing; B.M. designed the study, reviewed the manuscript and supervised the study.
Competing interests
additional information
Supplementary information is available for this paper at https://doi.org/10.1038/s41597-020-00751-4.
Correspondence and requests for materials should be addressed to L.P.
Reprints and permissions information is available at www.nature.com/reprints.
Publisher’s note Springer Nature remains neutral with regard to jurisdictional claims in published maps and
institutional affiliations.
Open Access This article is licensed under a Creative Commons Attribution 4.0 International
License, which permits use, sharing, adaptation, distribution and reproduction in any medium or format, as long as you give appropriate credit to the original author(s) and the source, provide a link to the Cre-ative Commons license, and indicate if changes were made. The images or other third party material in this article are included in the article’s Creative Commons license, unless indicated otherwise in a credit line to the material. If material is not included in the article’s Creative Commons license and your intended use is not per-mitted by statutory regulation or exceeds the perper-mitted use, you will need to obtain permission directly from the copyright holder. To view a copy of this license, visit http://creativecommons.org/licenses/by/4.0/.
The Creative Commons Public Domain Dedication waiver http://creativecommons.org/publicdomain/zero/1.0/
applies to the metadata files associated with this article. © The Author(s) 2020