HAL Id: hal-00297028
https://hal.archives-ouvertes.fr/hal-00297028
Submitted on 8 Aug 2007
HAL is a multi-disciplinary open access
archive for the deposit and dissemination of
sci-entific research documents, whether they are
pub-lished or not. The documents may come from
teaching and research institutions in France or
abroad, or from public or private research centers.
L’archive ouverte pluridisciplinaire HAL, est
destinée au dépôt et à la diffusion de documents
scientifiques de niveau recherche, publiés ou non,
émanant des établissements d’enseignement et de
recherche français ou étrangers, des laboratoires
publics ou privés.
Extreme precipitation related to circulation types for
four case studies over the Eastern Mediterranean
K. Tolika, Chr. Anagnostopoulou, P. Maheras, H. Kutiel
To cite this version:
K. Tolika, Chr. Anagnostopoulou, P. Maheras, H. Kutiel. Extreme precipitation related to circulation
types for four case studies over the Eastern Mediterranean. Advances in Geosciences, European
Geosciences Union, 2007, 12, pp.87-93. �hal-00297028�
www.adv-geosci.net/12/87/2007/ © Author(s) 2007. This work is licensed under a Creative Commons License.
Geosciences
Extreme precipitation related to circulation types for four case
studies over the Eastern Mediterranean
K. Tolika1, Chr. Anagnostopoulou1, P. Maheras1, and H. Kutiel2
1Department of Meteorology and Climatology, School of Geology, Aristotle University of Thessaloniki, 54124 Greece 2Department of Geography and Environmental Studies, University of Haifa, Israel
Received: 26 February 2007 – Revised: 5 July 2007 – Accepted: 6 August 2007 – Published: 8 August 2007
Abstract. The analysis of the links between the extreme
pre-cipitation and the associated atmospheric conditions through an aloft circulation type approach at the 500-hPa geopoten-tial level, for the time period of 1958-2000, is the main mo-tivation for the present study. Four stations in the eastern Mediterranean (17.5◦E to 37.5◦E and 30◦N to 40◦N) were selected as separate case studies. The extreme precipitation conditions were defined by the two most widely used indices: the 90th and 95th percentiles. It was found that two cyclonic types (C – with its centre over the station and Cwsw – with its centre at the WSW of the station) were mainly associated with extreme rainfall conditions for all the selected stations. Generally, these circulation types are deepening during days with extreme precipitation in comparison to the general mean field of the type.
1 Introduction
Extreme precipitation and temperature events have been recently the subject of numerous climate studies, since they have severe environmental and socioeconomic conse-quences, as well as impacts on the hydrological cycle, water resources, agriculture and tourism. Furthermore, in a future warmer climate, where there will probably be a change in the extremes, the assessment of these changes, particularly of the frequency and intensity of the extreme events receives great importance. Especially in the case of precipitation, Santos et al. (2007) have demonstrated that an estimation of the changes in the rainfall extremes in a modified future climate could be helpful for the development of appropriate adapta-tion and mitigaadapta-tion strategies.
Since the General Circulation Models were found quite skilful in reproducing the general and the regional atmo-Correspondence to: P. Maheras
spheric circulation, and the statistical downscaling models use mainly these parameters as predictors for their future projections (Tolika et al., 2006), it becomes evident that the knowledge of the climatic features of extremes and their links with the atmospheric conditions could be helpful for the de-velopment of more valid future climate change scenarios of the extremes (Hellstrom, 2005). Moreover, the study and the association of the occurrence of extremes and the large-scale circulation could reveal novel information about the physical processes that dominate during extreme conditions (Santos et al., 2007).
The main motivations for the present study are a) the sta-tistical analysis of the extreme precipitation conditions over the eastern Mediterranean and their association with the cir-culation types, and b) the analysis of the dynamic processes in the fields of these circulation types during the extreme pre-cipitation events.
2 Data and methodology
The data used in the study consist of daily precipitation time series derived from four meteorological stations over the eastern Mediterranean region (Fig. 1). The selected time pe-riod covers the years from 1958 to 2000 and due to the fact that eastern Mediterranean is characterized by very low pre-cipitation totals (or even absence of rainfall) during summer, the study focuses only on the cold – wet period from October to April. All the time series used contain no missing values and were found homogeneous according to the Alexanders-son test (AlexandersAlexanders-son, 1986).
A new automatic classification, based on the previous clas-sification by Maheras and Anagnostopoulou (2003), was ap-plied for the computation of the daily calendars of the cir-culation types. The main improvements of this classification are the number of the circulation types, which are reduced now to 12 and the fact that the scheme is flexible all over the
88 K. Tolika et al.: Extreme precipitation related to circulation types -20.0 -15.0 -10.0 -5.0 0.0 5.0 10.0 15.0 20.0 25.0 30.0 35.0 40.0 45.0 50.0 20.0 22.5 25.0 27.5 30.0 32.5 35.0 37.5 40.0 42.5 45.0 47.5 50.0 52.5 55.0 57.5 60.0 62.5 65.0 Kerkyra Milos Larnaca Tel Aviv
Figure 1. Location Map.
Fig. 1. Location Map.
Mediterranean. The 500-hPa geopotential data (2.5◦×2.5◦ spatial resolution) from the NCEP/NCAR (Kalnay et al., 1996) were employed, covering a large spatial window over the whole European region, for the development of the daily circulation type’s calendar. The centre of each classification changed according to the geographical location of the sta-tion and the selected grid point was the one closest to the station (Fig. 2). Thus, the following centres were chosen: a) Kerkyra classification centre (20◦W and 40◦N), b) Milos classification centre (25◦W and 37.5◦N), c) Larnaca classi-fication centre (32.5◦W and 35◦N) and d) Tel Aviv classifi-cation centre (35◦W and 32.5◦N).
Finally, extreme precipitation was defined with the appli-cation of two extreme indices, the 90th and the 95th per-centile. The selection of these two indices was made based on the fact that they are the most commonly used ones in the literature for the analysis of extreme precipitation. Also, per-centiles were preferred instead of a fixed threshold, in order to make the indices comparable and transferable in regions with different climatic characteristics and different local pre-cipitation regimes.
3 Results
3.1 Statistical analysis of the extreme precipitation and the related circulation types
Table 1 summarizes the results of the computation of the two percentiles, the averaged number of rain days (total num-ber/years) with rainfall greater than these percentiles, the ab-solute maximum daily precipitation (maxprec) and the ratio of the maxprec/Xth perc, for the four stations under study. Kerkyra was considered as the rainiest station, as it presented the highest 90th and 95th percentile values reaching 28.1 mm and 38.8 mm respectively. This station presented also the greatest number of days with rainfall higher than the exam-ined percentiles. More specifically, 8.6 days per year were
-20.0 -15.0 -10.0 -5.0 0.0 5.0 10.0 15.0 20.0 25.0 30.0 35.0 40.0 45.0 50.0 b 20.0 22.5 25.0 27.5 30.0 32.5 35.0 37.5 40.0 42.5 45.0 47.5 50.0 52.5 55.0 57.5 60.0 62.5 65.0
Cne
Cnnw
Cwnw
Cwsw
Cssw
Cse
C -20.0 -15.0 -10.0 -5.0 0.0 5.0 10.0 15.0 20.0 25.0 30.0 35.0 40.0 45.0 50.0 a 20.0 22.5 25.0 27.5 30.0 32.5 35.0 37.5 40.0 42.5 45.0 47.5 50.0 52.5 55.0 57.5 60.0 62.5 65.0Ane
Anw
Asw
Ase
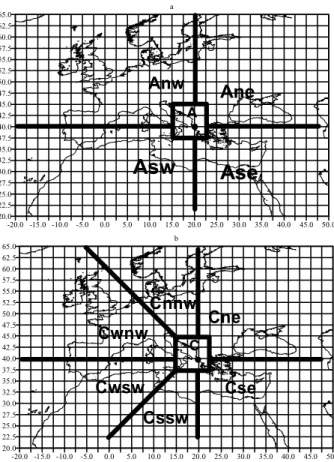
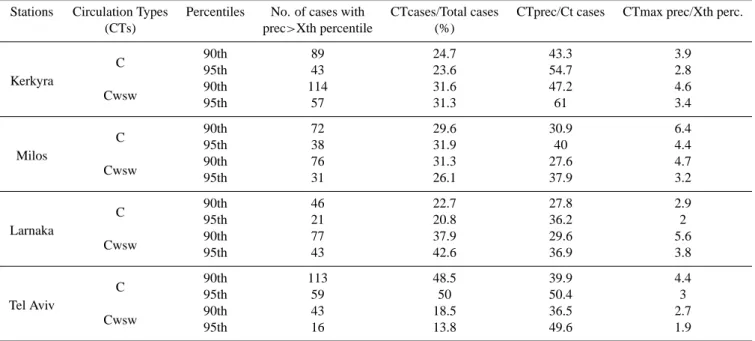
AFig. 2. The locations of the circulation types, anticyclonic (a) and
cyclonic (b) with a centre of the classification over Kerkyra.
found with precipitation amounts greater than the 90th per-centile and 4.3 days per year with precipitation higher than the 95th percentile. Tel Aviv follows with a 90th percentile of 24.2 mm and a 95th of 34.6 mm. Moreover, while the high-est absolute maximum precipitation (130.6 mm) was found in Kerkyra as well, the minimum was observed in Larnaca with only 99.1 mm. Finally, the calculated ratios of the ab-solute maximum precipitation and the 90th percentile (max-prec/90th) varied from 4.35 (Tel Aviv) to 6.69 (Milos). The equivalent results for the second index showed that the max-prec is three to almost five times greater than the 95th per-centile, with values between 3.04 (Tel Aviv) to 4.57 (Milos). In a further analysis, the trends in the precipitation time series during the selected period (October–April) and in the number of events with precipitation greater than the two per-centiles, as well as their rainfall totals were estimated (only the results of the 95th percentile are presented). It was found that Kerkyra differed from the rest of the stations as all the above parameters showed statistically significant decreasing trends during the years 1958–2000 (Fig. 3). Conversely, in all the other three stations, the precipitation and the extreme events do not change significantly. Generally, they present small positive trends (not statistically significant).
Table 1. The extreme precipitation characteristics of the four stations used in the study.
Stations Xth Perc. Mean Number Absolute Max Ratio
(mm) of days with precipitation Maxprec/Xth
prec>Xth perc. (mm) percentile
(days) 90th 95th 90th 95th 90th 95th Kerkyra 28.1 38.8 8.6 4.3 130.6 4.65 3.37 Milos 17.2 25.2 5.8 2.8 115.1 6.69 4.57 Larnaka 17.6 25.8 4.8 2.4 99.1 5.63 3.84 Tel Aviv 24.2 34.6 5.5 2.8 105.3 4.35 3.04 Figure 3 K e r k y r a P r e c i p i ta ti o n fo r th e w e t p e r i o d O c t - Ap r i l y = -9 . 1 2 3 x + 1 1 2 6 . 7 0 2 0 0 4 0 0 6 0 0 8 0 0 1 0 0 0 1 2 0 0 1 4 0 0 1958 1961 1964 1967 1970 1973 1976 1979 1982 1985 1988 1991 1994 1997 2000 K e r k y r a N u m b e r o f e v e n ts w i th p r e c > = 9 5 th p e r c e n ti l e y = -0 . 0 7 0 8 x + 5 . 8 5 6 0 2 4 6 8 1 0 1 2 1 9 5 9 1 9 6 2 1 9 6 5 1 9 6 8 1 9 7 1 1 9 7 4 1 9 7 7 1 9 8 0 1 9 8 3 1 9 8 6 1 9 8 9 1 9 9 2 1 9 9 5 1 9 9 8 K e r k y r a To ta l a n n u a l p r e c i p i ta ti o n > = 9 5 th p e r c e n ti l e y = -4 . 6 1 5 7 x + 3 4 3 . 0 1 0 1 0 0 2 0 0 3 0 0 4 0 0 5 0 0 6 0 0 7 0 0 1 9 5 9 1 9 6 2 1 9 6 5 1 9 6 8 1 9 7 1 1 9 7 4 1 9 7 7 1 9 8 0 1 9 8 3 1 9 8 6 1 9 8 9 1 9 9 2 1 9 9 5 1 9 9 8 M i l o s P r e c i p i ta ti o n fo r th e w e t p e r i o d O c t - Ap r i l y = 0 . 2 1 9 1 x + 3 8 1 . 1 9 0 2 0 0 4 0 0 6 0 0 8 0 0 10 0 0 12 0 0 14 0 0 1 9 5 8 1 9 6 1 1 9 6 4 1 9 6 7 1 9 7 0 1 9 7 3 1 9 7 6 1 9 7 9 1 9 8 2 1 9 8 5 1 9 8 8 1 9 9 1 1 9 9 4 1 9 9 7 2 0 0 0 M i l o s N u m b e r o f e v e n ts w i th p r e c > = 9 5 th p e r c e n ti l e y = 0 . 0 1 7 3 x + 2 . 4 6 2 3 0 2 4 6 8 1 0 1 2 1 9 5 9 1 9 6 2 1 9 6 5 1 9 6 8 1 9 7 1 1 9 7 4 1 9 7 7 1 9 8 0 1 9 8 3 1 9 8 6 1 9 8 9 1 9 9 2 1 9 9 5 1 9 9 8 M i l o s To ta l a n n u a l p r e c i p i ta ti o n > = 9 5 th p e r c e n ti l e y = 0 . 7 0 4 1 x + 9 3 . 7 0 2 0 1 0 0 2 0 0 3 0 0 4 0 0 5 0 0 6 0 0 7 0 0 1 9 5 9 1 9 6 2 1 9 6 5 1 9 6 8 1 9 7 1 1 9 7 4 1 9 7 7 1 9 8 0 1 9 8 3 1 9 8 6 1 9 8 9 1 9 9 2 1 9 9 5 1 9 9 8 L a r n a c a P r e c i p i ta ti o n fo r th e w e t p e r i o d O c t - Ap r i l y = -0 . 4 3 6 x + 3 2 3 . 9 3 0 2 0 0 4 0 0 6 0 0 8 0 0 10 0 0 12 0 0 14 0 0 1 9 5 8 1 9 6 1 1 9 6 4 1 9 6 7 1 9 7 0 1 9 7 3 1 9 7 6 1 9 7 9 1 9 8 2 1 9 8 5 1 9 8 8 1 9 9 1 1 9 9 4 1 9 9 7 2 0 0 0 L a r n a c a N u m b e r o f e v e n ts w i th p r e c > = 9 5 th p e r c e n ti l e y = 0 . 0 1 6 x + 2 . 0 6 1 6 0 2 4 6 8 1 0 1 2 1 9 5 9 1 9 6 2 1 9 6 5 1 9 6 8 1 9 7 1 1 9 7 4 1 9 7 7 1 9 8 0 1 9 8 3 1 9 8 6 1 9 8 9 1 9 9 2 1 9 9 5 1 9 9 8 L a r n a c a T o ta l a n n u a l P r e c i p i ta ti o n > = 9 5 th p e r c e n ti l e y = 0 . 8 4 5 2 x + 7 1 . 0 8 6 0 1 0 0 2 0 0 3 0 0 4 0 0 5 0 0 6 0 0 7 0 0 1 9 5 9 1 9 6 2 1 9 6 5 1 9 6 8 1 9 7 1 1 9 7 4 1 9 7 7 1 9 8 0 1 9 8 3 1 9 8 6 1 9 8 9 1 9 9 2 1 9 9 5 1 9 9 8 Te l Av i v P r e c i p i ta ti o n fo r th e w e t p e r i o d O c t - Ap r i l y = 1 . 1 1 6 x + 4 8 7 . 8 0 2 0 0 4 0 0 6 0 0 8 0 0 10 0 0 12 0 0 14 0 0 1 9 5 8 1 9 6 1 1 9 6 4 1 9 6 7 1 9 7 0 1 9 7 3 1 9 7 6 1 9 7 9 1 9 8 2 1 9 8 5 1 9 8 8 1 9 9 1 1 9 9 4 1 9 9 7 2 0 0 0 T e l Av i v N u m b e r o f e v e n ts w i th p r e c > = 9 5 th p e r c e n ti l e y = 0 . 0 2 9 3 x + 2 . 1 3 1 2 0 2 4 6 8 1 0 1 2 1 9 5 9 1 9 6 2 1 9 6 5 1 9 6 8 1 9 7 1 1 9 7 4 1 9 7 7 1 9 8 0 1 9 8 3 1 9 8 6 1 9 8 9 1 9 9 2 1 9 9 5 1 9 9 8 Te l Av i v To ta l a n n u a l p r e c i p i ta ti o n > = 9 5 th p e r c e n ti l e y = 1 . 4 4 2 3 x + 1 0 7 . 5 2 0 1 0 0 2 0 0 3 0 0 4 0 0 5 0 0 6 0 0 7 0 0 1 9 5 9 1 9 6 2 1 9 6 5 1 9 6 8 1 9 7 1 1 9 7 4 1 9 7 7 1 9 8 0 1 9 8 3 1 9 8 6 1 9 8 9 1 9 9 2 1 9 9 5 1 9 9 8
Fig. 3. The trends of the precipitation of the October-April period (1st column), of the number of extreme events with precipitation >95th
percentile (2nd column) and the annual precipitation of these extreme events (3th column), for the four stations under study.
According to the results (number of days and percentage of occurrence %) presented in Table 2, extreme rainfall con-ditions were found mainly during the circulation types C and Cwsw. The characterization of each circulation type refers to the location of a positive (anticyclonic) or a negative (cy-clonic) centre in relation to the examined area (e.g. Greece) (Maheras and Anagnostopoulou, 2003; Anagnostopoulou et al., 2007). So, the cyclonic type C has a negative centre over this area with northerly sector winds blowing over it. Respec-tively, the circulation type Cwsw, if the study is for the Ionian Isles, it presents a negative centre over the central Mediter-ranean and northern Africa with a westerly – south-westerly flow over Greece. The relative precipitation of each
circula-tion type was computed as well as the ratio (maximum daily prec of each ct/Xth percentile) and the results are presented in Table 2.
For both percentiles, over 55% of the extreme precipitation cases were found at the occurrence of these two circulation types, for all the stations. In Kerkyra, Milos and Larnaca, the Cwsw type presents a greater number of extreme episodes, while in Tel Aviv the circulation type C prevails. Further-more, it should be mentioned that the average precipitation amounts of these circulation types is higher for both percent-ages in the case of Kerkyra, which is the station with the greatest precipitation totals. However, the calculated ratio (Table 2) presents its highest value in Milos ((6.4) circ. type
90 K. Tolika et al.: Extreme precipitation related to circulation types
Table 2. Statistical analysis of two most frequent circulation types at the occurrence of precipitation extremes, for the two percentiles (90th
and 95th).
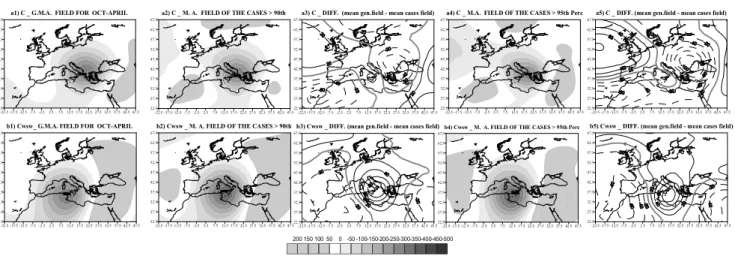
Stations Circulation Types Percentiles No. of cases with CTcases/Total cases CTprec/Ct cases CTmax prec/Xth perc.
(CTs) prec>Xth percentile (%) Kerkyra C 90th 89 24.7 43.3 3.9 95th 43 23.6 54.7 2.8 Cwsw 90th 114 31.6 47.2 4.6 95th 57 31.3 61 3.4 Milos C 90th 72 29.6 30.9 6.4 95th 38 31.9 40 4.4 Cwsw 90th 76 31.3 27.6 4.7 95th 31 26.1 37.9 3.2 Larnaka C 90th 46 22.7 27.8 2.9 95th 21 20.8 36.2 2 Cwsw 90th 77 37.9 29.6 5.6 95th 43 42.6 36.9 3.8 Tel Aviv C 90th 113 48.5 39.9 4.4 95th 59 50 50.4 3 Cwsw 90th 43 18.5 36.5 2.7 95th 16 13.8 49.6 1.9
C for the 90th percentile) and its lowest value (1.9) in Tel Aviv for the 95th Cwsw.
3.2 Dynamical Analysis of the extreme precipitation and the related circulation types
In the final step of this study, an attempt is made to examine the dynamic changes, at the 500-hPa level, of the fields of these two prevailing circulation types that may cause these extreme precipitation conditions in the four selected areas. For this reason, the general mean anomaly field of the se-lected circulation types was plotted as well as the equivalent fields only from the cases with daily rainfall amounts greater than the two percentiles. Finally, the differences between the general mean field and the field of the selected cases (gen. mean field – mean cases field) were computed and mapped. At this point it should be mentioned that all the anomaly val-ues in Figs. 4 and 5 were multiplied by 100.
The first case examined was the circulation type C for the station of Kerkyra. As it could be seen from the compos-ite maps in Fig. 4 (a1–a5), although the mean cases fields do not seem to differ much from the general field, it was found that during extreme precipitation conditions they be-come less deep (negative differences). The centre of these negative anomaly differences is located at the northeast of the examined area (Kerkyra) and they present greater abso-lute values in the case of the 95th percentile. The analysis of the second prevailing type (Cwsw, Fig. 4 b1–b5) led to dif-ferent conclusions. This time, the dynamic field of the
circu-lation type seemed to be deeper at the occurrence of extreme precipitation (higher negative anomalies). The differences found were positive, covering the selected area. The positive centre was slightly moved to the west (Fig. 4 b1–b5).
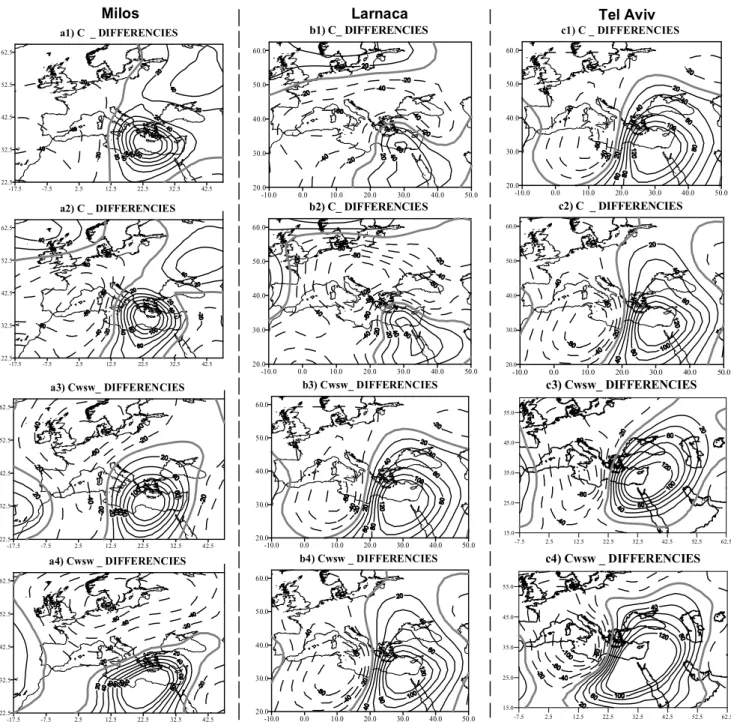
Concerning Milos, the anomaly fields of both circulation types presented a similar behaviour, with higher negative anomalies during days with heavy rainfall. Quite a strong positive differences centre is placed at the north of Greece, covering the island of Milos as well. Due to space limita-tions, only the differences are presented (Fig. 5 a1–a4). The results of the two other study areas (Larnaca and Tel Aviv) showed that also in these cases the circulation types occur-ring duoccur-ring rainfall extreme totals are deepening in compar-ison with their general mean field of the period October– April. The centre of the positive differences was situated almost over the locations of the two selected stations (dif-ferences, Fig. 5 b1–c4).
4 Discussion and conclusions
The present study aimed at exploring the relationships of the extreme precipitation conditions over the eastern Mediter-ranean region and the circulation types that prevail during the occurrence of extremes. The 90th and the 95th percentiles were selected as extreme precipitation indices and were com-puted for four stations, in Greece (Kerkyra, Milos), in Cyprus (Larnaca) and in Israel (Tel Aviv).
Figure 4. The composite map of the general mean anomaly (G.M.A.) field of the two prevailing circulation types (C and Cwsw), their mean
-22.5 -17.5 -12.5 -7.5 -2.52.57.512.5 17.5 22.5 27.5 32.5 37.5 42.5 47.5
a1) C _ G.M.A. FIELD FOR OCT-APRIL
22.5 27.5 32.5 37.5 42.5 47.5 52.5 57.5 62.5 67.5 -22.5 -17.5 -12.5 -7.5 -2.52.57.512.5 17.5 22.5 27.5 32.5 37.5 42.5 47.5
b1) Cwsw_ G.M.A. FIELD FOR OCT-APRIL
22.5 27.5 32.5 37.5 42.5 47.5 52.5 57.5 62.5 67.5 -500 -450 -400 -350 -300 -250 -200 -150 -100 -50 0 50 100 150 200 -22.5 -17.5 -12.5 -7.5 -2.52.57.512.5 17.5 22.5 27.5 32.5 37.5 42.5 47.5
a2) C _ M. A. FIELD OF THE CASES > 90th
22.5 27.5 32.5 37.5 42.5 47.5 52.5 57.5 62.5 67.5 -22.5 -17.5 -12.5 -7.5 -2.52.57.512.5 17.5 22.5 27.5 32.5 37.5 42.5 47.5
a3) C _ DIFF. (mean gen.field - mean cases field)
22.5 27.5 32.5 37.5 42.5 47.5 52.5 57.5 62.5 67.5 -22.5 -17.5 -12.5 -7.5 -2.52.57.512.5 17.5 22.5 27.5 32.5 37.5 42.5 47.5
a4) C _ M.A. FIELD OF THE CASES > 95th Perc
22.5 27.5 32.5 37.5 42.5 47.5 52.5 57.5 62.5 67.5 -22.5 -17.5 -12.5 -7.5 -2.52.57.512.5 17.5 22.5 27.5 32.5 37.5 42.5 47.5
a5) C _ DIFF. (mean gen.field - mean cases field)
22.5 27.5 32.5 37.5 42.5 47.5 52.5 57.5 62.5 67.5 -22.5 -17.5 -12.5 -7.5 -2.52.57.512.5 17.5 22.5 27.5 32.5 37.5 42.5 47.5
b2) Cwsw _ M. A. FIELD OF THE CASES > 90th
22.5 27.5 32.5 37.5 42.5 47.5 52.5 57.5 62.5 67.5 -22.5 -17.5 -12.5 -7.5 -2.52.57.512.5 17.5 22.5 27.5 32.5 37.5 42.5 47.5
b3) Cwsw _ DIFF. (mean gen.field - mean cases field)
22.5 27.5 32.5 37.5 42.5 47.5 52.5 57.5 62.5 67.5 -22.5 -17.5 -12.5 -7.5 -2.52.57.512.5 17.5 22.5 27.5 32.5 37.5 42.5 47.5
b4) Cwsw _ M. A. FIELD OF THE CASES > 95th Perc
22.5 27.5 32.5 37.5 42.5 47.5 52.5 57.5 62.5 67.5 -22.5 -17.5 -12.5 -7.5 -2.52.57.512.5 17.5 22.5 27.5 32.5 37.5 42.5 47.5
b5) Cwsw _ DIFF. (mean gen.field - mean cases field)
22.5 27.5 32.5 37.5 42.5 47.5 52.5 57.5 62.5 67.5 Kerkyra
Fig. 4. The composite map of the general mean anomaly (G.M.A.) field of the two prevailing circulation types (C and Cwsw), their mean
anomaly (M.A.) field in the cases > of the 90th and 95th percentiles and their differences (G.M.A. – M.A.) for the station of Kerkyra. All anomalies are multiplied by 100.
From the four stations under study, Kerkyra was found to have the highest 90th and 95th percentiles, followed by Tel Aviv, Larnaca and Milos. Kerkyra presented also the largest number of cases (events) with extreme precipitation. The precipitation totals, the extreme precipitation and the num-ber of events of extreme precipitation presented a statistically significant negative trend only for the station of Kerkyra. For the other three stations, extreme precipitation did not show any significant change during the period of October– April (1958–2000). This is in accordance with the findings of Alpert et al. (2002), demonstrating also that in the east-ern Mediterranean, and especially for stations over Cyprus and Israel, extreme precipitation does not present significant trends. Moreover, in their study on the extreme temperature and precipitation conditions over the Middle East (includ-ing Cyprus), Zhang et al. (2005) showed that the trends of the precipitation indices and the maximum daily precipita-tion events were less coherent and weaker than the ones con-cerning extreme temperature.
Heavy rainfall occurred during the circulation types C and Cwsw in all the stations under study. These circulation types are characterized by warm and cold air sequences, as well as by potential and kinetic energy exchanges. Rainfall con-ditions depend on evolving airmass, the wind direction at 500 hPa, the trajectory of the low pressure system, and the upper trough, on the orography and the distance from the sea of each specific area of interest, and on surface roughness. In the majority of the cases of the aforementioned circulation types, the depressions have a Mediterranean origin (Maheras 1982, 1983) and they are well developed when they reach the study areas. Their impact on rainfall is related to the in-tensity of the cold air intrusion, as well as to the depth of the associated low–pressure system. In fact, this
character-istic was concluded from the dynamic analysis of the types, which were deepening during days with extreme precipita-tion (higher negative anomalies in comparison with the gen-eral mean field of the type). The only exception was found for the circulation type C, in the case of Kerkyra.
In this station, the trajectories of the depressions that rep-resent the C and Cwsw types, and are related to extreme precipitation, are divided into two categories: a) depressions with a SW to NE trajectory and b) depressions with a NW-SE trajectory (Maheras, 1983). In both these categories, there is a trough at the 500-hPa level, whose axis is located at the west of the Greek area. In the case of the SW-NE de-pressions, the cyclones are moving along the east side of the trough. The deeper these cyclones are, the more intense the rainfall is. Also, the 500-hPa geopotential anomalies are more intense over Greece and the southern Balkans than the anomalies of the general mean field of type C. In the case of the NW-SE depressions, the axis of the trough is usually located at the west of Greece with a NW-SE slope. As a sur-face cyclone is moving towards SE, defining a C type, it is obvious that the 500-hPa geopotential values are relatively high over the southern Balkans, resulting in the appearance of higher anomalies at the 500-hPa level, in comparison to the mean anomaly values of this type. The fact that the great-est percentage of the depressions associated with extreme rainfall in Kerkyra follows a NW-SE trajectory reinforces the above conclusions. However, it should be also taken under consideration at this point that the “peculiar” result found for this station could as well be attributed to the fact that the frontal activity in that area may play a more important role in the rainfall intensity and the extremes than the depth of the depressions.
92 K. Tolika et al.: Extreme precipitation related to circulation types -17.5 -7.5 2.5 12.5 22.5 32.5 42.5 a1) C _ DIFFERENCIES 22.5 32.5 42.5 52.5 62.5 -17.5 -7.5 2.5 12.5 22.5 32.5 42.5 a2) C _ DIFFERENCIES 22.5 32.5 42.5 52.5 62.5 -17.5 -7.5 2.5 12.5 22.5 32.5 42.5 a3) Cwsw_ DIFFERENCIES 22.5 32.5 42.5 52.5 62.5 -17.5 -7.5 2.5 12.5 22.5 32.5 42.5 a4) Cwsw _ DIFFERENCIES 22.5 32.5 42.5 52.5 62.5 -10.0 0.0 10.0 20.0 30.0 40.0 50.0 b1) C_ DIFFERENCIES 20.0 30.0 40.0 50.0 60.0 -10.0 0.0 10.0 20.0 30.0 40.0 50.0 b2) C_ DIFFERENCIES 20.0 30.0 40.0 50.0 60.0 -10.0 0.0 10.0 20.0 30.0 40.0 50.0 b3) Cwsw_ DIFFERENCIES 20.0 30.0 40.0 50.0 60.0 -10.0 0.0 10.0 20.0 30.0 40.0 50.0 b4) Cwsw _ DIFFERENCIES 20.0 30.0 40.0 50.0 60.0 -10.0 0.0 10.0 20.0 30.0 40.0 50.0 c1) C _ DIFFERENCIES 20.0 30.0 40.0 50.0 60.0 -10.0 0.0 10.0 20.0 30.0 40.0 50.0 c2) C _ DIFFERENCIES 20.0 30.0 40.0 50.0 60.0 -7.5 2.5 12.5 22.5 32.5 42.5 52.5 62.5 c3) Cwsw_ DIFFERENCIES 15.0 25.0 35.0 45.0 55.0 -7.5 2.5 12.5 22.5 32.5 42.5 52.5 62.5 c4) Cwsw _ DIFFERENCIES 15.0 25.0 35.0 45.0 55.0
Milos Larnaca Tel Aviv
Fig. 5. Composite maps of the differences (G.M.A. – M.A.) for both circulation types and the two percentiles for of Milos (1st column),
Larnaca (2nd column) and Tel Aviv (3rd column).
As a future work, the authors plan to investigate more thor-oughly the changes of other characteristics of the circulation types (frequency, wind speed, changes in other geopoten-tial levels, as well as the isentropic potengeopoten-tial vorticity (IPV) advection) that could also play an important role in the occur-rence of extreme precipitation conditions over the study area. Also, it could be of great interest to examine whether in other parts of the Mediterranean region, the same circulation types are associated with the extreme indices.
Acknowledgements. This work was funded by the European
Commission under the frame of the “ENSEMBLES” project (GOCE –CT-2003-505539).
Edited by: P. Alpert, H. Saaroni, and E. Heifetz Reviewed by: two anonymous referees
References
Alexandersson, H.: A homogeneity test applied to precipitation data, J. Climatol., 6, 661–675, 1986.
Alpert, P., Ben-Gai, T., Baharad, A., Benjamini, Y., Yekutieli, D., Colacino, M., Diodato, L., Ramis, C., Homar, V., Romero, R., Michaelides, S., and Manes, A.: The paradoxical increase of Mediterranean extreme daily rainfall in spite of decrease in to-tal values, Geophys. Res. Lett., 29, 11, 31-1–31-4, 2002. Anagnostopoulou, Chr., Tolika, K., Maheras, P., Kutiel, H., and
Flo-cas, H. A.: Performance of the General Circuluation HadAM3P Model in simulating circulation types over the Mediterranean re-gion, Int. J. Climatol., doi:10.1002/JOC.1521, 2007.
Hellstrom, C.: Atmospheric conditions during extreme and non-extreme precipitation events in Sweden, Int. J. Climatol., 25, 631–348, 2005.
Kalnay, E., and co- authors: The NCEP/NCAR 40-year Reanalysis project, Bull. Am. Meteorol. Soc., 77, 437–471, 1996.
Maheras, P.: Climatologie de la mer Eg´ee et de ses marges conti-nentales, Th´ese d’Etat, Atelier de Reproduction de Th`eses, Univ. Lille III, 783 pp., 1982.
Maheras, P.: Situations synoptiques et analyse factorielle des
pr´ecipitations torrentielles >29.8 mm/24heures en Gr`ece, La M´et´eorologie, 34, 133–143, 1983.
Maheras, P. and Anagnostopoulou, Chr.: Circulation types and their influence on the interannual variability and precipitation changes in Greece, in: Mediterranean Climate-Variability and Trends, edited by: Boole, H. J., Springer Verlag, Berlin, 215–239, 2003. Santos, J. A., Corte-Real, J., Ulbrich, U., and Palutikof, J.: Euro-pean winter precipitation extremes and large-scale circulation: a coupled model and its scenarios, Theor. Appl. Climatol., 87, 85– 102, 2007.
Tolika, K., Maheras, P., Flocas, H. A., Arseni-Papadimitriou, A., and Vafiadis, M.: Simulation of seasonal precipitation and rain-days over Greece: A statistical downscaling technique based on artificial neural networks (ANNs), Int. J. Climatol., 27, 861–881, 2007.
Zhang, X., Aquilar, E., Sensoy, S., Melkonyan, H., Tagiyeva, U., Ahmed, N., and co-authors.: Trends in Middle East climate ex-treme indices from 1950-2003, J. Geophys. Res., 11, D22104, doi:10.2029/2005JD006181, 2005.