HAL Id: hal-00295339
https://hal.archives-ouvertes.fr/hal-00295339
Submitted on 6 Oct 2003
HAL is a multi-disciplinary open access
archive for the deposit and dissemination of
sci-entific research documents, whether they are
pub-lished or not. The documents may come from
teaching and research institutions in France or
abroad, or from public or private research centers.
L’archive ouverte pluridisciplinaire HAL, est
destinée au dépôt et à la diffusion de documents
scientifiques de niveau recherche, publiés ou non,
émanant des établissements d’enseignement et de
recherche français ou étrangers, des laboratoires
publics ou privés.
C. S. Zerefos, K. Eleftheratos, D. S. Balis, P. Zanis, G. Tselioudis, C. Meleti
To cite this version:
C. S. Zerefos, K. Eleftheratos, D. S. Balis, P. Zanis, G. Tselioudis, et al.. Evidence of impact of aviation
on cirrus cloud formation. Atmospheric Chemistry and Physics, European Geosciences Union, 2003,
3 (5), pp.1633-1644. �hal-00295339�
Chemistry
and Physics
Evidence of impact of aviation on cirrus cloud formation
C. S. Zerefos1, K. Eleftheratos1, D. S. Balis2, P. Zanis3, G. Tselioudis4, and C. Meleti2
1Laboratory of Climatology & Atmospheric Environment, Faculty of Geology, National & Kapodistrian University of
Athens, Greece
2Laboratory of Atmospheric Physics, Aristotle University of Thessaloniki, Greece 3Research Centre for Atmospheric Physics & Climatology, Academy of Athens, Greece 4Goddard Institute for Space Studies, National Aeronautics and Space Administration, USA
Received: 28 May 2003 – Published in Atmos. Chem. Phys. Discuss.: 30 June 2003 Revised: 18 September 2003 – Accepted: 2 October 2003 – Published: 6 October 2003
Abstract. This work examines changes in cirrus cloud cover
(CCC) in possible association with aviation activities at con-gested air corridors. The analysis is based on the latest ver-sion of the International Satellite Cloud Climatology Project D2 data set and covers the period 1984–1998. Over the stud-ied areas, the effect of large-scale modes of natural climate variability such as ENSO, QBO and NAO as well as the pos-sible influence of the tropopause variability, were first re-moved from the cloud data set in order to calculate long-term changes of observed cirrus cloudiness. The results show in-creasing trends in (CCC) between 1984 and 1998 over the high air traffic corridors of North America, North Atlantic and Europe. Of these upward trends, only in the summer-time over the North Atlantic and only in the wintersummer-time over North America are statistically significant (exceeding +2.0% per decade). Over adjacent locations with low air traffic, the calculated trends are statistically insignificant and in most cases negative both during winter and summer in the regions studied. These negative trends, over low air traffic regions, are consistent with the observed large scale negative trends seen in (CCC) over most of the northern middle latitudes and over the tropics. Moreover, further investigation of vertical velocities over high and low air traffic regions provide evi-dence that the trends of opposite signs in (CCC) over these regions, do not seem to be caused by different trends in dy-namics. It is also shown that the longitudinal distribution of decadal changes in (CCC) along the latitude belt centered at the North Atlantic air corridor, parallels the spatial distri-bution of fuel consumption from highflying air traffic, pro-viding an independent test of possible impact of aviation on contrail cirrus formation. The correlation between the fuel consumption and the longitudinal variability of (CCC) is sig-nificant (+0.7) over the middle latitudes but not over the trop-ics. This could be explained by the fact that over the tropics
Correspondence to: C. S. Zerefos
the variability of (CCC) is dominated by dynamics while at middle latitudes microphysics explain most of its variabil-ity. Results from this study are compared with other studies and for different periods of records and it appears that there exists general agreement as to the evidence of a possible avi-ation effect on high cloud positive trends over regions with congested air traffic.
1 Introduction
Cirrus clouds are the most common form of high-level clouds forming in the vicinity of the tropopause. In the tropics, their formation is mainly triggered by deep convection (Jensen et al., 1996) while over the northern middle latitudes, they are associated to the existence of large ice supersaturated regions in the upper troposphere (Gierens et al., 2000). Cirrus cloud formation depends strongly on the existence of small par-ticles that provide the nucleus for ice crystals (Jensen and Toon, 1997). Cirrus clouds have alternately two opposite effects; an IR greenhouse effect and a solar albedo effect. Which effect dominates, depends strongly on optical proper-ties. Thin cirrus clouds usually produce a positive radiative forcing (RF) at the top of the atmosphere while thick cirrus clouds may cause cooling (Stephens and Webster, 1983; Fu and Liou, 1993; Fahey and Schumann, 1999).
Contrails are visible line-shaped clouds that form in the wake of the aircraft, when the relative humidity in the plume of exhaust gases mixing with ambient air temporarily reaches liquid saturation, so that liquid droplets form on cloud con-densation nuclei and soon freeze to ice particles (Schu-mann, 2002). Parameters determining contrail formation and persistence are analytically described in Schumann (1996). Contrails may evaporate quickly when the ambient air is dry, or persist for hours when the ambient air is substan-tially supersaturated with respect to ice (Jensen et al., 1998). Ice supersaturated regions in the upper troposphere of the
northern middle latitudes are very common (Gierens et al., 1999; Jensen et al., 2001). These regions and the number of aircraft flights in these regions control the area of the Earth covered by persistent contrails (Fahey and Schumann, 1999). The influence of contrails on the radiation budget depends mainly on their fraction of sky area covered and on their op-tical depth (Meyer et al., 2002; Schumann, 2002). As in the case of thin layers of cirrus clouds, contrails usually produce a small heating at the top of the atmosphere and there are numerous studies on regional and global estimates of con-trail radiative forcing (e.g. Meerkoetter et al., 1999; Minnis et al., 1999; Marquart and Mayer 2002; Meyer et al., 2002; Ponater et al., 2002). The most recent IPCC report (IPCC, 2001) adopted the best estimate of 20 mW/m2 for RF from contrails, which can range between 5 to 60 mW/m2(Fahey and Schumann, 1999).
Contrail occurrence and coverage have been observed us-ing satellite and ground-based observations. The mean cov-erage of line-shaped contrails is greatest over the USA, over Europe and over the North Atlantic (Fahey and Schumann, 1999). Across the continental USA, most contrails pre-vail in winter and decreasing during the summer reaching a pronounced minimum in September (Minnis et al., 2003). Bakan et al. (1994), using NOAA/AVHRR infrared images, found a mean contrail cover of 0.5% over the eastern At-lantic/western Europe and showed that the highest contrail coverage (>2%) lies along the North Atlantic air routes dur-ing the summertime. Sausen et al. (1998) calculated a global contrail cover value of 0.09%, with maximum values exceed-ing 5% over certain regions in the USA. Comparable esti-mates of regional and global contrail cover can be found in Meyer et al. (2002) and in Ponater et al. (2002).
Few studies have examined trends in cirrus cloudiness. Wylie and Menzel (1999), showed evidence of a gradual in-crease in the occurrence of high clouds in the northern mid-dle latitudes (+0.5% yr−1), while the change in the southern middle latitudes was considered insignificant due to the very small cloud coverage. Boucher (1999) calculated seasonal and annual mean global and regional trends in cirrus occur-rence over land and ocean for the period 1982–1991. The highest increases in annual mean cirrus occurrence were ob-served over the main air flight corridors (i.e. +13.3% per decade over the northeastern USA and +7.1% per decade over the North Atlantic air corridor). Boucher (1999) stated that a search for other possible causes of increased cirrus, such as the effects of the El Chichon and Mount Pinatubo volcanic aerosols, or long-term changes in relative humidity and climate variations related to the North Atlantic Oscilla-tion, could not explain solely the observed trend in (CCC) and its regional distribution. More recently, Minnis et al. (2001), calculated trends in high cloud cover over air traffic and low-air traffic regions and found a statistically significant increase in high cloud cover over areas where air traffic was heaviest relative to other regions, concluding that air traffic could cause an increase in cloud cover. Trends in cirrus-high
level clouds over regions with contrail coverage greater than or less than 0.5% were summarized by Fahey and Schumann (1999) (Table 3–51. Both satellite data and surface observa-tions showed larger increases in cirrus-high level cloudiness over regions where contrails were expected to occur more frequently than in all other regions.
Although satellite and surface-based observations of sea-sonal and decadal changes in cirrus frequency of occur-rence over main air traffic regions suggested a possible re-lationship between air traffic and cirrus formation, Fahey and Schumann (1999) stressed the difficulty to attribute ob-served changes in cirrus cover to aircraft emissions. The aim of the present work is to provide a new look at previously suggested (CCC)-aviation relationships by studying updated (CCC) time series, freed from natural oscillations, averaged over high and low air traffic areas.
2 Data sources and methodology
The cloud dataset analyzed in this study is produced by the International Satellite Cloud Climatology Project (ISCCP) (Rossow et al., 1996). The data set contains detailed infor-mation on the distribution of cloud radiative properties and their diurnal and seasonal variations, as well as information on the vertical distribution of temperature and humidity in the troposphere. The data are based on observations from the suite of operational geostationary and polar orbiting satel-lites. Visible radiances are used to retrieve the optical thick-ness of clouds and infrared radiances to retrieve cloud top temperature and pressure. The revised (D2) version of the data set used in this study has a spatial resolution of 280 km (2.5 degrees at the equator) and provides monthly averages of cloud properties and their diurnal variation. For each map grid-box, both the mean properties of the cloud field and the properties of fifteen different cloud types are provided. The cloud types are derived based on radiometric definitions that rely on cloud optical thickness and cloud top pressure. Cir-rus clouds are defined as those with optical thickness less than 3.6 and cloud top pressure less than 440 mb.
The air traffic density over the globe is examined us-ing the aviation fuel consumption inventory (civil and mil-itary) as determined by the Deutsches Zentrum f¨ur Luft- und Raumfahrt (DLR). The method used by DLR to produce this dataset has been described by Schmitt and Brunner (1997) and has been used in national and international work pro-grams, such as the IPCC report, where it was noted that among other global inventories of civil and military aircraft fuel emissions, DLR fuel consumption inventory is suitable for calculating the effects of aircraft emissions on the atmo-sphere (Henderson and Wickrama, 1999). The emission data
1Fahey and Schumann (1999) included that table based on con-tributions from unpublished work by Dr. Patrick Minnis (the paper cited with that table was submitted but not published until Minnis et al., 2001).
-180
-120
-60
0
60
120
180
Longitude
-90
-60
-30
0
30
60
90
Lat
itu
de
4 x 10
-412 x 10
-420 x 10
-428 x 10
-436 x 10
-480 x 10
-4160 x 10
-4240 x 10
-4320 x 10
-4400 x 10
-41200 x 10
-4Fig. 1. Total fuel consumption from aviation (in Tg of fuel) at 10–11 km height in the wintertime (December-January-February-March). Rectangles correspond to regions with high and low air traffic in which (CCC) averages have been studied. North America: high air traffic region (30◦N–50◦N, 65◦W–105◦W), adjacent low air traffic region (30◦N–50◦N, 105◦W–145◦W). North Atlantic: high air traffic region (40◦N–60◦N, 35◦W–60◦W), adjacent low air traffic region (20◦N–40◦N, 35◦W–60◦W). Europe: high air traffic region (35◦N–55◦N, 10◦W–15◦E), adjacent low air traffic region (35◦N–55◦N, 15◦E–40◦E).
are monthly mean values for the year 1992 in kg, distributed over the world’s airspace by altitude, latitude and longitude. Data for every set of altitude, latitude and longitude are re-ported in an equal-area map grid with a 2.8◦latitude × 2.8◦
longitude horizontal resolution and 1 km vertical resolution. There are totally 17 altitude levels. The major air traffic cor-ridors are found in the northern middle latitudes at cruising altitudes between 10–11 km.
After Mount Pinatubo eruption in June 1991, ISCCP de-tected a significant decrease of thin cirrus clouds, particu-larly over the ocean, accompanied by a comparable increase of altocumulus and cumulus clouds. In contrast, results from the split-window observations and 3I data, did not show any significant change in thin cirrus associated with the volcanic eruption over both ocean and land (Luo et al., 2002). The apparent large decrease of thin cirrus in the ISCCP data set was reported as a satellite artifact due to the additional visible reflection by volcanic aerosols hanging around in the strato-sphere (Rossow and Schiffer, 1999). Because of the contam-ination of the satellite signal by the Mt. Pinatubo eruption, cirrus cloud data taken between January 1991 and June 1993 were not used in our analysis.
The effect of natural phenomena on (CCC), such as ENSO, QBO and the NAO, has been examined in detail in Zerefos et al. (2003). It was found that over certain latitudinal belts, a significant part of the cirrus cloud variability could be at-tributed to ENSO and NAO fluctuations. While ENSO and
QBO effects were found to be insignificant over the northern middle latitudes, the North Atlantic Oscillation perturbs di-rectly cirrus cloudiness over the North Atlantic Ocean and Europe, since it affects the frequency and the intensity of baroclinic storms from which cirrus clouds mainly form in these regions (Tselioudis and Jakob, 2002). Therefore, it was necessary to isolate and remove from the data set the effect of these large-scale modes of natural climate variabil-ity, in order to search for other possible impacts on cirrus cloud long-term changes (i.e from aviation). These effects were removed by using a simple multiple regression statis-tical model for the cirrus cloud variations at each individual grid box:
CCC(i, j )=S(i, j )+ENSO(i, j )+QBO(i, j )
+NAO(i, j )+residuals (1)
Where i denotes the month and j is the year of (CCC) and its components, i.e., the seasonal (S), the ENSO, the QBO and the NAO as described by Zerefos et al. (1994). (CCC) data were deseasonalized by subtracting the long-term monthly mean (1984–1998) pertaining to the same calendar month. The QBO and ENSO components were removed by using a phase lag with max correlation. Cirrus cloud changes could also be related to dynamical variability seen for example in trends of tropopause temperatures as well as trends in con-vective activity. The possible effect of the tropopause vari-ability on cirrus cloud changes over the regions examined
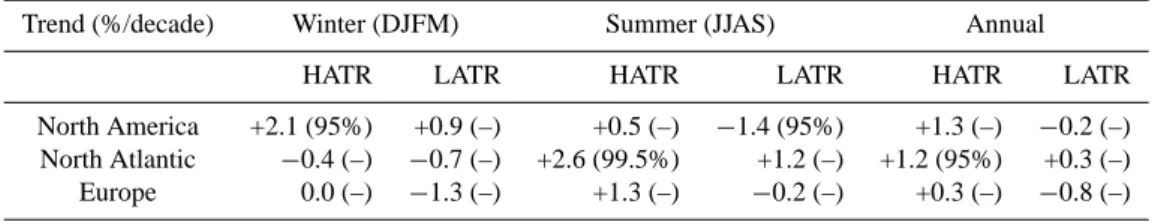
Table 1. Seasonal and annual trends in (CCC) (% per decade) from ISCCP satellite cirrus cloud data set (1984–1998) for regions categorized as having high and low air traffic for 1992 aircraft operations. Values in brackets refer to statistical significance of each trend. Dashes in brackets indicate a confidence level less than 95%
Trend (%/decade) Winter (DJFM) Summer (JJAS) Annual
HATR LATR HATR LATR HATR LATR
North America +2.1 (95%) +0.9 (–) +0.5 (–) −1.4 (95%) +1.3 (–) −0.2 (–) North Atlantic −0.4 (–) −0.7 (–) +2.6 (99.5%) +1.2 (–) +1.2 (95%) +0.3 (–) Europe 0.0 (–) −1.3 (–) +1.3 (–) −0.2 (–) +0.3 (–) −0.8 (–)
HATR: high air traffic region LATR: adjacent low air traffic region
(i.e. high and low air traffic) was removed with simple linear regression analysis applied to the residuals from Eq. (1). This tropopause temperature was taken from the independently produced NCEP/NCAR reanalysis data set for the same pe-riod. As an index of convective activity in the regions stud-ied, use was made of the monthly mean vertical velocities at 300 hPa computed on a 2.5◦grid from the NCEP/NCAR reanalysis dataset.
The ISCCP cloud properties have been tested extensively both against other satellite cloud retrievals and against sur-face cloud observations (Rossow and Schiffer, 1999). In the latest (D-series) version of the ISCCP dataset, changes in the retrieval thresholds and the inclusion of an ice microphysics model for retrieval of optical thicknesses and top tempera-tures of cold clouds, have improved the agreement of cirrus cloud amounts with both surface observations (Rossow and Schiffer, 1999) and an analysis of High-Resolution Infrared Sounder (HIRS) data (Stubenrauch et al., 1999). A small un-derestimate of ISCCP cirrus cloud amounts (∼5% at middle northern latitudes) compared to the HIRS results is caused by missed detection of very thin clouds (Stubenrauch et al., 1999; Rossow and Schiffer, 1999).
The cloud analysis in this study is done in a way that at-tempts to minimize potential systematic errors in the cirrus trends. Adjacent regions observed by the same satellite are chosen for comparison, in order to avoid trends introduced by differences in satellite calibration and to minimize dif-ferences due to illumination geometry. This provides con-fidence that, even with the uncertainty in retrieving cirrus cloud properties from satellite observations, the trends de-rived in the study reflect a real change in the amount of the cloud type defined as cirrus by the ISCCP retrieval process. These trends have been evaluated as to their statistical signif-icance by applying the t-test in each trend estimate against the null hypothesis of no-trend for the appropriate number of degrees of freedom (Wonnacot and Wonnacot, 1982). The independence of data with each other is ensured because the non-random part of the series (seasonal, ENSO and other climatological variations) has been filtered as mentioned be-fore.
3 Results and discussion
Figure 1 shows the spatial distribution of the total fuel burned throughout the colder months of 1992 (in Tg of fuel at 10–11 km height, provided by DLR). From that figure it is evident that the most congested air traffic areas are found over the northern middle latitude belt between 35◦N–55◦N
(United States, Europe and the North Atlantic air flight corri-dor). The seasonal dependence in aviation fuel consumption can be quite large only for some regions such as the North Atlantic and the North Pacific with a maximum in the bo-real summer and a minimum during winter (Henderson and Wickrama, 1999). Over the tropical latitudes of the northern hemisphere (5◦N–25◦N), fuel consumption is much lower.
Regions that correspond to different air traffic load were selected (seen as rectangles in Fig. 1) in order to investigate the possible impact of aviation on the long-term changes in cirrus cloudiness. More specifically, two adjacent regions one with low and another with high air traffic over North America, the North Atlantic Ocean and over Europe were selected, respectively. Care was taken to select regions expe-riencing similar trends in their climatological characteristics as well as to avoid interference from different satellites and therefore different instruments “observing” adjacent regions. Table 1 summarizes decadal long-term changes in cirrus cloudiness calculated for the selected regions in winter, sum-mer and the whole year. The long-term changes were esti-mated as the increase or decrease of (CCC) in (%) per decade inferred from a least square linear fit to the data. As can be seen from Table 1, the long-term interannual variations in (CCC) over high air traffic regions are generally positive and larger than those over the adjacent low air traffic regions. The largest increase is found along the North Atlantic air flight corridor in the summer, about +2.6% per decade, which is statistically significant at the 99.5% confidence level. It is anticipated that this trend is possibly independent of trends in tropopause temperatures over the North Atlantic corridor, because the trends in cirrus remain statistically significant even after removing the tropopause variability together with all other natural fluctuations. It should be also noted that
1984
1986
1988
1990
1992
1994
1996
1998
Years
5
10
15
20
5
10
15
20
C
ir
rus
c
lo
ud
co
v
er
(
%
)
5
10
15
20
N. America (High Air Traffic Region)
N. America (Low Air Traffic Region)
N. Atlantic (High Air Traffic Region)
N. Atlantic (Low Air Traffic Region)
Europe (High Air Traffic Region)
Europe (Low Air Traffic Region)
Fig. 2c
Fig. 2b
Fig. 2a
HATR: +0.5 %/ decade ( <90%)
LATR: -1.4 %/ decade ( 95%)
H ATR: +2.6 %/ decade ( 99.5%)
LATR: +1.2 %/ decade ( <90%)
H ATR: +1.3 %/ decade ( <90%)
LATR: -0.2 %/ decade ( <90%)
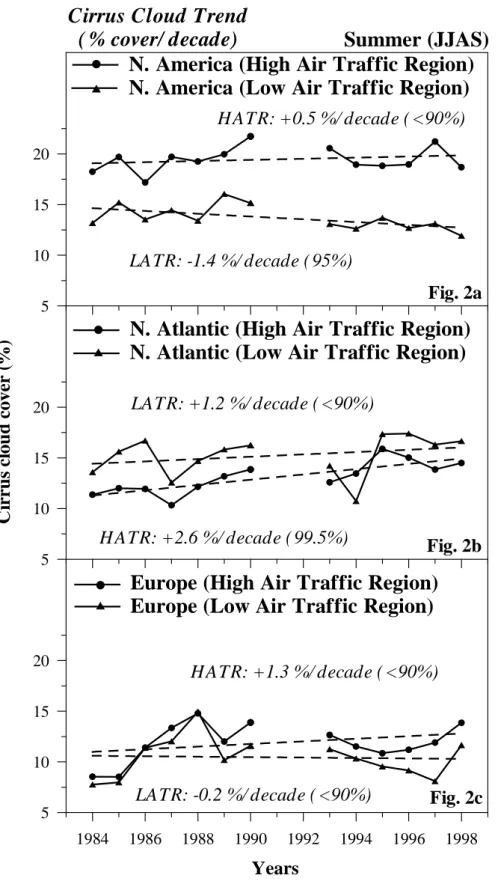
Summer (JJAS)
Cirrus Cloud Trend
( % cover/ decade)
Fig. 2. (a) Trends in (CCC) (% per decade) in the summertime (June-July-August-September) at selected regions over North America with high and low air traffic. (b) Same as (a) but for the North Atlantic. (c) Same as (a) but for Europe.
the corresponding trend over the adjacent low air traffic lo-cation in the North Atlantic (viewed by the same satellite) is smaller (+1.2% per decade) and not statistically significant. These trends in (CCC) are also summarized for the summer in Figs. 2a, b and c. Over North America and Europe in the summertime, they amount to about +0.5% and +1.3% per decade, respectively (Figs. 2a and c). Over the adjacent low air traffic locations of North America and Europe, (CCC) de-crease by about −1.4% and −0.2% per decade, respectively. The differences in trends in (CCC) east and west of the Rockies and east and west of the west coast of Europe, over the northern middle latitudes of the northern hemisphere (seen in Fig. 2) could have also been caused by differences in trends in dynamics. If this was the case, however, then the trends in convective activity should have had opposite signs (e.g. east and west of the Rockies). Using as a proxy index of dynamics in the upper troposphere the vertical ve-locities at 300 hPa (averaged over the warm months, JJAS) the observed trends are on both sides of the Rockies nega-tive (the order of −1 mPa/s per decade). The difference in dynamics hypothesized for Europe is also not justified by the observations. Over the European high air traffic region the average cirrus cloud amount is 11.9% statistically insignifi-cantly different when compared to the amount of 10.5% that is observed over the low air traffic region in Europe. Also the trends in dynamic proxy of vertical velocities at 300 hPa are of the same sign, i.e. the different sign in (CCC) trends can-not be attributed to different trends in the vertical velocities at 300 hPa. Moreover, there is no evidence in recent stud-ies (Paciorek et al., 2002) that the character of extra tropical storm changes is different between western and eastern US regions or between western and eastern Europe. Therefore, the difference in cirrus trends between those locales cannot be attributed to different trends in dynamical conditions.
Going back to Table 1 we see that over North America in winter, when there is the highest contrail frequency of occur-rence (Sausen et al., 1998; Ponater et al., 2002; Minnis et al., 2003), the calculated trend in (CCC) is statistically signifi-cant at the 95% confidence level (+2.1% per decade). The changes in annual mean (CCC) over the high air traffic cor-ridors of North America, North Atlantic and Europe, amount to +1.3%, +1.2% and +0.3% per decade, respectively, and are statistically significant only over the North Atlantic air corri-dor (95% confidence level). Over the adjacent low air traffic locations, the corresponding trends amount to about −0.2%, +0.3% and −0.8% per decade, respectively and they follow the negative course of global trends in (CCC) observed both over the northern mid-latitudes (−0.5% per decade) and over the tropics (−0.9% per decade) as seen in Fig. 3.
Over regions where the main air routes exist, it was ex-pected that a change in cirrus cloudiness within a decade could be related to air traffic density, concerning the large increase of transatlantic flights since the 80’s and the trans-formation of persistent contrails to thin cirrus clouds. To in-vestigate this assumption, decadal changes in (CCC) were
computed after removing the effects of ENSO, QBO and NAO perturbations on cirrus clouds as well as the effect of tropopause variability. Figure 4 shows the longitudinal distri-bution of the percentage change of (CCC) from 1984–1986 to 1994–1996 and of the total fuel consumption in 1992 in the wintertime (December, January, February, March). For com-parison we present two figures: Figure 4a shows the change in (CCC) over high air traffic locations in middle latitudes (35◦N–55◦N) and Fig. 4b shows the change in (CCC) over low air traffic locations in the tropics (5◦N–25◦N).
From Fig. 4a it appears that the longitudinal distribution of decadal changes in (CCC) along the latitude belt centered at the North Atlantic air corridor, parallels the fuel consump-tion curve from highflying air traffic. The spatial distribu-tion of the two variables has a significant positive correladistribu-tion coefficient (R=+0.7). The correlation suggests that the ap-parent increase of thin cirrus clouds, about 21% over North America and about 8% over Europe, could be related to con-trail cloudiness formed by aviation activities. Over East Asia however, the existence of complex circulation conditions in the area may mask this issue. This analysis was also per-formed for the summer months, where it was found that the largest increases in cirrus cloudiness are found over Europe (∼17%) and the North Atlantic air corridor (∼25%).
At lower latitudes (5◦N–25◦N), the air traffic density is much lower and the correlation is insignificant (Fig. 4b) but yet the longitudinal variability of (CCC) is as high as over the middle latitudes. This is more probably due to the fact that in tropical latitudes, cirrus clouds are formed primarily from vertical water vapor transport by convective processes. As a result, tropical cirrus amounts are controlled by local temper-ature conditions and moisture sources and any trend in those conditions would leave a signature on the cirrus cloud field. Therefore, the tropical cirrus trends could reflect trends in the local temperature and moisture field. In the middle lat-itudes, on the other hand, cirrus formation is controlled by baroclinic processes that are to a great extent independent of local conditions and depend on global wave patterns. There-fore, any localized modulation of mid-latitude cirrus cloud properties would be related more strongly to microphysical rather than dynamical condition changes. The results are shown in Fig. 5, where it is seen that long-term changes in vertical velocities are significantly correlated over the trop-ics (−0.4) with corresponding changes in (CCC) but are not significantly correlated (−0.2) over middle latitudes both in wintertime and in the summertime (not shown here).
4 Comparison with previous studies
In order to validate the accuracy of our computed trend val-ues, we have compared our results with results from previous studies examining long-term changes in high level cloudi-ness and their possible relationship to contrails. Two tables are shown: Table 2 shows trends in (CCC) from this study in
1984 1986 1988 1990 1992 1994 1996 1998 2000
Years
-4 0 4 -4 0 4N. Atlantic HATR (+1.2 %/decade) (95%)
N. extra tropics (-0.5 %/decade) (95%)
Tropics (-0.9 %/decade) (99%)
Fig. 3a
Fig. 3b
Global trends in cirrus cloud cover (% per decade)
C
irr
u
s cl
o
u
d
co
v
er (
%
)
Fig. 3. (a) Trends in (CCC) (% per decade) for the period 1984–1998 over the northern extra tropics (30◦N–70◦N, 180◦W–180◦E) and the North Atlantic high air traffic region (40◦N–60◦N, 35◦W–60◦W). (b) Same as (a) but for the tropics (30◦S–30◦N, 180◦W–180◦E).
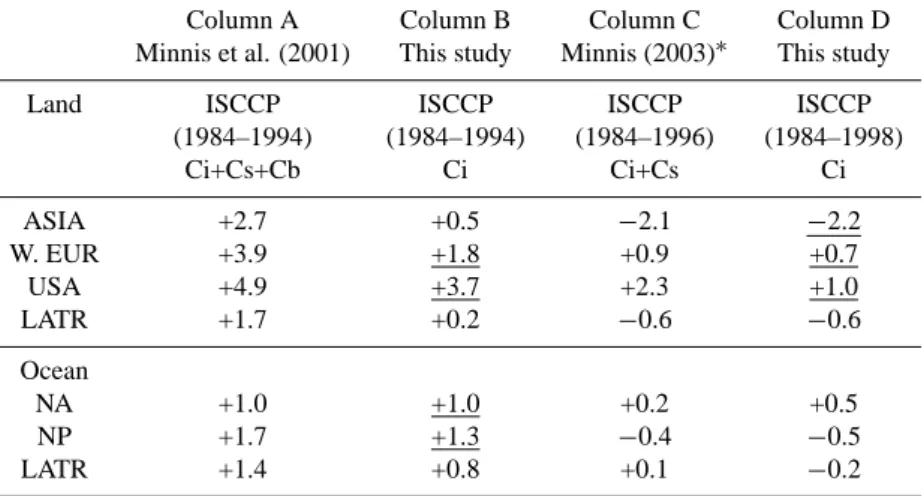
Table 2. Comparison between trends (% per decade) in annual mean high cloud cover as given by Minnis et al. (2001) and trends (% per decade) in annual mean (CCC) calculated over land and over ocean air traffic and low-air traffic regions. Underlined are statistically significant at the 95% confidence level. Land air traffic regions are: Asia (ASIA; 35◦N–70◦N, 90◦E–180◦E), Western Europe (W. EUR; 40◦N–60◦N, 10◦W–15◦E) and United States of America (USA; 30◦N–50◦N, 50◦W–130◦W). Land LATR includes the remainder of the land regions (70◦S–70◦N, 180◦W–180◦E). Ocean air traffic regions are: North Atlantic (NA; 35◦N–70◦N, 70◦W–20◦E) and North Pacific (NP; 30◦N–70◦N, 120◦E–110◦W). Ocean LATR includes the remainder of the ocean regions (70◦S–70◦N, 180◦W–180◦E).
Column A Column B Column C Column D
Minnis et al. (2001) This study Minnis (2003)∗ This study
Land ISCCP ISCCP ISCCP ISCCP
(1984–1994) (1984–1994) (1984–1996) (1984–1998) Ci+Cs+Cb Ci Ci+Cs Ci ASIA +2.7 +0.5 −2.1 −2.2 W. EUR +3.9 +1.8 +0.9 +0.7 USA +4.9 +3.7 +2.3 +1.0 LATR +1.7 +0.2 −0.6 −0.6 Ocean NA +1.0 +1.0 +0.2 +0.5 NP +1.7 +1.3 −0.4 −0.5 LATR +1.4 +0.8 +0.1 −0.2 ∗Private communication (2003)
-18 0 -140 -10 0 -6 0 -2 0 20 60 100 140 18 0
Longitude
-30 -20 -10 0 10 20 30 0 0.4 0.8 1.2 -30 -20 -10 0 10 20 30 0 0.4 0.8 1.2Cold period (DJFM) 35-55N
Cold period (DJFM) 5-25N
R= +0.1 (<90%)
R= +0.7 (99%)
Change (in %) of cirrus cloud cover
from 1984-1986 to 1994-1996 in DJFM
Aviation fuel consumption in 1992 (Tg)
A
v
ia
tio
n
fu
el
co
ns
u
m
pt
io
n
(T
g
)
C
h
a
n
ge
(
in %)
of
c
ir
rus
cl
o
u
d
co
v
er
Fig. 4a
Fig. 4b
Fig. 4. (a) Longitudinal distribution of the percentage changes of (CCC) and their standard errors from 1984–1986 to 1994–1996 and of the total fuel consumption in 1992 in the wintertime (DJFM), over heavy air traffic locations (35◦N–55◦N). (b) Same as (a) but for low air traffic locations (5◦N–25◦N). Values on the abscissa correspond to 36 equal regions of 10 degrees longitude, from west to east, in which (CCC) and fuel consumption have been averaged for the two latitudinal belts. R is the correlation coefficient between the two lines.
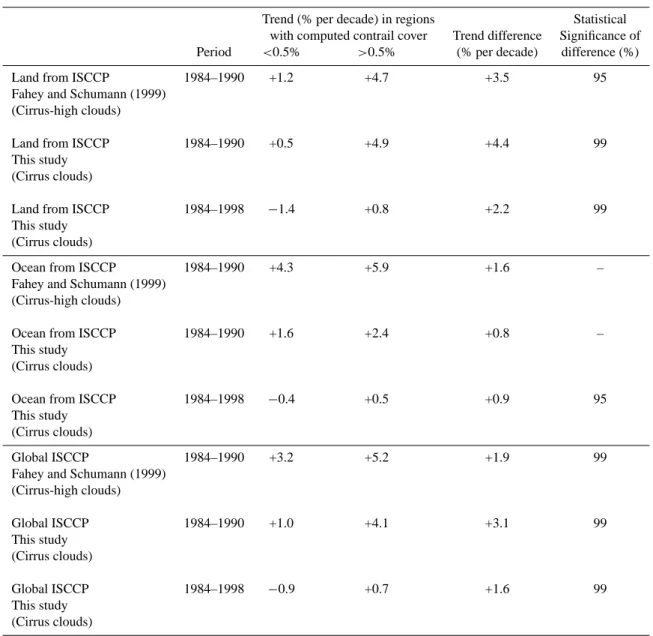
comparison to corresponding trends in high level cloudiness over large air traffic and low-air traffic areas as defined by Minnis et al. (2001). Table 3 shows trends in (CCC) from this study in comparison to trends in cirrus-high level cloudiness as given by Fahey and Schumann (1999), over regions cate-gorized as having a mean value of contrail coverage less than or greater than 0.5% as computed by Sausen et al. (1998).
Column A in Table 2, shows trends in annual mean high cloud cover (cirrus (Ci) + cirrostratus (Cs) + deep convec-tive (Cb)) from ISCCP 1984–1994 satellite observations as given by Minnis et al. (2001) and column B shows trends in annual mean (CCC) from this study after removing the effects of ENSO, QBO and NAO perturbations as well as the tropopause variability. The trends were calculated as follows: monthly means averaged over each large region from July 1983–May 1991 and July 1993–August 1994 were used and the trends were calculated based on monthly mean
values, not annual, so the monthly trends were multiplied by 12 (Minnis, 2003, private communication). Column C shows more recent estimates of trends in annual mean Ci+Cs cloud cover from ISCCP 1984–1996 satellite observations by Minnis (2003, private communication) and column D shows trends in annual mean (CCC) for the period 1984–1998 as calculated in this study. In order to be consistent with Minnis et al. (2001), trends in column D were calculated based on monthly mean values, so the monthly trends were multiplied by 12.
As can be seen from Table 2, the calculated trends from this study show consistent similarities to the corresponding values given by Minnis et al. (2001) even after remov-ing the tropopause variability together with all other natu-ral fluctuations. It also appears that trends in (CCC) over Air Traffic Regions (ATR) are larger than those found over the Low-Air Traffic Regions (LATR). Analytically, for the
-1 80 -1 40 -1 00 -60 -20 20 60 10 0 14 0 18 0 Longitude -30 -20 -10 0 10 20 30 -20 -10 0 10 20 -30 -20 -10 0 10 20 30 -20 -10 0 10 20 Cold period (DJFM) 35-55N Cold period (DJFM) 5-25N R= -0.4 (99%) R= -0.2 (<90%) D if fer ence (in m P a /s ) in v er tic a l v el oci tie s C h an ge ( in %) of ci rrus cl oud cover
Change (in %) of cirrus cloud cover
from 1984-1986 to 1994-1996 in DJFM
Difference (in mPa/s) in vertical velocities at 300 hPa
between 1994-1996 and 1984-1986 in DJFM
Fig. 5a
Fig. 5b
Fig. 5. (a) Longitudinal distribution of the percentage changes of (CCC) and their standard errors from 1984–1986 to 1994–1996 and of the differences in vertical velocities at 300 hPa between 1994–1996 and 1984–1986 in the wintertime (DJFM), over heavy air traffic locations (35◦N–55◦N). (b) Same as (a) but for low air traffic locations (5◦N–25◦N). Values on the abscissa correspond to 36 equal regions of 10 degrees longitude, from west to east, in which (CCC) and vertical velocities have been averaged for the two latitudinal belts. R is the correlation coefficient between the two lines.
period 1984–1994, our trend calculations over land (ATR) are the following: over the United States of America (USA) and western Europe (W. EUR), there are statistically signifi-cant increasing trends in annual mean (CCC) by about +3.7% and +1.8% per decade respectively, which are again consis-tent to the results given by Minnis et al. (2001). Over Asia and the remaining land LATR, the cirrus trends are not sta-tistically significant (+0.5% and +0.2% per decade). Over the North Atlantic (NA) and the North Pacific (NP) (ocean ATR), the trends in (CCC) amount to +1.0% and +1.3% per decade, respectively and are statistically significant at the 95% confidence level. Over the remaining ocean LATR, the trends in (CCC) are not statistically significant (+0.8% per decade). More recent estimates of trends in annual mean Ci+Cs cloud cover by Minnis (2003, private communication)
for the period 1984–1996 (column C), show a general de-crease in cloud cover relative to the period 1984–1994, over all land and ocean ATR and LATR. Similar trends in (CCC) are also observed for the period 1984–1998 (column D).
Fahey and Schumann (1999) summarized trends of (CCC) over areas defined by Sausen et al. (1998) in which con-trail coverage either exceeded or was less than 0.5%. In this study to define regions with high and low contrail coverage we have used the fuel consumption data set. It was assumed that high and low contrail regions are found within areas with high and low air traffic and therefore the cirrus trends were calculated for these regions. More specifically, land con-trail regions were assumed to be over the USA (30◦N–50◦N, 50◦W–130◦W), Europe (40◦N–60◦N, 10◦W–15◦E) while the ocean contrail regions were assumed to be confined over
Table 3. Comparison between trends (% per decade) in cirrus-high cloud amounts as given by Fahey and Schumann (1999) and trends (% per decade) in cirrus cloud amount, calculated for regions categorized as having a mean value of contrail coverage less than or greater than 0.5% as computed by Sausen et al. (1998). Statistical significance refers to level of confidence in difference between trends for the two regions. Dashes indicate a confidence level less than 95%
Trend (% per decade) in regions Statistical with computed contrail cover Trend difference Significance of Period <0.5% >0.5% (% per decade) difference (%)
Land from ISCCP 1984–1990 +1.2 +4.7 +3.5 95
Fahey and Schumann (1999) (Cirrus-high clouds)
Land from ISCCP 1984–1990 +0.5 +4.9 +4.4 99
This study (Cirrus clouds)
Land from ISCCP 1984–1998 −1.4 +0.8 +2.2 99
This study (Cirrus clouds)
Ocean from ISCCP 1984–1990 +4.3 +5.9 +1.6 –
Fahey and Schumann (1999) (Cirrus-high clouds)
Ocean from ISCCP 1984–1990 +1.6 +2.4 +0.8 –
This study (Cirrus clouds)
Ocean from ISCCP 1984–1998 −0.4 +0.5 +0.9 95
This study (Cirrus clouds)
Global ISCCP 1984–1990 +3.2 +5.2 +1.9 99
Fahey and Schumann (1999) (Cirrus-high clouds) Global ISCCP 1984–1990 +1.0 +4.1 +3.1 99 This study (Cirrus clouds) Global ISCCP 1984–1998 −0.9 +0.7 +1.6 99 This study (Cirrus clouds)
the North Atlantic (35◦N–70◦N, 70◦W–20◦E). The
remain-ing regions between 70◦S–70◦N and 180◦W–180◦E over land and over the ocean were chosen as the low contrail re-gions.
From Table 3 it appears that in spite of the differences in the areas selected as having high and low contrails, trends from this study show consistent similarities to the results given by Fahey and Schumann (1999). Analytically, for the period 1984–1990, the difference between trends in (CCC) over land regions with high and low contrail cover is +4.4% per decade and is statistically significant at the 99% confi-dence level. Over ocean, this trend difference is not statisti-cally significant. Over both land and ocean (global ISCCP)
the corresponding trend difference amounts to about +3.1% per decade and is statistically significant at the 99% confi-dence level. During the period 1984–1998, there is a general decrease in (CCC) over all regions with high and low contrail cover. However, over high contrail regions the cirrus trends are positive while over low contrail regions the cirrus trends are negative. Lastly, the differential increases in (CCC) over high contrail regions relative to the remaining low contrail re-gions are statistically significant at the 99% confidence level for the land and global ISCCP 1984–1998 data.
5 Conclusions
This study examined changes in (CCC) over locations where contrail formation by aviation was expected to perturb the distribution of cirrus clouds and their long-term variability. Long-term changes in (CCC) were calculated for six regions of the northern middle latitudes categorized as having high and low air traffic density for 1992 aircraft operations. Two adjacent regions one with low and another with high air traf-fic over North America, the North Atlantic Ocean and over Europe have been studied. Care was taken to select regions experiencing similar trends in their climatological character-istics and to avoid interference from different satellite instru-ments in adjacent regions. All natural oscillations have been removed from the data set. The main results of the present work can be summarized as follows.
The results confirmed the evidence for increasing trends in (CCC) between 1984 and 1998 over the high air traffic corri-dors of North America, North Atlantic and Europe. Of these upward trends, only in the summertime over the North At-lantic and only in the wintertime over North America were statistically significant (exceeding +2.0% per decade). Over adjacent locations with low air traffic, the calculated trends were statistically insignificant and in most cases negative both during winter and summer in the regions studied. These negative trends, over low air traffic regions, are consistent with the observed large scale negative trends seen in (CCC) over most of the northern middle latitudes and over the trop-ics.
Differences in trends in (CCC) east and west of the Rock-ies and east and west of the west coast of Europe over the middle latitudes of the northern hemisphere could have also been caused by different trends in dynamics. Recent studies (Paciorek et al., 2002) have found a tendency for decreases in the frequency of extra tropical storms but increase in the number of intense storms over the last 50 years. Such trends could have an effect on the properties of the mid-latitude cir-rus cloud field. However, there is no evidence in those studies that the character of extra tropical storm changes is different between western and eastern US regions or between western and eastern Europe. Therefore, the difference in cirrus trends between those locales cannot be attributed to different trends in dynamical conditions.
Moreover, it was found that the longitudinal distribution of decadal changes in (CCC) along the latitude belt cen-tered at the North Atlantic air corridor parallels the spatial distribution of fuel consumption from highflying air traffic. The two variables were strongly correlated in the wintertime (R=+0.7), providing an independent test of possible impact of aviation on contrail cirrus formation. At latitudes with low air traffic density, the observed changes in (CCC) were not related to the spatial distribution of fuel consumption al-though they were as large as those found over middle lati-tudes. This is not a paradox but can be explained by the fact that in tropical latitudes, cirrus clouds are formed primarily
from vertical water vapor transport by convective processes. As a result, tropical cirrus amounts are controlled by local temperature conditions and moisture sources and any trend in those conditions would leave a signature on the cirrus cloud field. Therefore, the tropical cirrus trends could reflect trends in the local temperature and moisture field. In the middle lat-itudes, on the other hand, cirrus formation is controlled by baroclinic processes that are to a great extent independent of local conditions and depend on global wave patterns. There-fore, any localized modulation of mid-latitude cirrus cloud properties would be related more strongly to microphysical rather than dynamical condition changes.
Trends in (CCC) from this study were compared with other studies and for different period of records (Fahey and Schu-mann, 1999; Minnis et al., 2001). As evidenced in this and in the earlier studies, in spite of the differences in datasets and time period, there is general agreement and persistent evidence of a possible aviation effect on high cloud positive trends over congested air traffic areas. However, the period under study is short for trend analyses and the results should be treated with caution particularly as the aviation effects on (CCC) are concerned. Changes in other parameters that could possibly control long-term changes in contrail cirrus over these regions such as humidity, temperature and wind shear (Schumann, 2000) have not been studied as to their interannual variability and their relationship with changes in (CCC). However, trends in other dynamical proxies (i.e. con-vective activity) have been studied and it appears that trends in dynamics cannot account alone for the observed trends in (CCC).
Acknowledgements. This study was conducted within the project “Liquid hydrogen fuelled aircraft system analysis” (CRYOPLANE, Contract No G4RD-2000-00192) and contributes to the project “Aircraft emissions: Contribution of different climate components to changes in radiative forcing, Trade-off to reduce atmospheric im-pact” (TRADE-OFF, Contract No EVK2-1999-00030) both funded by the European Commission. We acknowledge the assistance of Dr. Volker Grewe from DLR-Oberpfaffenhofen for providing the fuel consumption data for the year 1992 and of Dr. Patrick Min-nis from NASA Langley Research Center for his cooperation with the comparison of the cirrus trends. The authors are indebted to the unknown reviewers who have greatly helped improving the study.
References
Bakan, S., Betancor, M., Gayler, V., and Grassl, H.: Contrail fre-quency over Europe from NOAA-satellite images, Ann. Geo-physicae, 12, 962–968, 1994.
Boucher, O.: Air traffic may increase cirrus cloudiness, Nature, 397, 30–31, 1999.
Fahey, D. W. and Schumann, U.: Aviation-Produced Aerosols and Cloudiness, Chapter 3 in Aviation and the Global Atmosphere, A Special Report of IPCC (Intergovernmental Panel on Climate Change), Penner, J. E., Lister, D. H., Griggs, D. J., Dokken, D. J., and McFarland, M. (Eds), Cambridge University Press, Cam-bridge, UK, p. 65–120, 1999.
Fu, Q. and Liou, K. N.: Parameterization of the Radiative Properties of Cirrus Clouds, J. Atmos. Sci., 50, 2008–2025, 1993. Gierens, K., Schumann, U., Helten, M., Smit, H., and Marenco,
A.: A distribution law for relative humidity in the upper tropo-sphere and lower stratotropo-sphere from three years of Mozaic mea-surements, Ann. Geophysicae, 17, 1218–1226, 1999.
Gierens, K., Schumann, U., Helten, M., Smit, H., and Wang, P. H.: Ice-saturated regions and subvisible cirrus in the northern midlatitude upper troposphere, J. Geophys. Res, 105, 22 743– 22 754, 2000.
Henderson, S. C. and Wickrama, U. K.: Aircraft emissions: Current Inventories and Future Scenarios, Chapter 9 in Aviation and the Global Atmosphere, A Special Report of IPCC (Intergovernmen-tal Panel on Climate Change), Penner, J. E., Lister, D. H., Griggs, D. J., Dokken, D. J., and McFarland, M. (Eds), Cambridge Uni-versity Press, Cambridge, UK, p. 291–332, 1999.
Jensen, E. J., Toon, O. B., Selkirk, H. B., Spinhirne J. D., and Schoeberl, M. R.: On the formation and persistence of subvis-ible cirrus clouds near the tropical tropopause, J. Geophys. Res., 101, D16, 21 361–21 375, 1996.
Jensen, E. J. and Toon, O. B.: The potential impact of soot particles from aircraft exhaust on cirrus clouds, Geophys. Res. Lett., 24, 249–252, 1997.
Jensen, E. J., Toon, O. B., Kinne, S., Sachse, G. W., Anderson, B. E., Chan, K. R., Twohy, C. H., Gandrud, B., Heymsfield, A., and Miake-Lye, R. C.: Environmental conditions required for contrail formation and persistence, J. Geophys. Res., 103, D4, 3929–3936, 1998.
Jensen, E. J., Toon, O. B., Vay, S. A., Ovarlez, J., May, M., Bui, T. P., Twohy, C. H., Gandrud, B. W., Pueschel, R. F., and Schu-mann, U.: Prevalence of ice-supersaturated regions in the upper troposphere: Implications for optically thin ice cloud formation, J. Geophys. Res., 106, D15, 17 253–17 266, 2001.
IPCC, Climate change 2001: The scientific basis, Contribution of Working Group I to the Third Assessment Report of the IPCC (Intergovernmental Panel on Climate Change), Houghton, J. T., Ding, Y., Griggs, D. J., Noguer, M., Van der Linden, P. J., Dai, X., Maskell, K., and Johnson, C. A. (Eds), Chapter 6, Radia-tive forcing of climate change, p. 349–416, Cambridge Univer-sity Press, Cambridge, UK, 2001.
Luo, Z., Rossow, W. B., Inoue, T., and Stubenrauch, C. J.: Did the eruption of the Mt. Pinatubo volcano affect cirrus properties?, J. Climate, 17, 2806–2820, 2002.
Marquart, S. and Mayer, B.: Towards a reliable GCM estimation of contrail radiative forcing, Geophys. Res. Lett., 29, No. 8, 10.1029/2001GL014075, 2002.
Meerkoetter, R., Schumann, U., Doelling, D. R., Minnis, P., Naka-jima, T., and Tsushima, Y.: Radiative forcing by contrails, Ann. Geophysicae, 17, 1080–1094, 1999.
Meyer, R., Mannstein, H., Meerkoetter, R., Schumann, U., and Wendling, P.: Regional radiative forcing by line-shaped con-trails derived from satellite data, J. Geophys. Res, 107, D10, 10.1029/2001JD000426, 2002.
Minnis, P., Schumann, U., Doelling, D. R., Gierens, K. M., and Fahey, D. W.: Global distribution of contrail radiative forcing, Geophys. Res. Lett., 26, 1853–1856, 1999.
Minnis, P., Palikonda, R., Doelling, D. R., Schumann, U., and Gierens, K.: Changes in cirrus cloudiness and their relation-ship to contrails, Proceedings American Meteorological Society,
Boston, Mass, USA, paper no. 11.9, p. 239–242, 2001.
Minnis, P., Ayers, J. K., and Weaver, S. P.: Contrail Frequency Over the USA From Surface Observations, J. Climate, In press, 2003. Paciorek, C. J., Risbey, J. S., Ventura, V., and Rosen, R. D.: Mul-tiple indices of Northern Hemisphere cyclone activity, winters 1949–99, J. Climate, 15, 1573–1590, 2002.
Ponater, M., Marquart, S., and Sausen, R.: Contrails in a comprehensive global climate model: Parameterization and radiative forcing results, J. Geophys. Res., 107, D13, 10.1029/2001JD000429, 2002.
Rossow, W. B., Walker, A. W., Beuschel, D. E., and Roiter, M. D.: International Satellite Cloud Climatology Project (ISCCP) Documentation of New Cloud Datasets, WMO/TD 737, World Climate Research Programme, Geneva, Switzerland, 1996. Rossow, W. B. and Schiffer, R. A.: Advances in understanding
clouds from ISCCP, Bull. Amer. Meteor. Soc., 80, 2261–2287, 1999.
Sausen, R., Gierens, K., Ponater, M., and Schumann, U.: A diag-nostic study of the global distribution of contrails part I: present day climate, Theor, Appl. Climatol., 61, 127–141, 1998. Schmitt, A. and Brunner, B.: Emissions from aviation and their
development over time, In: Final Report on the BMBF Verbund-programm, Schadstoffe in der Luftfahrt, Schumann, U., Chlond, A., Ebel, A., K¨archer, B., Pak, H., Schlager, H., Schmitt, A., and Wendling, P. (Eds), DLR-Mitteilung 97-04, Deutsches Zentrum f¨ur Luft- und Raumfahrt, Oberpfaffenhofen and Cologne, Ger-many, 37–52, 1997.
Schumann, U.: On conditions for contrail formation from aircraft exhausts, Meteor. Z., 5, 4–23, 1996.
Schumann, U.: Introduction and Review of Previous Assessments: Questions and Previous Answers, in Aviation, Aerosols, Con-trails and Cirrus Clouds (A2C3), Seeheim, Germany, Schumann, U. and Amanatidis, G. T. (Eds), EUR 19428, European Commis-sion, Brussels, 21–26, 2000.
Schumann, U.: Contrail cirrus, in Lynch, D. K., Sassen, K., Starr, D. O’C., and Stephens, G., (Eds): Cirrus, Oxford Univ. Press, p. 231–255, 2002.
Stephens, G. L. and Webster, P. J.: Clouds and Climate: Sensitivity of Simple Systems, J. Atmos. Sci., 38, 235–247, 1981.
Stubenrauch, C. J., Rossow, W. B., Cheruy, F., Ch´edin, A., and Scott, N. A.: Clouds as seen by satellite sounders (3I) and im-agers (ISCCP), Part I. Evaluation of cloud parameters, J. Cli-mate, 12, 2189–2213, 1999.
Tselioudis, G. and Jakob, C.: Evaluation of midlatitude cloud prop-erties in a weather and climate model: Dependence on dynamic regime and spatial resolution, J. Geophys. Res., 107, D24, 4781, doi:10.1029/2002JD002259, 2002.
Wonnacot and Wonnacot: Statistics-Discovering its power, John Willey and Sons (Eds), New York, p. 204–209, 1982.
Wylie, D. P. and Menzel, W. P.: Eight Years of High Cloud Statistics Using HIRS, J. Climate, 12, 170–184, 1999.
Zerefos, C. S., Tourpali, K., and Bais, A. F.: Further studies on possible volcanic signal to the ozone layer, J. Geophys. Res., 99, 25 741–25 746, 1994.
Zerefos, C. S., Eleftheratos, K., Balis, D., Zanis, P., Meleti, C., and Tselioudis, G.: Effects of natural perturbations on cirrus clouds, EGS-AGU-EUG Joint Assembly, Nice, France, 6–11 April, 2003.