A DESCRIPTIVE PROFILE OF PHYSICAL EDUCATION
TEACHERS AND PROGRAMS IN ATLANTIC
CANADA
LYNN RANDALL University of New Brunswick
DANIEL BRUCE ROBINSON St. Francis Xavier University TIM FLETCHER Brock University
ABSTRACT. The purpose of this research was to investigate the extent to which quality physical education is currently being taught in Atlantic Canada. We used survey methods to generate descriptive data indicating: (a) the backgrounds of those who teach physi-cal education and (b) what is being taught in physiphysi-cal education. Our findings suggest physical education is taught by a group of mostly-white teachers with varying qualifica-tions, interests, and experiences in teaching the subject. Further, sport experiences tend to dominate the subject matter that students engage with, at the expense of dance and gymnastics. Although some physical education programs could arguably be classified as being of a sound quality according to the national subject association, we contend that more needs to be done to present the subject as a diverse enterprise, both in terms of who teaches and what is taught in physical education.
PROFIL DESCRIPTIF DES ENSEIGNANTS ET PROGRAMMES EN ÉDUCATION PHYSIQUE DANS LES PROVINCES MARITIMES AU CANADA
RÉSUMÉ. L’objectif de ce projet de recherche était d’explorer la qualité de l’enseignement prodigué en éducation physique dans les provinces maritimes au Canada. Pour ce faire, nous avons utilisé une méthodologie de sondage pour générer des données descriptives nous informant sur: (a) le profil des enseignants en éducation physique et (b) ce qui est enseigné en éducation physique. Nos résultats indiquent que l’éducation physique est enseignée par un groupe majoritairement formé de Blancs possédant une variété de qualifications, d’intérêts et d’expériences dans l’enseignement de la matière. De plus, le temps consacré par les élèves aux sports durant les cours prédomine, au détriment de la danse et de la gymnastique. Selon l’association nationale de l’enseignement en éducation physique, certains programmes en éducation physique peuvent sans doute être classés comme étant de qualité,. Cependant, nous soutenons que davantage peut être fait pour offrir une expérience en éducation physique diversifiée, à la fois en ce qui a trait au profil du corps enseignant, qu’à l’offre de contenu.
S
ince 2005, the annual Active Healthy Kids Canada (AHKC) report card has provided evidence-informed assessments of physical activity and physi-cal education opportunities afforded to children and youth in Canada. A striking feature of the reports has been the overwhelming and consistentlynegative evaluations of child and youth activity levels (in terms of moderate-to-vigorous physical activity). Assessments related to the quality of school-based physical education have been somewhat more positive, though they too have highlighted a less than ideal scenario. For example, in response to a slightly improved evaluation of physical education in 2012 (from a C− to a C), the AHKC (2012) report stated:
This grade reflects a slight improvement in the quantity and quality of PE; however, generally speaking, less than half of elementary and middle schools in Canada report that their students are getting at least 150 minutes of PE per week as recommended by Physical and Health Education Canada [PHE Canada]. (p. 37)
In addition to addressing broad issues that span the country, the report cards have also provided important provincial and regional information that highlights contextual differences related to physical activity and physical education opportunities and experiences. For example, the 2012 report card indicated that of the five provinces whose children and youth achieved below the national average of steps taken daily (11,607 steps), the four lowest were in Atlantic Canada. A similar pattern is evident with respect to school-based physical education, which the AHKC report evaluates primarily according to instructional time. All four Atlantic provinces have physical education instructional time guidelines / requirements calling for 75-100 minutes per week for lower elementary school students (grades K-3), roughly equivalent to 5-7% of total school instructional time (AHKC, 2011). These instructional time guidelines are the lowest in the entire country. In comparison, the four Western provinces and three territories call for approximately 150 minutes per week, which is roughly equivalent to 10% of total school instructional time (AHKC, 2011). If physical education is a vehicle that can provide children and youth with the skills, knowledge, and attitudes to lead healthy lifestyles, these trends (low number of daily steps taken and low PE time) are certainly cause for alarm. This is perhaps emphasized even more when the general health of Atlantic Canadians is compared to the rest of the country. According to the Heart and Stroke Foundation (2010) and Statistics Canada (2013a), rates for overweight / obesity, diabetes, cancer, stroke, and heart attacks within the four Atlantic provinces are well above the national average. Given these observations, we were interested in finding out what is occurring in physical education in schools in the Atlantic provinces.
Notwithstanding the potential of daily physical education to have a positive impact upon children and youth, it must be clearly stated and understood that the goals of school physical education should be seen as being far broader than providing a means to address the obesity “epidemic” or inactivity crisis, or curing the health ills of children and youth in Canada. We do, however, believe that physical education can contribute to students’ adoption of a healthy lifestyle, which can, in turn, impact upon their physical, social, and
emotional health well beyond graduation. As such, the potential positive impact that physical education can have on students’ future wellbeing is at least partially dependent upon a high level of quality existing in the physical education programs that are in place.
According to PHE Canada (2013), a quality physical education program is “well-planned, taught by qualified and enthusiastic professionals, and offers a variety of learning opportunities to all students on a daily basis throughout the entire school year” (para. 1). To this we would also add that a quality program provides students with opportunities to explore subject matter in some degree of depth, in a positive and supportive environment, and in ways that enhance students’ feelings of self-esteem. Despite the general agreement of the potential benefits of quality physical education programming, based on the findings of AHKC and other health agencies (e.g., Heart and Stroke Foundation, 2010; Statistics Canada, 2013a), we were concerned about the extent to which quality physical education programs were being provided to students in Atlantic Canada. At present, little research has examined physical education programs in the Atlantic region. Given the prevalence of obesity and inactivity levels in this part of the country and the recognition that qual-ity physical education programming can, at least, be used as a tool to educate children and youth about how to lead a healthy lifestyle, the purpose of our research was to understand the landscape of physical education in schools in Atlantic Canada.
RELEVANT RESEARCH
Although little research has been specifically conducted on the state and status of physical education in Atlantic Canadian schools, several pertinent examples do exist that have informed our thinking about current challenges facing teachers in the region. For example, after noting a 60% reduction in the number of physical education specialist teachers from 1992-1996 in Anglophone Schools in New Brunswick, Tremblay, Pella, and Taylor (1996) administered a survey to principals and all grade 1-3 teachers seeking informa-tion on physical educainforma-tion instrucinforma-tional time, content taught, and perceived barriers to program implementation. Teachers reported providing, on average, just under 60 minutes of physical education per week while principals believed teachers were delivering upwards of 75 minutes per week (Tremblay et al.). The study also found that the majority of the time was spent playing games and participating in fitness-related activities with less than 20% of the time devoted to teaching fundamental skills. Both teachers and principals reported insufficient training, lack of professional development possibilities, and limited to no access to expertise as barriers to implementing quality physical educa-tion. Although a valuable contribution to the literature, Tremblay et al.’s study was limited to Anglophone New Brunswick and focused on responses gathered from elementary principals and generalist teachers of grades 1-3
only. As such, we have little understanding of the experiences and situations of teachers beyond grade 3. In addition, we acknowledge that New Brunswick has experienced many shifts in policy, curriculum documents, and practice since 1996; this may impact upon the relevance of these findings in today’s educational climate.
In other parts of Canada, additional examples provide insight into the quality and quantity of physical education and serve as useful comparative cases. For example, Mandigo et al. (2004) surveyed a random selection of principals and teachers in Alberta. Of the 480 teacher questionnaires that were returned, approximately half of the participants classified themselves as physical educa-tion specialists. The majority of specialists further identified themselves as secondary teachers whereas the majority of non-specialists identified themselves as elementary teachers. A positive relationship was found between specialists teaching physical education and time devoted to physical education instruction. Specialist teachers also reported higher mean scores for feeling prepared to teach physical education, enjoyment with respect to teaching physical educa-tion, and confidence teaching physical education.
In Manitoba, Janzen et al. (2003) studied four elementary schools, finding that teachers in all four schools supported physical education, with teachers noting the positive effect participating in physical education classes had on their students’ in-class performance. Also, having a designated physical educa-tion specialist resulted in lessons that focused on learning basic movement skills and social and emotional development in a safe, inclusive, and equitable environment. Although classroom teachers were genuinely concerned about the quality of physical education classes they were delivering, they reported a lack of knowledge and time to prepare as two challenges to delivering quality lessons.
Outside of Canada, Hardman and Marshall (2000a, 2000b) and Marshall and Hardman (2000) have reported the results of an international survey of the state and status of physical education collected from 126 countries and autonomous provinces / states. Their data noted a trend toward more physi-cal education time allocated (in policy, yet not necessarily adhered to) in the lower grades with decreased amounts of time allocated in the higher grades (Hardman & Marshall, 2000a; Marshall & Hardman, 2000). Globally, it was common to have specialists at the secondary level and generalists at the el-ementary level. Canadian respondents indicated they were facing more severe funding cuts than those occurring in most other nations. Furthermore, 87% of Canadian respondents reported inadequate facilities and equipment; this was almost double the percentage reported globally (Hardman & Marshall, 2000b; Marshall & Hardman, 2000). With respect to the curriculum, the researchers noted that many countries, including Canada, were attempting to improve their physical education programs by focusing on movement and
health for all students as opposed to catering to elite level athletes (Hardman & Marshall, 2000b; Marshall & Hardman, 2000).
Despite the general sense of the state of physical education that these stud-ies provide, contextual differences in time and place render their ability to inform what is going on “here and now” in Atlantic Canada weak at best. The paucity of research related to the physical education programs that are delivered in Atlantic Canada means that little, if anything, is known about those responsible for teaching physical education and the daily challenges they face in order to provide a quality physical education experience for all students. Understanding these issues is important if the students of Atlantic Canada are to be provided with the tools to enable them to lead healthy active lifestyles throughout their childhood, adolescence, and beyond. As such, this research attempts to address this dearth of knowledge and to highlight find-ings that influence the quality of physical education programs in our region. The overall question guiding this research was: To what extent are teachers in Atlantic Canada teaching quality physical education programs? We sought to find out: (1) Who is teaching physical education in Atlantic Canada?; (2) What is being taught?
METHODS Study design
The primary purpose of this research was to collect descriptive data about the people who are teaching physical education in Atlantic Canada and the programs they are delivering to students. The research proposal was reviewed by all three of our institutions’ research ethics boards and found to be in compliance with the Tri-Council Policy Statement: Ethical Conduct for Research
Involving Humans. In an effort to generate a clear description of the state and
status of physical education in the region, we attempted to gather as much data from as many physical education teachers as possible. To do this, a cross-sectional survey design was employed (Creswell, 2009).
Survey design
An on-line survey was derived from an established survey developed by Man-digo et al. (2004). The purpose of the survey was to collect information that would allow us to broadly infer: (i) who is responsible for teaching physical education in schools in Atlantic Canada, (ii) the qualifications and experiences of teachers of physical education in Atlantic Canada, and (iii) the nature of physical education programs in Atlantic Canada. The survey contained three sections that asked participants to provide information about: (i) the school in which they were employed (e.g., student population, type of school [elementary, middle, secondary], location of school [rural, urban], and physical education timetable), (ii) their personal and professional background (e.g., age, gender,
degrees attained, years of teaching experience), and (iii) the physical educa-tion program they taught to students (e.g., facilities, activities taught, barriers and facilitators to program delivery). The question format varied, comprising open-ended and Likert-type items (Johnson & Christensen, 2012).
Following Jackson’s (1988) suggestions to maintain validity when utilizing a questionnaire-type survey, a number of practices were followed.The survey was reviewed and piloted (Johnson & Christensen, 2012; Merriam & Simpson, 2000) with three different groups of individuals. At each stage of the review and pilot process, participants were informed of the survey’s purposes and asked to keep this information in mind as they reviewed and / or completed the survey. First, the initial draft survey was sent to all four provincial physical education teachers’ association presidents and the representative responsible for physical education in First Nations schools in Atlantic Canada. Each individual carefully reviewed and provided feedback on the survey in general (e.g., relevance of questions, usefulness of collected data, missing questions) as well as on the wording of questions (e.g., clarity of questions, potential to garner intended information). From the initial feedback obtained from these representatives, six questions were modified to enhance clarity. Second, 14 pre-service physical education teachers pilot-tested the modified survey and were asked to consider the questions posed to the provincial representatives. As a result, approximately five additional questions were modified for clarity. Third, the modified survey was pilot-tested by a group of 18 in-service physical education teachers (who were also graduate students). All 18 of these physical education teachers agreed the survey questions were clear.
Data analysis
Because the purpose of our study was to provide a descriptive overview of the state and status of physical education in schools in Atlantic Canada, we relied primarily on descriptive statistics to analyze survey data. Specifically, basic descriptive statistics were calculated (e.g., frequencies, means, and standard deviations). Responses to open-ended questions consisted mainly of short answers or comments and, where appropriate, similar responses were tallied or the responses were grouped / categorized by common theme. These data were coded and categorized according to methods outlined by Creswell (2005) and Miles and Huberman (1994).
Participants
According to the presidents of the four provincial physical education teachers’ associations in Atlantic Canada, approximately 1000 teachers are responsible for teaching physical education in the four Atlantic provinces (i.e., New Brunswick ≈ 325,1 Newfoundland and Labrador ≈ 200, Nova Scotia ≈ 425,2 Prince Edward Island ≈ 75). Each provincial physical education association maintains both a website and a provincial listserv of members. Via their own
listservs, the presidents of each association sent an email inviting each recipient to participate in this research. Attached to the email was an invitation and informed consent letter to participate in the research, as well as a link to the on-line survey. Approximately three weeks after the initial invitation was sent, a follow-up reminder was sent. Three weeks after the follow-up reminder, one final reminder was sent again.
RESULTS
Physical education teachers
Personal and professional demographics. In total, 206 teachers (102 males; 80 females;
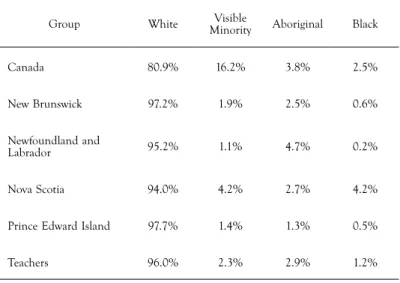
the remaining elected not to answer) logged into the survey and agreed to participate, representing approximately one fifth of the population of physical education teachers in Atlantic Canada who belong to their respective provincial associations. Of these, 79 (42% of participants) were from Nova Scotia, 73 (39%) were from New Brunswick, 20 (11%) were from Newfoundland and Labrador, and 15 (8%) were from Prince Edward Island. The 79 participants from Nova Scotia represented approximately 18.6% of the physical education teachers belonging to their provincial association, the 73 from New Brunswick represented 22.5% of their provincial association membership, the 20 from Newfoundland and Labrador represented 10% of theirs, and the 15 from Prince Edward Island represented 20% of theirs. As shown in Table 1,3 96% of the participants self-identified as White, 3% as Aboriginal, 1% each as Black,4 Filipino, and “other,” with 1% preferring not to answer.5 Also shown in Table 1 for comparative purposes are the ethnicity / visible minorities of the general population of Atlantic Canada.
TABLE 1. Ethnicity / visible minorities of Canadians, Atlantic Canadians, and teachers
Group White MinorityVisible Aboriginal Black
Canada 80.9% 16.2% 3.8% 2.5%
New Brunswick 97.2% 1.9% 2.5% 0.6%
Newfoundland and
Labrador 95.2% 1.1% 4.7% 0.2%
Nova Scotia 94.0% 4.2% 2.7% 4.2%
Prince Edward Island 97.7% 1.4% 1.3% 0.5%
With respect to the participants’ age, 28% were between 25-34 years of age, slightly over one third (34%) reported being between 35-44 years of age, and slightly under one third (31%) were between the ages of 45-54. Five percent of the participants were between 55-64 years, with 1% indicating they were between the ages of 18-24, and another 1% preferred not to answer.
The majority of participants (95%) indicated they worked in English provincial public schools, 3% worked in band-controlled schools, 2% worked in French provincial public schools, and 1% worked in private schools. Most participants (61%) worked in rural schools, with just over one third (37%) working in urban areas, and 2% working on-reserve. Just under half (48%) of the participants indicated they taught at the elementary level (grades kindergarten-5/6), 14% taught at the middle / junior high level (grades 5-9), and 18% indicated they taught at the high school level (grades 9/10-12).6 Twenty-one percent of the participants taught in consolidated schools (e.g., kindergarten-12, kindergarten-9, or 7-12).
Qualifications. The majority of the participants (>90%) reported they had earned at least one undergraduate university degree. Of these, 61% reported having both a Bachelor of Education (BEd) degree and an undergraduate degree in Physical Education, Human Kinetics, Kinesiology, or Sport Sciences, obtained either consecutively or concurrently. Twenty-seven percent reported having acquired only a BEd (without a prior degree in an area related to physical education or kinesiology), with the remaining 12% indicating “other.” Many of those who indicated “other” completed a single undergraduate physical education-related degree (e.g., Physical Education, Human Kinetics, Kinesiol-ogy, Sports Science, Outdoor Education) without completing a BEd, while some also graduated from non-degree granting Teachers’ College programs, completing, for example, a diploma or certificate program.
A little less than one third (26%) of the participants had completed a graduate degree. The most common graduate degree completed was a Master of Education (MEd; 19% of total participants), followed by a Master of Physical Education (MPE; 5%), and a Master of Arts (MA; 1%) or a Master of Science (MSc; 1%). Ten percent of the total participants were in the process of completing a graduate degree while 58% reported having completed no graduate education.
Teaching experience. The majority of the participants were relatively new to
teaching physical education, with 35% having 0-5 years of physical education teaching experience; of this group 6% of the participants stated they had been teaching physical education for less than one year with 29% stating they had been teaching physical education for 1-5 years. Just over one fifth (21%) of the participants had 6-10 years of experience teaching physical education, 14% had acquired between 11-15 years of physical education teaching experience, and 11% had between 16-20 years experience. Twenty percent indicated they had been teaching physical education for more than 20 years.
Responsibility for teaching physical education. The majority of the participants (63%) indicated that, at their school, only physical education specialists were responsible for teaching physical education. In one third of the schools (33%), participants stated physical education teaching duties were shared by classroom generalists and physical education specialists. Classroom generalist teachers were responsible for teaching all physical education classes in 4% of schools. While this statistic might, on the surface, come as a welcome surprise given the likelihood of elementary generalists teaching physical education across Canada, we treated the finding with caution as we could not determine whether all classroom generalists who teach physical education in Atlantic Canada received the invitation to complete the survey.
The gender make-up of the classes taught were primarily mixed (both females and males; 99%), with 5% of participants indicating they taught some female-only classes and 4% indicating they taught some male-female-only classes (the sum of the percentages is greater than 100% because some participants taught both single and mixed gender classes). Although the majority of the participants considered themselves physical education specialists, 52% indicated they taught other subjects outside of physical education.
Physical education programs
Physical education class length. The participants’ school schedules varied; most schools
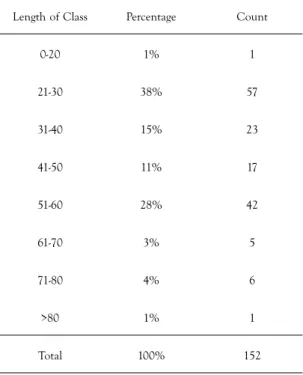
(53%) functioned on a 5-day (Monday to Friday) cycle, with 22% of participants indicating their school functioned on a 6-day cycle. Less than 6% of schools had cycles of 4 or fewer days and 20% had cycles of 7 or more days. Within these varied school cycles, the majority of students (62%) were receiving physical education between 3-5 times within their regular school cycle. Approximately 20% received more than 5 periods within their cycle and 18% received 1 or 2 periods within their cycle. When considered on a weekly basis (rather than school cycle basis), fewer than half (44%) of the participants’ students received physical education instruction at least 3 days each week. The amount of time within each class period varied from 20 minutes or fewer to greater than 80 minutes (see Table 2). As is shown in Table 2, the most common length of an individual physical education class was 21-30 minutes (38%).
Daily physical activity policies. Eighteen percent of the participants indicated that
their schools had a Daily Physical Activity (DPA) policy. When invited to provide additional information about their schools’ DPA policies, some participants shared that they were uncertain about the existence of such a policy (e.g., “We might [have a DPA policy], but I am unaware of this.”), others shared that space limitations prevented DPA from being a possibility (e.g., “due to a lack of gym space because we have multiple classes sharing the gym it is hard to adhere to the DPA policy.”), and others shared that their schools simply did not institute the policy as expected (e.g., “the policy is board wide but is not adhered to and not policed”).
TABLE 2. Length of a typical physical education class (in minutes) Length of Class Percentage Count
0-20 1% 1 21-30 38% 57 31-40 15% 23 41-50 11% 17 51-60 28% 42 61-70 3% 5 71-80 4% 6 >80 1% 1 Total 100% 152
Facilities. Participants were asked how often they accessed alternative facilities
(i.e., those other than the school gymnasium or school site athletic fields) for physical education classes. Reponses indicated that teachers made regular or occasional use of playgrounds (58%), parks (42%), and arenas (39%), and rarely, if ever, used climbing facilities, community centres, off-site fitness facilities, curling facilities, tennis courts, and swimming pools. Facilities that were not listed on the survey but were recognized as being occasionally used by participants included local walking trails, bowling alleys, golf facilities, ski facilities (both cross country and downhill), and billiard halls. Participants’ written responses indicated that cost was often a limiting factor in accessing these sorts of alternative facilities.
Physical education content. Physical education content can be arranged and grouped
in various ways. In an attempt to begin to understand what type of content was being taught and the amount of time physical education teachers were spending teaching various content, the movement domains that were used in the survey were those that are characteristic of curricula in Atlantic Canada. Accordingly, they were categorized as follows:
• Active Living / Fitness / Individual & Dual Activities (e.g., cycling, yoga, weight training, etc.);
• Dance (e.g., partner, contemporary, creative, etc.);
• Sport Experience / Games / Court & Field Activities (e.g., territory games, basketball, badminton, etc.);
• Gymnastics (e.g., educational gymnastics, pyramid building, stuntnastics, etc.), and;
• Outdoor Activities / Alternative Environments / Leadership (e.g., camp-ing, orienteercamp-ing, skicamp-ing, etc.).
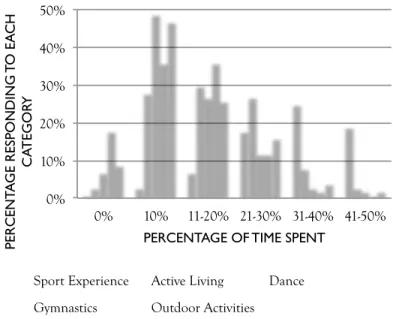
Eighty-five percent of participants indicated they spent up to a third of their program time teaching active living skills (see Figure 1). Seven percent of the participants indicated they never taught dance and 56% indicated they spent no more than 10% of their time teaching dance. Sport experience represented the content area that participants seemed to be willing to spend the most time teaching, with 77% spending more than a third of their time teaching content related to sport / game experiences. Eighty-four percent of participants indicated they spent less than one fifth of their time teaching gymnastics-related content. Of these participants, 18% indicated they never taught gymnastics content and 54% indicated they spent no more than 10% of their time teaching gymnastics. Seventy-three percent of participants indicated they spent up to a third of their teaching time on outdoor activities with the majority of these (83%) indicating they spent up to one third of their program time in this area.
0% 10% 20% 30% 40% 50% 0% 10% 11-20% 21-30% 31-40% 41-50% PERCENT A GE RESPONDING TO EA CH C ATEGOR Y
PERCENTAGE OF TIME SPENT
Sport Experience Active Living Dance
Gymnastics Outdoor Activities
FIGURE 1. Percentage responding to each category vs. percentage of instructional time spent teaching each movement domain
In an attempt to gain a better understanding of what type of content was being taught within each of the movement domains discussed above, the participants were asked to indicate the “specific movement activities” they most often taught in each of the five categories (Active Living, Dance, Sport Experience, Gymnastics, Outdoor Activities). Of the 124 written responses provided for active living, the word “fitness” appeared 59 times, both independently and when describing certain fitness activities such as fitness testing, fitness classes, fun fitness circuits, and fitness units. In all but two of the remaining 65 re-sponses where the term fitness was not specifically used, participants listed activities that are often used to improve or address fitness, such as running / jogging, weight training, yoga, plyometrics,7 strength and endurance training, and Zumba.8 “Nil” and listing several sports (basketball, volleyball, badminton, etc.) were the two remaining responses.
With respect to dance, of the 116 written responses provided, creative dance was mentioned most often (32 times), followed by line and folk dance (men-tioned 17 times each). Several participants indicated they taught hip-hop (8), square dance (7), and Zumba (6). Five participants specifically mentioned the use of technology-mediated dances, for example using the Wii or Dance Dance
Revolution. Other answers were more general. For example, social, contemporary,
traditional, and novelty dances were mentioned a few times without specific examples. Examples of other responses included in this category were partner movement, self-directed, variety, pow-wow, freestyle, and belly dance. In the sport experience category, the overwhelming majority of the 124 writ-ten responses identified traditional team sports and games (e.g., basketball, volleyball, soccer, hockey, badminton, track and field, team handball, and tennis). One participant indicated that these activities were taught as “Athletic Calendar Sports,” that is, with a particular sport being taught in conjunction with the season in which that sport is typically played. Nine participants provided responses related to games classifications such as invasion games, territory games, and court and field activities without providing examples of games specific to each category. Some examples of other responses included cooperative games that integrate specific sport skills, dodge ball games, table tennis, lead-up games, tchoukball9, non-traditional sports, and cooperation / eye hand coordination activities.
For the fourth category, gymnastics, participants provided 111 written responses. A few participants responded that they specifically taught “educational gym-nastics” while others listed different content. The most common responses included rolling / tumbling, balances / stunts, pyramid building, creating sequences, rotations, and jumping and landing. A few participants indicated they did bench or vault work.
In response to the specific movement activities most often taught in the out-door activities category, participants provided 118 written responses. The two
most common responses were snowshoeing (43 responses) and orienteering (42 responses). Several people (23) indicated that hiking was a part of their outdoor program and 17 indicated they taught cross country skiing to their students. Six participants indicated they took their students winter camping. Other outdoor activities mentioned included skating, canoeing, curling, and sliding, while some participants used a “looser” interpretation of outdoor activities, identifying seemingly anything that could be undertaken outdoors, such as archery, frisbee, golf, playground games, tennis, swimming, and winter carnival activities.
Preparation to teach physical education. Participants were asked to share their level
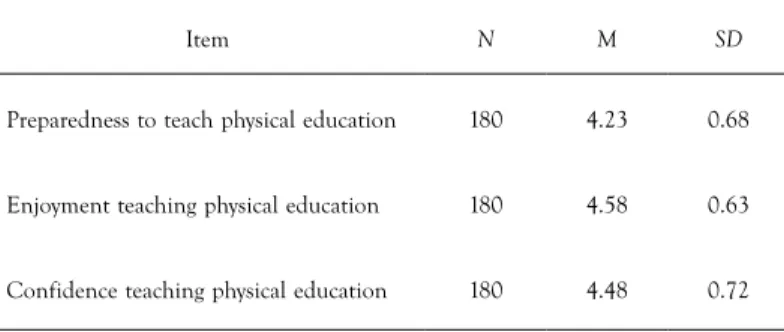
of preparedness, enjoyment, and confidence in teaching physical education (see Table 3). On a scale of 1-5 where 1 is low and 5 is high, participants showed a high level of preparedness (M = 4.23, SD = .68), enjoyment (M = 4.58, SD = .63), and confidence (M = 4.48, SD = .72) for teaching physical education. Indeed, this might be expected when considering that the majority of participants had completed BEd, BPE, or BPE/BEd degrees.
TABLE 3. Mean and standard deviation for teachers’ levels of preparedness, enjoyment, and confidence
Item N M SD
Preparedness to teach physical education 180 4.23 0.68 Enjoyment teaching physical education 180 4.58 0.63 Confidence teaching physical education 180 4.48 0.72
NOTE. Measured on a Likert scale (1 = low, 5 = high).
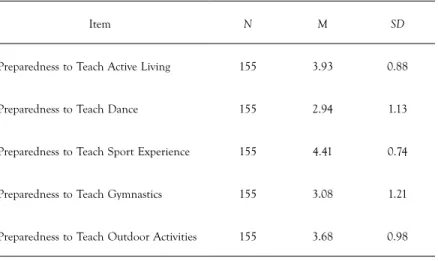
However, when asked to consider their levels of preparedness, enjoyment, and confidence to teach the different movement domains within physical educa-tion, their responses revealed sometimes markedly different perceptions (see Table 4). For example, with respect to feelings of preparedness to teach in each of the movement domains, participants indicated they felt least prepared to teach dance and gymnastics. More specifically, 37% of participants reported that their level of preparedness to teach dance was low or minimal (M = 2.94,
SD = 1.13) while 31% felt a similar level of preparedness to teach gymnastics
(M = 3.08, SD = 1.21). Alternatively, participants indicated a much higher level of preparedness to teach sport experience and active living. For example, 91% of participants reported their level of preparedness to teach sport experience as very good or high (M = 4.41, SD = 0.74) and 69% felt that way about
ac-tive living (M = 3.93, SD = .88). Similar results were found when asked about their level of enjoyment and level of confidence in teaching each movement domain. Although the numbers changed slightly, the comparative results did not, with participants indicating they least enjoyed and felt less confident teaching dance and gymnastics, and enjoyed and felt more confident teaching sport experience and active living.
TABLE 4. Mean and standard deviation for teachers’ level of preparedness by movement domain
Item N M SD
Preparedness to Teach Active Living 155 3.93 0.88
Preparedness to Teach Dance 155 2.94 1.13
Preparedness to Teach Sport Experience 155 4.41 0.74 Preparedness to Teach Gymnastics 155 3.08 1.21 Preparedness to Teach Outdoor Activities 155 3.68 0.98 NOTE. Measured on a Likert scale (1 = low, 5 = high)
Assessment and evaluation of physical education outcomes. Outcomes for physical education are often written in four different domains: psychomotor, cogni-tive, affeccogni-tive, and fitness-related. Participants were asked the approximate relative value they attributed to each domain (with respect to assessment and evaluation). The majority of participants indicated they attributed up to 30% of their students’ grade to fitness-related (78% of participants) and cognitive (81% of participants) outcomes. Psychomotor outcomes comprised up to 30% of students’ grade for 58% of the participants while affective outcomes were worth up to 30% of students’ grades for 45% of the participants. Whereas few participants were willing to assign up to 60% of a student’s grade to fitness-related outcomes and cognitive outcomes (6% and 8% respectively), 29% of participants indicated that motor outcomes comprised up to 60% of students’ grades, with 40% of the participants also indicating that affective outcomes were worth up to 60% of students’ grades.
DISCUSSION
The data gathered from this research present a number of issues necessitating further discussion. Indeed, with a clearer understanding of who is responsible for
teaching physical education in Atlantic Canada and the nature of the physical education programs they are teaching, one is certainly more able (and for us more dutifully bound), to engage in meaningful dialogue about the directions we are taking and perhaps those that we should be taking. The purpose of our study was to consider the extent to which quality physical education programs are being taught in Atlantic Canada. To do this, we discuss our findings in two main sections, addressing respectively: (1) Who is teaching physical educa-tion in Atlantic Canada?, and (2) What is being taught? Upon consideraeduca-tion of the results, issues related to who is teaching physical education in Atlantic Canada most obviously require closer attention be paid to the implications of the “whiteness” of the field, the levels of pre-service and in-service university education, and teachers’ preparedness, enjoyment, and confidence to teach within various movement domains. Issues and implications related to Atlantic Canadian physical education programs requiring further discussion include games / sport-focused curriculum and DPA / physical education programs. Who is teaching physical education in Atlantic Canada?
(The absence of) ethnicity and visible minorities.Data collected about teachers’ ethnicity or status as a visible minority might seem to be especially conspicuous to those from other areas of Canada, particularly those who live in major urban centres. Across the country, 16.2% of people are from a visible minority group, 3.8% identify as Aboriginal, 2.5% identify as Black, and 80.9% identity as White (Statistics Canada, 2013b, 2013c). However, the population of the Atlantic provinces is clearly not as ethnically diverse as other parts of the country. For example, Newfoundland and Labrador has a visible minority population of 1.1%, Prince Edward Island has an Aboriginal population of 1.3%, and New Brunswick has a Black population of 0.6% (Statistics Canada, 2006b, 2006c). Collectively then, the percentage of teacher participants who identified as part of a visible minority group, Aboriginal, or Black roughly reflects the actual population of the Atlantic Canadian region. Moreover, the percentage of physical education teachers who belong to a visible minority group exceeds the population in three Atlantic provinces (yet falls below that of Nova Scotia), the percentage of teachers who are Aboriginal exceeds the population in three Atlantic provinces (falling below only that of Newfoundland and Labrador), and the percentage of teachers who are Black exceeds the population in three Atlantic provinces (falling only below that of Nova Scotia).
Lest one be entirely satisfied with this state of affairs, it is important to further qualify the general population’s background as it compares to that of Atlantic Canada’s physical education teachers. Statistics Canada’s (2013b, 2013c) most recent census data is from 2006. There is a clear trend across Canada for increased proportional populations of both visible minorities and Aboriginal people (Friesen, 2010). In fact, by 2031, Statistics Canada predicts that one third of all Canadians will belong to a visible minority. From this,
one might appropriately infer two things. First, with time (including the time period from 2006-2013), the percentage of visible minorities and Aboriginal groups has grown (and will continue to do so). Second, given that the visible minority and Aboriginal populations will grow most notably in the youngest demographics, schools (now do and will continue to) have greater percentages of these groups than the general (and older) population.
Given that we would wholeheartedly support the notion that having a teaching profession representative of the student population is ideal, we suggest that some sort of immediate initiative to attract members of visible minority populations into the physical education teaching profession is of paramount importance. On this point, we are not alone. As described by Melnychuk, Robinson, Lu, Chorney, and Randall (2011), we are very much aware of the struggles beginning physical education teachers encounter as they teach students unlike themselves. We are further aware of the need for teachers of Aboriginal students to develop a white race consciousness, whereby colour blind discourses are necessarily replaced by colour conscious ones (Halas, 2006; Halas, McCrae, & Carpenter, 2013; Robinson, Lunney Borden, & Robinson, 2013). Additionally, teachers of Black students must endeavor to offer culturally relevant instruction (Flory & McCaughtry, 2011; McCaughtry, Barnard, Martin, Shen, & Kulinna, 2006). While educating pre-service and in-service teachers to do this is one strategy, attracting Aboriginal and Black teachers to the profession is another. Atlantic universities might then consider the introduction of programs meant to attract both Aboriginal and Black students. Currently, St. Francis Xavier University has an African Nova Scotian cohort of pre-service teachers and Memorial University of Newfoundland, the University of New Brunswick, and Mount St. Vincent University have Aboriginal Community-Based Teacher Education programs for Aboriginal students. Programs like these ought to be considered at multiple universities in all four Atlantic provinces, perhaps with particular focus to attracting people to teach physical education.
Level of physical education teacher education. Physical Education Teacher Education (PETE) generally refers to pre-service physical education teacher education. In addition, many teachers also engage themselves in in-service teacher education programs. These might include post-graduate teaching certificates or advanced graduate degrees such as a MEd, MPE, MA, or MSc.
The participants in this research indicated a considerable degree of difference in their undergraduate PETE programs. Perhaps most notably, 12% of the par-ticipants did not have a BEd degree. Furthermore, while 61% of the teachers held a BEd and a separate degree related to physical education, human kinetics, or kinesiology, some seemingly had little-to-no physical education training. For example, one participant explained that her / his undergraduate education consisted of a Bachelor of Theology (BTh) followed by a BEd while another explained that her / his undergraduate education consisted of a Bachelor of
Adult Education (BAEd). Additionally, some of the participants had never completed a university degree in any discipline (but rather attended a now-nonexistent college program). When patterns across Canada and around the rest of the world suggest that elementary physical education classes tend to be taught by classroom generalists rather than specialists (Hardman & Marshall, 2000a), these abnormalities are more easily explained. As we noted earlier, our data may under-represent those generalist teachers who are responsible for teaching physical education in Atlantic Canada because they may not be members of their provincial physical education teaching association. As such, the difference in the extent and quality of PETE for teachers in the four prov-inces may be even more pronounced if generalist teachers’ backgrounds and qualification are considered. With evidence suggesting that most generalists recall poor or negative experiences of their own school-based physical educa-tion programs and PETE experiences are significant predictors of the quality of physical education programs generalists deliver to students (Morgan & Hansen, 2008), specifically directing research efforts toward elementary gen-eralists who teach physical education in the Atlantic region is one area where future research is warranted.
Without national standards for physical education teacher certification and with ever-changing provincial requirements, it is near impossible to label (and require) a minimum standard for physical education teachers’ training pro-grams — whether for specialists or generalists. Granted, today each province has guidelines for teacher certification (though not necessarily for physical education teacher certification); however, many physical education teachers who completed their teacher education programs in the past have been spared as certification changes have been “grandfathered in.” Without the possibility of national standards (and the shifting provincial requirements for certification), one feasible option is for the four Atlantic provinces (i.e., their provincial ministries and their universities’ PETE programs) to attend to the Canadian Council of University Physical Education and Kinesiology Administrators’ (CCUPEKA) Accreditation Council accreditation standards. CCUPEKA-accredited physical education programs meet a number of important standards related to program structure (with respect to breadth and depth of program). Furthermore, these accredited institutions include a number of required core content courses, core activities, core pedagogy courses, and minimum number of weeks of practice teaching. Currently, within Atlantic Canada, only three universities offer CCUPEKA-accredited programs (CCUPEKA, 2013). These three universities are St. Francis Xavier University in Nova Scotia, Université de Moncton in New Brunswick, and Memorial University of Newfoundland in Newfoundland and Labrador. Requiring physical education teachers to complete their pre-service education at CCUPEKA-accredited institutions (or institutions with equivalent requirements), though difficult to institute, would ensure a common (and standardized) level of preparedness. We do realize,
however, that this may impact upon academic freedom and the abilities of pre-service teacher educators to contour programs to shifting emphases and contextual requirements based on the needs of the K-12 student populations they serve and so we offer this as an idea for consideration rather than as a proposed solution.
There is limited research data related to the post-graduate education of teachers in Canada. Notwithstanding this limitation, Smaller, Clark, Hart, Livingstone, and Noormohamed (2000) administered a Canadian Teachers’ Federation sur-vey with the goal of gaining an understanding of Canadian teachers’ informal and formal learning opportunities. Smaller et al.’s research revealed that 27% of teachers were, at the time, actively enrolled in university courses. Also, 2006 Census of Canada results indicated that 10.6% of Canadian elementary teachers had a master’s degree (or doctoral degree) while 16.0% of Canadian secondary teachers similarly had this level of post-graduate education (Statistics Canada, 2013d). Given that 26% of the participant teachers held a graduate degree, Atlantic Canada is in a position to boast in this regard. However, while we might celebrate the number of Atlantic Canadian teachers with graduate degrees, it is not possible to suggest that this advanced education has an im-pact on teaching and learning. That is to say that although these figures are promising, future research might investigate physical education teachers’ teach-ing, and their students’ learnteach-ing, after the completion of a graduate degree. Indeed, based on the prevalence of “traditional” multi-activity programs that are evident from the data we analyzed, we were somewhat surprised at the absence of open-ended responses that made reference to innovative programs based on, for example, models-based practice (Metzler, 2011).
Preparedness, enjoyment, and confidence.Mandigo et al.’s (2004) descriptive profile of Alberta’s physical education teachers compared specialists’ and generalists’ preparedness, enjoyment, and confidence related to teaching physical education. Compared to this previous literature, Atlantic Canadian physical education teachers self-reported being more confident teaching physical education than both Alberta specialists and generalists (i.e., M = 4.48 compared to M = 3.61 for Alberta specialists and M = 2.28 for Alberta generalists). In addition to seeking this information, we also sought to extend this data by determining physical education teachers’ preparedness, enjoyment, and confidence related to teaching within the five previously identified movement domains. Although the participants shared that they were largely confident and prepared physical education teachers who enjoyed teaching, they had very different perspectives when the different movement domains were compared. Feeling most prepared and confident to teach sport experience (and least prepared and confident to teach dance, gymnastics, and outdoor activities), these teachers evidently fit the profile of those who have traditionally pursued such a career — namely those with positive childhood and youth experiences within sports and
sport-dominated physical education programs. This idea is not new; Lawson’s (1983) initial identification of the occupational socialization of new recruits continues to be recognizable and applicable today. More specifically, the “institutional combination of the teacher-coach” (Lawson, 1988, p. 274) contributes greatly to the continued dominance of sports within physical education.
This continued attention to sport-related areas in PETE needs to be addressed. To us, three options for addressing this are possible. First, those engaged in the recruitment and admission of physical education pre-service teachers to Atlantic Canadian universities might purposely target select populations of potential students into their teacher education programs, in particular those with a history of experience and / or expertise in dance, gymnastics, and / or outdoor activities. Curtner-Smith (1999) has alluded to this same point, suggesting that one way to combat the reality that current PETE recruitment processes attract those who revere the present system is to recruit and select pre-service teachers whose life histories are more compatible with present curricular goals and pedagogies. The second possibility would be to focus upon dance, gymnastics, and outdoor activities (perhaps, in some respects, at the expense of sport experience) within physical education teacher education programs. Such a focus would necessarily include the inclusion of activities / skills courses as well as pedagogy-related courses focusing on these movement domains. While this research did not investigate teachers’ perspectives related to their teacher training programs and these movement domains, others have found their training in dance and gymnastics to be inferior to their training in games, sports, and active lifestyle (Morgan & Hansen, 2008). Third is to tackle the teacher-coach conflict head on. During the hiring process, prior-ity and full consideration must be given to the educational background and teaching ability of the candidate, and her/his ability to deliver a balanced physical education program, rather than upon the candidate’s prior athletic experiences or coaching ability. We would suggest that hiring coaches first mainly occurs for sports that dominate secondary schools’ varsity programs (e.g., football, soccer, basketball, volleyball). Noting that teachers often teach content they are most familiar and comfortable with, when teachers are hired because of their experience and expertise coaching these sorts of traditional sports within athletics programs, it further contributes to the dominance of traditional sports within physical education programs.
What is being taught in Atlantic Canadian physical education?
Games / Sport-focused curriculum. Closely related to these physical education teachers’ preparedness, enjoyment, and confidence teaching various movement domains within physical education is the amount of instructional time afforded to these same domains in their programs. That is, while the participating teachers shared the highest levels of preparedness, enjoyment, and confidence for teaching sport experience and active living, these two domains also took
up a greater percentage of instructional time. Conversely, the two movement domains for which teachers reported feeling the lowest levels of prepared-ness, enjoyment, and confidence (i.e., dance and gymnastics) also took up the lowest percentage of instructional time. This relationship supports claims by Curtner-Smith (1999) and Lawson (1983) that physical education teachers teach those activities they feel most prepared to teach, those they enjoy teaching the most, and those they feel most confident teaching (irrespective of the bal-ance mandated by provincial curriculum documents). It may also suggest that teachers are unlikely to disrupt their practice by delving into content areas or pedagogical practices that they are uncomfortable with or that are innovative. It is also worth reiterating here that 35% of the participants had 0-5 years of teaching experience and, collectively, 56% of the participants had no more than 10 years of teaching experience. That is, to some it may be curious that relatively young neophyte teachers, who might be considered to be especially innovative, would not be more inclined to abandon questionable practices in favour of more progressive models-based practices. Alternatively, some might also find this observation to make perfect sense, attributing it to occupational socialization (Lawson, 1983;1988) and the nature of beginning teachers’ concerns with other classroom issues, related to, for example, discipline and control of students (Cherubini, 2009). While we cannot make either claim here, we recognize this is a phenomenon worthy of further inquiry.
In addition to teachers’ continued focus on sport experience, it was also revealed that many teachers continued to teach traditional “staple” activities within this movement domain. Teachers’ continued focus on these traditional sports seemingly ignores the physical recreation activities of high school graduates. That is, although these teachers’ physical education programs focus on sport experience (and predominately upon traditional sports within sport experience), none of the top ten popular choices of physical recreation activities for high school graduates can be categorized as traditional team sports (Canadian Fit-ness and Lifestyle Research Institute, 1998). We would therefore suggest that physical education programs, particularly at the secondary level, might better serve students by offering more balanced approaches to offering content (as required by provincial ministries and explicitly outlined in curriculum docu-ments). Such a balance might enable physical education programs to focus more upon those activities most popular to, and taken up most often by, high school graduates (e.g., social dance, home exercise, bicycling, swimming, jogging, weight training, and skating). Though there is obviously still a tremendous focus upon sports within these teachers’ physical education programs, we view the fact that 85% of participants indicated they spent up to a third of their program time teaching active living skills as a positive step in the right direction in this regard.
Given that our suggestion might be also viewed as a call for teachers to teach what they are actually supposed to teach, it is not lost upon us that some sort
of accountability measure might also address this issue. If physical education teachers are required to offer movement domain-balanced programs, school administrators might take it upon themselves to ensure that their physical education teachers are indeed teaching the mandated curriculum. While we can appreciate that such a task may seem like an extraordinary one, or one that positions school administrators as micro managers, we also know that such oversight of school happenings by school administrators is actually a duty detailed in all four Atlantic provinces’ educational legislation.
DPA / Physical education programs. Three Canadian provinces currently have government-mandated DPA policies requiring all students to engage in 20 or 30 minutes of daily physical activity (British Columbia, Alberta, Ontario). Though none of the four Atlantic provinces currently have such a mandated DPA policy, some individual schools or school jurisdictions have instituted similar policies. That is, 18% of the physical education teachers indicated that their school had a DPA policy; some of these shared that their schools did not institute it as it was planned or required.
It is noteworthy that while the Atlantic provinces have the least amount of instructional time in physical education and some of the lowest indicators of health and wellness, they also do not have government-mandated DPA. It one sense, it would seem that if there were any region in Canada that ought to have DPA programs, it would be the Atlantic region. However, we are very much aware of DPA’s limitations, including the heterogeneity of interven-tions, reluctant implementation by teachers, and the “quick fix” nature of DPA programs informed by obesity discourses (Hickson, Robinson, Berg, & Hall, 2012; Ramanathan, Allison, Faulkner, & Dwyer, 2008; Robinson & Melnychuk, 2008; Sykes, 2011). Indeed, some of these limitations were high-lighted by our own research participants. It is for this reason that we would support the adoption of DPA policies in Atlantic provinces as initiatives that are a “last resort.” That is, while we can appreciate that DPA has the potential to get students more physically active (and, again, that is not an altogether straightforward result), the role of physical education is not to serve as a type of weight loss clinic; it is an important site for students’ physical, cognitive, and affective growth and development and so our obvious preference would be for students to become more “physically literate.”
It is disconcerting and embarrassing that Atlantic Canada has the lowest standards related to instructional time in physical education. Our students are the least active in the country. Certainly, they deserve better than to have the least amount of time for physical education instructional time. Though the provincial ministries could address this inequity by way of mandating higher minimum instructional time guidelines (e.g., 150 minutes per week), school jurisdictions, school administrators, or teachers also play a role. That is, the guidelines that exist are minimum standards; there is nothing stopping school
jurisdictions, school administrators, or teachers from offering more instructional time for physical education. However, given that the present scenario has not resulted in many schools offering more than what is suggested (and has, in fact, resulted in many offering less than what is suggested) and that teachers are in many cases powerless to effect this sort of change (i.e., teachers are most often given their schedules), the provinces have the greatest opportunity to make this sort of change possible. Therefore, we would hope that this research highlights the need for Atlantic Canadian education ministries to take some action in this regard. It is no understatement to suggest that it is these minis-tries who have the greatest power, and responsibility, to effect such a change. Moreover, mandating such minimum instructional time guidelines is, to us, a minimum expectation. Our continued hope would be for the implementation of daily physical education.
Strengths and limitations
The on-line nature of the survey was one of the strengths of this research. Participants were able to complete the survey at a time and place that was convenient to them. Also, the on-line nature of the survey ensured teachers did not feel pressured to complete the survey. At the same time, this may have attracted a certain type of teacher to complete the survey. Thus it is possible that the participants who completed this survey are not representative of all Atlantic Canada physical education teachers.
As with all survey research, the research is limited by the type of questions asked and how the participants interpreted the questions. Although the survey was pilot-tested three times, it is possible that a participant could have misun-derstood a question and answered it incorrectly. Also, provincial listservs were used to identify participants. It is possible that the listservs included people who were not teaching physical education and/or excluded some people who were teaching physical education.
CONCLUSION
Our research addresses a gap noted in a recent annual AHKC (2012) report card which noted, “classroom-level surveillance data are needed on the content of PE classes (e.g., frequency and duration of physical activity)” (p. 37). Our findings suggest physical education is taught by a group of mostly white teachers with varying qualifications, interests, and experiences in teaching the subject. Further, sport experiences tend to dominate the subject matter that students engage with, at the expense of domains such as dance and gymnastics. Although many physical education programs could arguably be classified as being of a sound quality according to the national subject association, it is our contention that more needs to be done to present the subject as a diverse enterprise, both in terms of who teaches and what is taught in physical education.
In a recent editorial to a special issue of the Sport, Education and Society journal, O’Sullivan (2013) commented that, “we have seen a shift from what might be traditionally viewed as a ‘multi-activity’ approach to physical education to the design of national and local curriculum that reflect one or more instructional and/or curricular models” (p. 1). O’Sullivan’s observed shift towards this models-based practice within physical education has not been revealed by our own data. That is, the continued overwhelming emphasis upon traditional games play, the limited length of units of instruction, the limited weekly physical education instructional time, and the near complete-absence of refer-ences to alternative curriculum models suggest that programs being offered to students in Atlantic Canada have not changed much in this regard and, rather, resemble the programs Lawson (1988) described decades ago. Notwithstand-ing this observation, we are entirely aware that our research processes did not actually include a systematic effort to elicit information about models-based practice (i.e., no questions made explicit mention of various instructional models). Moreover, it would have been possible for teachers to actually utilize instructional models while also failing students with respect to some of these same issues. Nonetheless, we harbour a concern because previous research has found that such programs have been cited as lacking meaning for students, having little if any impact on students’ intentions to engage in an active lifestyle, and, at worst, serve as sites for humiliation or abuse for students who do not embody “athletic” identities (Ennis, 1996). Additionally, the continuation of multi-activity, sport-based programs is demonstrative of Kirk’s (2010) “more of the same” scenario. To this end, Kirk has suggested that while this may be sustainable in the short term, without radical reform, the long-term future of physical education is at risk of extinction. Moreover, students risk missing out on a potentially crucial part of their education when their programs are not addressing their needs. Further studies that address contextually specific issues and concerns may begin to identify further areas toward which change efforts may be focused.
The research has important implications for pedagogues working in physical education as it can provide direction for program / course modification at both the school and university level; it can provide valuable information for policy makers, educational administrators, and curriculum designers; and it has prompted further research questions aimed at continuing to try to improve the quality of physical education experienced by students within Canada. NOTES
1. Excluding New Brunswick’s Francophone teachers. 2. Excluding Nova Scotia’s Francophone teachers.
3. The categories listed in Table 1 are those used by Statistics Canada. Each category is a separate/ independent entity. That is, visible minority does not include Aboriginal or Black.
4. These terms were chosen so as to replicate the terminology used by Statistics Canada. The authors recognize that “African Canadian” or “African American” is often used instead of “Black.”
5. These total greater than 100% because participants were able to indicate more than one ethnic or visible minority group.
6. The distinctions between elementary, middle level, and high school differ amongst the prov-inces, hence the overlapping of grades in the data.
7. Plyometrics are exercises designed to improve dynamic strength and power.
8. Zumba is a type of fitness class (similar to aerobics) based largely on dance elements and music from Latin America.
9. Tchoukball is an invasion game where teams attempt to score points by shooting a ball at a trampoline like frame in such a way that it rebounds off the frame and back into the field of play before defending players are able to catch the ball.
REFERENCES
Active Healthy Kids Canada. (2011). Don’t let this be the most physical activity our kids get after school. The Active Healthy Kids Canada 2011 report card on physical activity for children and youth. Toronto, ON: Author.
Active Healthy Kids Canada. (2012). Is active play extinct? The Active Healthy Kids Canada 2012 report card on physical activity for children and youth. Toronto, ON: Author.
Canadian Council of University Physical Education & Kinesiology Administrators. (2013). Physical education institutions. Retrieved from http://www.ccupeka.ca/en/index.php/accreditation/19-institutions-and-procedures/12-physical-education-institutions
Canadian Fitness and Lifestyle Research Institute. (1998). Popular physical activities. Progress in Prevention, Bulletin no. 32.
Cherubini, L. (2009). Reconciling the tensions of new teachers’ socialization into school culture: A review of the research. Issues in Educational Research, 19(2), 83-99.
Creswell, J. W. (2005). Educational research: Planning, conducting, and evaluating quantitative and qualita-tive research (2nd ed.). Upper Saddle River, NJ: Pearson.
Creswell, J. W. (2009). Research design: Qualitative, quantitative, and mixed methods approaches (3rd ed.). Thousand Oaks, CA: Sage.
Curtner-Smith, M. D. (1999). The more things change the more they stay the same: Factors in-fluencing teachers’ interpretations and delivery of national curriculum physical education. Sport, Education and Society, 4(1), 75-97.
Ennis, C. D. (1996). Students’ experiences in sport-based physical education: [More than] apologies are necessary. Quest, 48(4), 453-456.
Flory, S. B., & McCaughtry, N. (2011). Culturally relevant physical education in urban schools: Reflecting cultural knowledge. Research Quarterly for Exercise and Sport, 82(1), 49-60.
Friesen, J. (2010, March 9). The changing face of Canada: Booming minority populations by 2031. The Globe and Mail. Retrieved from http://www.theglobeandmail.com/news/national/the-changing-face-of-canada-booming-minority-populations-by-2031/article569072/
Halas, J. (2006). Developing a white race-consciousness: A foundation for culturally relevant physical education for Aboriginal youth. In E. Singleton & A. Varpalotai (Eds.), Stones in the sneaker: Active theory for secondary school physical and health educators (pp. 155-182). London, ON: The Althouse Press. Halas, J., McCrae, H., & Carpenter, A. (2013). The quality and cultural relevance of physical education for Aboriginal youth: Challenges and opportunities. In J. Forsythe & A. R. Giles (Eds.), Aboriginal peoples and sport in Canada: Historical foundations and contemporary issues. Vancouver, BC: UBC Press.
Hardman, K., & Marshall, J. (2000a). Physical education in schools: Preliminary findings of a worldwide survey. International Council for Health, Physical Education, Recreation, Sport, and Dance, 36(3), 9-13.
Hardman, K., & Marshall, J. (2000b). Physical education in schools: Preliminary findings of a worldwide survey. Part II. International Council for Health, Physical Education, Recreation, Sport, and Dance, 36(4), 8-12.
Heart and Stroke Foundation. (2010). A perfect storm of heart disease looming on our horizon. Retrieved from http://www.heartandstroke.com/site/c.ikIQLcMWJtE/b.5761931/k.E35D/2010_report_ card__A_Perfect_Storm.htm?src=news
Hickson, C., Robinson, D. B., Berg, S., & Hall, N. (2012). Active in the north: School and community physical activity programming in Canada. International Journal of Physical Education, 4(2), 16-30. Jackson, W. (1988). Research methods: Rules for survey design and analysis. Scarborough, ON: Prentice-Hall Canada.
Janzen, H., Halas, J., Dixon, S., DeCorby, K., Booke, J., & Wintrup, L. (2003). The quality of physical education in Manitoba schools: A three year study. Physical & Health Education Journal, 69(2), 44. Johnson, B., & Christensen, L. (2012). Educational research: Quantitative, qualitative, and mixed ap-proaches (4th ed.). Thousand Oaks, CA: Sage.
Kirk, D. (2010). Physical education futures. New York, NY: Routledge.
Lawson, H. (1983). Toward a model of teacher socialization in physical education: The subjective warrant, recruitment, and teacher education. Journal of Teaching in Physical Education, 2(3), 3-16. Lawson, H. (1988). Occupational socialization, cultural studies, and the physical education cur-riculum. Journal of Teaching in Physical Education, 7(4), 265-288.
Mandigo, J. L., Thompson, L. P., Spence, J. C., Melnychuk, N., Schwartz, M., Causgrove Dunn, J., & Marshall, D. (2004). A descriptive profile of physical education teachers and related program characteristics in Alberta. The Alberta Journal of Educational Research, 50(1), 87-102.
Marshall, J., & Hardman, K. (2000). The state and status of physical education in schools in inter-national context. European Physical Education Review, 6(3), 203-229.
McCaughtry, N., Barnard, S., Martin, J., Shen, B., & Kulinna P. M. (2006). Teachers’ perspectives on the challenges of teaching physical education in urban schools: The student emotional filter. Research Quarterly for Exercise and Sport, 77(4), 486-497.
Melnychuk, N., Robinson, D. B., Lu, C., Chorney, D., & Randall, L. (2011). Physical education teacher education (PETE) in Canada. Canadian Journal of Education, 34(2), 148-168.
Merriam, S., & Simpson, E. (2000). A guide to research for educators and trainers of adults. Malabar, FL: Krieger.
Metzler, M. W. (2011). Instructional models in physical education. Scottsdale, AZ: Holcomb Hatha-way.
Miles, M., & Huberman, M. (1994). Qualitative data analysis: An expanded sourcebook. Thousand Oaks, CA: Sage.
Morgan, P. J., & Hansen, V. (2008). Classroom teachers’ perceptions of the impact of barriers to teaching physical education on the quality of physical education programs. Research Quarterly for Exercise and Sport, 79(4), 506-516.
O’Sullivan, M. (2013). New directions, new questions: Relationships between curriculum, pedagogy, and assessment in physical education (editorial). Sport, Education and Society, 18(1), 1-5.
Physical and Health Education Canada. (2013). Quality daily physical education. Retrieved from
http://www.phecanada.ca/programs/quality-daily-physical-education
Ramanathan, S., Allison, K. R., Faulkner, G., & Dwyer, J. M. (2008). Challenges in assessing the implementation and effectiveness of physical activity and nutrition policy interventions as natural experiments. Health Promotion International, 23(3), 290-297.