Ondik 1
Detecting the inclusion and exclusion of
a neuronal XDP-associated microexon in situ
By
Mercedes Maye Ondik
SUBMITTED TO THE DEPARTMENT OF BRAIN AND COGNITIVE SCIENCES IN SUPPLEMENT TO THE REQUIREMENTS FOR THE DEGREE OF
BACHELOR OF SCIENCE IN CHEMISTRY-BIOLOGY AT THE
MASSACHUSETTS INSTITUTE OF TECHNOLOGY JUNE 2018
©2018 Mercedes M. Ondik. All rights reserved. The author hereby grants to MIT permission to reproduce
and to distribute publicly paper and electronic copies of this thesis document in whole or in part
in any medium now known or hereafter created.
Signature of Author: _____________________________________________________ Department of Chemistry-Biology
May 21, 2018 Certified by: ____________________________________________________________ Ann Graybiel Professor of Brain and Cognitive Sciences Thesis Supervisor Accepted by: ___________________________________________________________ Laura Schulz Associate Professor of Cognitive Sciences Faculty Officer, BCS Undergraduate Program
Ondik 2
Abstract
X-linked dystonia parkinsonism (XDP), also known as torsion dystonia type 3 (DYT3), afflicts hundreds of individuals. Under an X-linked mode of inheritance, the DYT3 haplotype occurs in Filipino populations and is of the highest frequency in the Panay Islands of the Philippines. Recently, convincing evidence has shown the causative mutation to be an insertion of the repetitive sequence SINE-VNTR-Alus (SVA). This insertion is associated with misregulation of 3’ end exons in the gene TBP-associated factor 1 (TAF1). TAF1, the largest of fourteen TAF proteins, incorporates into a TATA binding complex that promotes transcription by RNA polymerase II. In a collaborative effort, singleplex BaseScope™ probes as well as antibodies have been produced to target two TAF1 isoforms, canonical TAF1, C-TAF1, and neuronal TAF1, N-TAF1, separately. N-TAF1 differs from C-TAF1 by the inclusion of a two amino acid
microexon, 3’ to the SVA insertion, known as 34’. Here, I show that N-TAF1 expression is confined to neurons and interneurons whereas C-TAF1 is widely expressed,
particularly by astrocytes, interneurons, neurons, and cells present in other organs including the heart and liver in mouse. Additionally, the antibodies produced show promise for use in human tissue. These results support the hypothesis that C-TAF1 and N-TAF1 have canonical and neuron-specific functions, respectively, and
misregulation of N-TAF1 is capable of causing neuronal degeneration. Ultimately these results set the foundation for the study of C-TAF1 and N-TAF1 functions and isoform misregulation in XDP diseased tissue. Furthermore, these probes and antibodies may serve as tools for the validation of XDP models, under development, in which
Ondik 3
Acknowledgments
This thesis is the most extensive piece of work I have ever undertaken. Three years ago, Professor Ann Graybiel accepted me into her laboratory, and the trajectory of my life was changed forever. Ann sets helping others as an absolute top priority. She has built an entire career focused around helping people with neurological diseases. But it goes beyond that; Ann shows humility and often puts the needs of the lab above her own. When I first joined the lab, Ann was not only delighted to have me, she insisted I meet with members of the lab to find a mentor, and I believe that that has made a world of difference. Ann, I regret not saying this more; thank you for all you have done for me. Thank you for supporting me from the very beginning and everywhere in between with stipends to work in the lab over IAP, writing letters of recommendation (some of the best, if not the best, letters recipients had ever read), and your support in traveling to New Zealand on two occasions. And thank you for leading me to Jill.
Two years ago, when I first asked my supervisor, Jill, if I could work on a publication, I thought I would be working on one part of one subsection of a single chapter piece. I never imagined my work in the Graybiel lab would culminate in me writing a four chapter thesis. By believing in me, and letting me bite off more than I can chew, Jill nurtured the young scientist within me. She guided me and encouraged me to do more and be more. And for that I am eternally grateful, for it has helped me become who I am today and accomplish what I have accomplished. Thank you Jill for all of the hours you’ve given me, all the talks, all the kind words and the truthful ones. I am so lucky to have you as my supervisor.
The process of writing itself has been a challenge. I’ve had later nights and earlier mornings than I’m used to, and I’ve worked for more hours than I originally intended, but I was never alone. When I had nothing left to give, I had a support system to push me further than I thought I could go. Mom and Dad, thank you for calling to check in on me. It means the world to me, and sometimes, those 3-5 minutes of hearing your voice and your encouragement makes a world of difference to my day. I’ve spent two years learning this field and performing experiments. In the last few months, I have been stretched beyond what I thought my limits were to truly understand the work I have been doing, but never did either of you doubt that I was capable of completing this task. No, you never doubted that I would excel beyond my own expectations. Thank you both for always believing in me. Never have you questioned whether or not what I aspired to do was possible. Nay, you have never questioned whether or not I would accomplish what I aspired to do because it WAS possible and I was going to achieve it. I love you both so much, and I hope you know that this thesis, my greatest piece of work, is our accomplishment.
Ondik 4
Brendan, Kaylie and Sam, these last two months have been crazy. B, your daily and sometimes bi-daily calls have gotten me through so much. And then you wouldn’t hear me for days as I was grinding away at my thesis and other course work. Thank you for helping me to keep calm when the vastness of a thesis overwhelmed me, and always having an air of understanding. Your advice has been invaluable, and my abilities as a scientist and writer have only benefited from your influence <3. Sam, your company and our road trips have helped me clear my head and reminded me of the bigger
picture. And don’t think I’ll forget your contribution to this work, “Hypothesis, of course!” Thank you for being a part of my journey. And Kaylie, you have been with me since the very beginning. Your friendship is so dear to my heart. Thank you for your
encouragement and unfading support.
There is an endless list of people, listed and not listed above, that have contributed to my well-being and outlook on the world that has ultimately allowed me to build this thesis as it is here. I have undoubtedly failed to give thanks where it is due, so to all who have challenged me to think differently than I did before, to all who have showed love, compassion, or lent me truth, to all those who have given me your time, and to all of those who have shared their energy and laughter, thank you. I am blessed beyond words, and it is because of all of you that I am able to spend endless hours writing about molecular probes and antibodies that may help provide therapies to a population of people suffering for this neurodegenerative disease, XDP. I hope that one day this work helps someone, like you have helped me to have better hours, better days, and a better life. And I will likely spend the rest of my life seeing that this is so.
Ondik 5
Table of Contents
Abstract ……… 2 Acknowledgements ….……… 3 List of Abbreviations ……….. 7 List of Figures ………. 9 List of Tables ……….. 10Chapter 1. Introduction to X-linked Dystonia Parkinsonism ……… 11
1.1 Clinical, pathological, and genetic description ………. 11
1.2 Possible mechanism of neurodegeneration in XDP ……….. 13
1.3 Misregulation of microexons is involved in, if not responsible for, the development of XDP and other diseases ………... 15
1.4 Purpose and implications for the characterization of C-TAF1 and N-TAF1 expression in wildtype mouse and normal human tissue …… 17
Chapter 2. Differential localization of C-TAF1 and N-TAF1 in mouse …………. 18
2.1 Introduction ………..……….……….………... 18
2.2 Methods ……….……….……….………... 19
2.2.1 Production of isoform-specific BaseScopeTM probes and antibodies 19 2.2.2 Animals ……….……….……….………. 20 2.2.3 Tissue preparation ……….……….…………. 21 2.2.4 Western blot ……….……….……… 22 2.2.5 In situ hybridization ……….……….……….. 22
2.2.6 Immunofluorescent and immunohistochemical labeling with C-TAF1 and N-TAF1……….……… 23
2.3 Results .……….……….……….. 23
2.3.1 In situ hybridization with C-TAF1 and N-TAF1 BaseScopeTM probes in the striatum ……….……….……… 23
2.3.2 Western blotting with C-TAF1 and N-TAF1 antibodies in mouse brain homogenates ……….……… 25
2.3.3 Immunofluorescent staining with C-TAF1 and N-TAF1 antibodies ……….……….………... 26
Ondik 6
Chapter 3. Testing C-TAF1 and N-TAF1 antibodies in human tissue ……….. 32
3.1 Introduction ……….……….……….…………. 32
3.2 Methods ……….……….……….………... 33
3.2.1 Tissue acquisition and fixation ……….………. 33
3.2.2 Western blot ……….……….……….. 34
3.2.3 Immunohistochemical labeling ……….………. 34
3.3 Results ……….……….……….. 35
3.3.1 Western blotting of C-TAF1 and N-TAF1 in human brain homogenates ..……….……….……… 35
3.2.2 Immunohistochemical labeling of C-TAF1 and N-TAF1 in free-floating sections of human anterior striatum ………… 37
3.4 Discussion ……….……….……….……….. 39
4. Concluding remarks ……….……….……….……… 43
4.1 Major observations and interpretation of complete set of results .... 43
4.2 Prospective work and larger implications ……….………….. 46
4.2.1 Results in mouse are relevant to XDP mouse models under development and to testing of future XDP therapies ………. 46
4.2.2 Reproducing observation of preferential degeneration of striosomes in XDP ………..………. 47
4.2.3 Probing the possibility of N-TAF1 as a potential therapy target ………..………..……….. 48
4.2.4 Implication for other microexon-related diseases ……….. 50
References ………..………..………..……… 52
Appendices ………..………..………..………... 55
Appendix I: Supplementary Figures ………..……… 55
Appendix II: Supplementary Tables ………..……… 58
Ondik 7
List of Abbreviations
34’ - TAF1 micro-exon 34’ AAV9 - Adeno-associated virus
BAC - Bacterial artificial chromosome
bp - base pair
Calb - Calbindin
CalDAG-GEF1 -
Diacylglycerol-regulated guanine nucleotide exchange factor I
CaN - Calcineurin
CC - Corpus callosum
C-TAF1 - Canonical isoform of TAF1 DAB - 3,3′-Diaminobenzidine
DARPP-32 - Dopamine and cAMP-regulated phosphoprotein 32 DAT - Dopamine transporter
dpc - Days post coitum
DRD1 - Dopamine receptor type D1 DRD2 - Dopamine receptor type D2
DSC - Disease specific sequence change DYT3 - Torsion dystonia type 3
GFAP - Glial fibrillary acidic protein GFP - Green fluorescent protein ID - Intellectual Disability
IF - Immunofluorescence/immunofluorescent IHC - Immunohistochemistry/Immunohistochemical iPSC - Induced pluripotent stem cell
IR - Intron retention
ISH - In situ hybridization Ki-67 - Marker of proliferation MOR1 - μ-opioid receptor 1 MSN - Medium spiny neuron
Ondik 8
MTS - Multiple transcript system
NGS - Normal goat serum
nSR100 -
Neural-Specific Serine/Arginine Repetitive Splicing Factor of 100 KDa (aka SRRM4)
N-TAF1 - Neuronal isoform of TAF1 OCT - Optimal cutting temperature
PBS-T - 0.1% triton-x in phosphate buffered saline
PFA - Paraformaldehyde
PV - Parvalbumin
PVDF - Polyvinylidene fluoride
qPCR - quantitative polymerase chain reaction SHB - Sucrose homogenization buffer
SNc - Substantia nigra pars compacta SNr - Substantia nigra pars reticulata SNV - Single-nucleotide variant
SOM - Somatostatin
SRRM4 - Serine/Arginine Repetitive Matrix 4 SVA SINE-R, VNTR, and Alu-type SVZ - Sub-ventricular Zone
TAF - TATA-box binding protein associated TFIID factor TAF1 - TATA-box binding protein associated factor 1 TBP - TATA-box binding protein
TBS-T - 0.1% triton-x in tris buffered saline
tdTom - Tandem dimer tomato fluorescent protein TFIID - Transcription factor II D complex (TFIID) vol/vol - Volume per volume
wt/vol - Weight per volume
Ondik 9
List of Figures
Figure 1.1 The XDP haploblock. 12
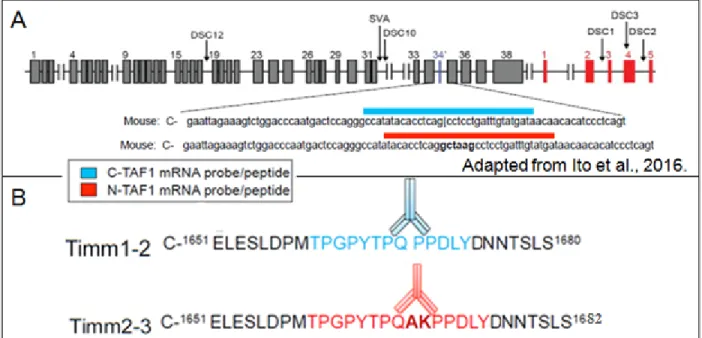
Figure 1.2 N-TAF1 differs from C-TAF1 by the inclusion of
microexon 34’. 16
Figure 2.2 The binding sequences of C-TAF1 and N-TAF1
BaseScope™ probes and antibodies differ only by exon 34’.
18
Figure 2.3 N-TAF1 and C-TAF1 are abundantly expressed in both the striosomes and matrix of the striatum.
24
Figure 2.4 C-TAF1 and N-TAF1 specific signal in Western blot in mouse tissue homogenates.
25 Figure 2.5 C-TAF1 is expressed by striatal neurons as well as
dopamine producing neurons of the substantia nigra, interneurons, and astrocytes.
27
Figure 2.6 C-TAF1 is expressed in proliferating cells of the SVZ. 28 Figure 2.7 N-TAF1 is expressed by a subset of interneurons. 28 Figure 3.1 Species-specific sequences of C-TAF1 and N-TAF1
mRNA and protein.
32 Figure 3.2 Serial dilution of C-TAF1 in IF Western blot of human
brain homogenates.
36 Figure 3.3 Serial dilution of N-TAF1 in IF Western blot of human
brain homogenates.
37 Figure 3.4 Immunohistochemical labeling of human N-TAF1 in
anterior caudate nucleus.
38 Figure S1 Serial dilution of C-TAF1 and N-TAF1 in Western blot of
mouse tissue.
55 Figure S2 qPCR in matrix-GFP striatal cells of CalDAG-GEF1 mice. 55 Figure S3 C-TAF1 but relatively no N-TAF1 mRNA is produced by
non-neuronal epithelial cells lining the ventricle.
56 Figure S4 C-TAF1, N-TAF1, and nSR100 immuno-labeling in
mouse tissue.
Ondik 10
List of Tables
Table 2.1 Transgenic mouse lines. 20
Table S1 Primary antibodies 58
Ondik 11
Chapter 1
Introduction to X-linked Dystonia Parkinsonism
1.1 Clinical, pathological, and genetic description
X-linked dystonia-parkinsonism (XDP/DYT3) is a fatal neurodegenerative disease endemic to the Panay Islands of the Philippines. Although the order of onset and penetration of symptoms differs in some, female patients in particular, XDP most often onsets in early adulthood with painful, progressive dystonia that is followed by the development of parkinsonism (8; 5). These clinical symptoms are results of misregulated motor control in the striatum of the basal ganglia.
The dorsal striatum is composed of two sub-compartments called striosomes and matrix that are primarily composed of inhibitory projection neurons known as medium spiny neurons (MSNs). MSNs may be divided into two subclasses based on their expression of dopamine receptor subtypes: D1 receptor (DRD1) or D2 receptor (DRD2) expressing MSNs. DRD1-positive MSNs are involved in the direct pathways while DRD2-positive MSNs are a part of the indirect pathways of basal ganglia (BG) circuitry, based upon whether they project directly or indirectly, through intermediate BG nuclei, to the BG output nucleus (13), A third pathway is defined by inhibitory projections of MSNs from the striosomal compartment, which project to dopamine-producing neurons in the
substantia nigra pars compacta (SNc; 4). Activation of the SNc dopamine-producing neurons provides dopamine back to the DRD1 and DRD2 expressing MSNs in both the striosomes and matrix. This undoubtedly simplified circuitry provides a foundation for
Ondik 12
understanding how degeneration of the matrix and striosomal MSNs could give rise to the clinical symptoms observed in XDP.
Neurodegeneration of dorsal striatum projection neurons, aka medium spiny neurons (MSNs), is characteristic of XDP (8). Evidence suggests that neurodegeneration of striosomal MSNs occurs first and only in later stages do matrix neurons begin to
degenerate (8; 22). It is possible then that differential degeneration of striosomes and of matrix is correlated to the stage-like development of dystonic symptoms and
parkinsonian symptoms respectively.
Unlike many other neurodegenerative diseases, there appears to be a clear cause of XDP, the inheritance of a disease locus known as the DYT3 haplotype (Fig. 1.1). The
Figure 1.1 The XDP haploblock. From top to bottom, this diagram shows the X
chromosome, the tightly linked and inherited XDP haplotype, DYT3, in its totality and the region of DYT3 containing all seven mutations. In this final region, TAF1 exons (black rectangles) and multiple transcript system (MTS; blue rectangles) are given, while blue arrows and their labels denote the location and identity of all seven DYT3 linked mutations. Adapted from Kawarai et al., Brain Research 2017.
Ondik 13
DYT3 haplotype is 294 kbs in length and four of its seven disease specific sequence changes (DSCs), two single-nucleotide variants (SNVs) DSC10 and DSC12, a 2.6kb SVA (SINE-R, VNTR, and Alu)-type retrotransposon insertion, and a 48bp deletion—lie within the TAF1 gene (6; 10). Genomes of XDP afflicted patients analyzed by genome sequencing have all so far contained all seven XDP-linked variants encompassed by the DYT3 locus (18; 17; 6). This suggests a founder effect origin for XDP and the inheritance of the DYT3 haplotype as the cause of this disease.
1.2 Possible mechanism of neurodegeneration in XDP
The molecular and cellular mechanisms of XDP pathology are not yet known, but evidence from evaluation of patient samples suggests that there is misregulation of TAF1 expression that then results in cell death. TAF1 encodes a 250kDa protein, the largest of fourteen TATA Binding Protein Associated Factors. Along with TAF1-TAF14 and TATA binding protein (TBP), TAF1 assembles into a TATA box binding complex (TFIID) that is central to RNA polymerase II mediated transcription. TAF1 in particular has been implicated in the regulation of RNA polymerase II to mediate cellular signals from gene-specific activator proteins that promote mRNA transcription (24; 22).
It has been shown in human XDP tissue that the neuronal TAF1 expression is
downregulated in the neurons of the caudate nucleus (17). Studies of XDP fibroblast derived neural stem cells (NSCs) have attempted to quantify how other TAF1 isoform expression is changed due to XDP. One such study, which has shown C-TAF1 and TAF1 expression are significantly lower in XDP derived cells, proposes that reduced N-TAF1 results in neurodegeneration (10). Another study observed significant
Ondik 14
downregulated of C-TAF1 and usage of exons downstream of exon 32 in XDP fibroblast derived NSCs and suggested it was the misregulation of a range of 3’ end exons that is the cause of neurodegeneration (1).
Extraction and analysis of total C-TAF1 and N-TAF1 mRNA has shown drastic differences between N-TAF1 and C-TAF1 expression in embryonic through adult wildtype mice. C-TAF1 expression appears to peak at the embryonic age of 10.5 dpc (days post coitum) before declining to a steady state. N-TAF1 expression first occurs at 10.5 dpc and plateaus at 17.5 dpc onward (11). This observation, in addition to the differences seen in the study of XDP tissue and XDP fibroblast derived NSCs, invites the hypothesis that N-TAF1 and C-TAF1 have unique functions. Considering that there are multiple isoforms of TAF1, not discussed here, it might be that other TAF1 isoforms also have unique functions and potential consequences of misregulating multiple TAF1 isoforms may include neurodegeneration.
Out of the seven DYT3 haplotype mutations, the SVA insertion is most likely to be responsible for changes observed in TAF1 expression. The SVA insertion has been implicated in exon skipping and more specifically, splicing misregulation of 3’ TAF1 exons such as microexon 34’ (17
; 1). Without modifying the other six mutations,
excision of the SVA insertion has been shown to return the intron retention (IR) of TAF1 introns to near control levels in iPSCs from XDP patients (1). These data suggest that the SVA insertion alone has the ability to misregulate TAF1 isoforms in cultured cells and thus is a likely cause of XDP. Additionally, in a study of 81 probands, a reverse correlation between the number of CCCTCT hexameric repeats within the SVA insertion and the age of onset (AO) of XDP was observed (3). This observation suggests that the
Ondik 15
SVA insertion not only causes XDP but its length determines the degree to that 3’ end TAF1 exons are misregulated and in doing so, can influence the AO in XDP.
1.3 Misregulation of microexons is involved in, if not responsible for,
the development of XDP and other diseases
Microexons, which can be short as 3 bps and as long as 51 bps, are made vulnerable to skipping due to their size (15). The mRNA of N-TAF1 differs from that of canonical C-TAF1 by the inclusion of a 6 bp microexon (34’) encoding alanine and lysine (Fig. 2.2). nSR100 is a splicing factor responsible for proper regulation of microexons that define neuronal isoforms of multiple genes, and knockdown of this protein has been shown to result in a decrease in N-TAF1 expression (21; 9). The misregulation of nSR100 and microexons in genes other than TAF1 has been linked to multiple diseases including autism, schizophrenia, epilepsy (20; 9; 15).
The SVA insertion inherited in XDP disrupts proper splicing of TAF1, and in doing so, it misregulates the transcription of its isoforms in a way that is not yet understood.
Despite the ambiguity of this process, it is possible to imagine the potential
consequences of such misregulation. Skipping of microexon 34’ in neurons for instance could directly result in an increase of C-TAF1 transcripts and a decrease of N-TAF1 transcripts causing the ratio of N-TAF1 to C-TAF1 to decrease. Thus, a change in the
Ondik 16
Figure 1.2 N-TAF1 differs from C-TAF1 by the inclusion of microexon 34’. TAF1 exons
(black rectangles) correspond with the numbers under each C-TAF1 and N-TAF1
transcript, which denote the exons that they are composed of. Adapted from Kawarai et al., Brain Research 2017.
ratio of N-TAF1 to C-TAF1—despite the minor difference between the two isoform sequences—might have deleterious effects in neurons such as those observed in XDP. This consideration applies not only to N-TAF1 and C-TAF1 but rather to all transcript variants that include and exclude exons downstream of the SVA insertion. Alternatively, the presence of alanine and lysine in N-TAF1 could result in a major structural
difference, making N-TAF1 essential for neuron survival.
Mutations in C-TAF1, upstream of the SVA insertion site, have been known to cause X-linked Intellectual Disability (ID) syndrome, also known as MRXS33, which causes non-neuronal symptoms such as dysmorphic facial features in addition to neuron-related symptoms including severe developmental delay, intellectual disability, and gait
abnormalities (19). N-TAF1 is likely to have a neuron specific function that differs from C-TAF1. Understanding the effects of such disrupted isoform expression could be the
Ondik 17
key to understanding the pathologic effects of the mutations found in DYT3 and the clinical differences between XDP and MRXS33.
1.4 Purpose and implications for the characterization of C-TAF1 and
N-TAF1 expression in wildtype mouse and normal human tissue
In collaboration with Marc Timmers of the University Medical Center Utrecht, Abcam, and ADCBio, antibodies and singleplex BaseScopeTM probes that differentiate between N-TAF1 and C-TAF1 have been developed. N-TAF1 and C-TAF1 are expressed in different tissue regions and make up different percentages of total TAF1 expression. Thus, it is likely that C-TAF1 and N-TAF1 have unique functions. This work describes how these antibodies and probes were used to begin to characterize the anatomical and localization of C-TAF1 and N-TAF1 in specific cell types in mouse tissue. Second, this work aimed to test the isoform specific antibodies in human tissue to begin performing a parallel characterization of C-TAF1 and N-TAF1 localization in human.
These antibodies and probes make it possible to develop a better understanding of the differential expression of various TAF1 isoforms in both human and mouse tissue. Once the localization of TAF1 isoforms has been characterized in control mouse and normal human tissue, this work will serve as the foundation for studying how isoform expression is changed in diseased tissue. Furthermore, isoform-specific antibodies and BaseScopeTM probes will serve as valuable tools for validation of cellular and mouse XDP models. The mechanistic understanding of TAF1 isoform expression in human combined with sound mice models will help advance the development of therapies to ultimately provide more direct treatment and possibly a cure for this debilitating disease.
Ondik 18
Chapter 2
Differential localization of C-TAF1 and N-TAF1 in mouse
2.1 Introduction
The antibodies and BaseScopeTM probes designed and produced for my experiments are a unique technology with promising implications for the study of microexon
regulation and misregulation in XDP as well as other diseases. For this work, singleplex BaseScopeTM probes and polyclonal antibodies were produced against the N-TAF1 and C-TAF1 sequences and peptides (Fig. 2.2). Our collaborators have shown that both
Figure 2.2 The binding sequences of C-TAF1 and N-TAF1 BaseScope™ probes and
antibodies differ only by exon 34’. A) C-TAF1 (blue) and N-TAF1 (red) BaseScopeTM
probes were produced to target the nucleotides below the blue and red bars,
respectively. B) Monoclonal C-TAF1 antibody #177-4, derived from rabbit, Timm1-2, and polyclonal N-TAF1 antisera from rabbit, Timm2-3, were raised against peptides with
Ondik 19
the amino acids sequences labeled in blue or red (see Methods section 2.2.1). Exon 34’ (gctaag) encodes the amino acids A (alanine) and lysine (K), shown in bold.
antibodies have provided target-specific signal in Western blot of the immortalized human HeLa cell line overexpressing C-TAF1 or N-TAF1 (data not shown).
BaseScope™ probes were produced and tested with Advanced Cell Diagnostics, Inc., in close consultation with the Graybiel laboratory (7).
In my work, in situ hybridization with the two TAF1 isoform specific BaseScopeTM probes was performed in transgenic mouse models in which specific MSN cell types could be identified. This allowed me to examine the striatum sub-compartment-specific localization of N-TAF1 and C-TAF1. Furthermore, immuno-labeling of both C-TAF1 and N-TAF1 in certain cell-types in mouse tissue was performed providing the first look into the cell-specific localization of C-TAF1 and N-TAF1 in mouse striatum. Additionally, the antibodies were tested for Western blot using normal mouse brain homogenates, versus the HeLa cells overexpressing TAF1, which were initially used, and which were to later serve as positive controls for human tissue experiments (see Chapter 3).
2.2 Methods
Immunohistochemistry (IHC), immunofluorescent staining (IF) and in situ hybridization (ISH) experiments were conducted at MIT’s McGovern Institute for Brain Research in the laboratory of Prof. Ann Graybiel. Western blots were performed at the University of Auckland’s Centre for Brain Research in the laboratory of Prof. Richard Faull.
Ondik 20
For detection of the N-TAF1 (ADCBio, #713761), and the C-TAF1 (ADCBio, #713771) isoform transcripts, BaseScope™ probes were utilized. Both monoclonal rabbit-anti-C-TAF1 antibody #177-4 and polyclonal rabbit-anti-N-rabbit-anti-C-TAF1 antisera, with affinity for
peptides C-1659TPGPYTPQPPDLY1673 and C-1659TPGPYTPQAKPPDLY1675 respectively, were ordered for production from Abcam (for specifics, go to abcam.com) by the
laboratory of Prof. Marc Timmers (Fig. 2.2).
2.2.2 Animals
All IHC and ISH protocols for work with mice were approved by MIT’s Committee on Animal Care. Prior to harvesting, adult male and adult female mice were housed,
Table 2.1 Transgenic mouse lines. Labeling in each cell line, immunofluorescent
staining (IF), in situ hybridization (ISH), or Western blot (WB), is given in column 3. DAT-Cre, DRD1 and DRD2 BAC lines are described in Crittenden et al., PNAS 2016.
Mouse Line Genetic Description Antibodies used
Cre-ERT2 Tamoxifen-inducible Cre line, used here as wildtype
C-TAF1 and PV (IF) N-TAF1 and PV (IF) C-TAF1 and SOM (IF) C-TAF1 and GFAP (IF) DAT-Cre Line with Cre expression in dopamine
containing neurons. AAV9 with Cre-dependent GCaMP6m was injected to label nigrostriatal neurons
C-TAF1 and DAT (IF)
DRD1-tdTom BAC, DRD2-GFP BAC
Line with tdTom and GFP expressed in DRD1 and DRD2 striatal neurons, respectively
C-TAF1 and D1 and D2 (IF)
Q175 WT Wildtype sibling of Huntington’s disease knock in mouse model
C-TAF1 and Ki-67 (IF)
CalDAG-GEFI-GFP BAC
Line with GFP expression in DRD1 and DRD2 neurons of the matrix, but not striosomal, sub-compartment of the striatum
C-TAF1 and GFP (ISH) N-TAF1 and GFP (ISH)
C57BL/6 Wildtype line C-TAF1 (WB)
Ondik 21
allowed free access to food and water and kept on a standard daily light and dark rotational cycle. Specific genetic descriptions are given in Table 2.1.
2.2.3 Tissue preparation
The brains of deeply anesthetized mice—to be used for ISH—were removed and dissected on ice. A striatal block of tissue was placed into cold Optimal Cutting
Temperature (OCT) Compound within a cryo-mold, which was then filled with OCT and cooled further in a bath of methyl butane (Tissue-Tek, Sakura Finetek Inc.). Once opaque, cryo-molds were pre-cooled on dry ice then sealed in plastic bags and stored at -80°C. Striatal blocks were sectioned at 10 μm and sections were placed onto positively charged slides (Leica Biosystems Imaging, Inc.) and then stored at -80°C.
Deeply anesthetized mice—to be used for IHC—were transcardially perfused with 20 ml of 0.9% saline solution followed by 60 ml of 4% paraformaldehyde in 0.1M NaKPO4
(wt/vol) fixative (PFA) that was freshly depolymerized via heating. Brains were post-fixed for 90 minutes in PFA and then transferred to 25% (vol/vol) glycerol cryo-protectant solution and stored at 4°C. Mouse brains were frozen on dry ice and sectioned at 30 µm on a sliding microtome and sections were stored in 0.1% sodium azide in 0.1M phosphate in NaKPO4 buffer and stored at 4 °C (see Table 2.1).
Ms98, mouse brain sample 98 from C57BL/6 mouse line, was dissected, freshly frozen and stored at -80°C. In preparation for Western blot, three samples of ~0.2 gram of brain, ms98, per sample was dissected. Separate but approximately identical samples were homogenized in each of three buffers, sucrose (SHB), radio-immunoprecipitation assay (RIPA), and tris-triton (TT) homogenization buffers (Supplementary Methods).
Ondik 22
Total protein concentration was calculated for each homogenized tissue sample via Bio-Rad Dc Protein Assay, and samples were stored at -80°C.
2.2.4 Western Blot
Three µL of dual color standard ladder (Precision Plus Protein, catalog #1610374) or 20μg of protein was loaded per well of 4-12% Bis-Tris gels (Invitrogen Corp.). The gel was run for 30 minutes at 50V then 90 minutes at 100V in a gel tank (Invitrogen
Corp.). A transfer module (Bio-Rad Laboratories Inc.) was used on ice overnight at 30V to transfer to polyvinylidene fluoride (PVDF) membrane. The PVDF membrane was then cut into separate strips that were incubated separately in housekeeping protein and C-TAF1 or N-TAF1 in buffer (50% TBS-T and 50% odyssey blocking buffer) or buffer lacking primary antibody overnight at 4°C (Table 2.2). Next, PVDF membranes were rinsed in TBS-T buffer, and incubated in secondary antibodies (Table 2.3). Membranes were rinsed in TBS-T and TBS, and then imaged using the Odyssey® Fc Imaging System (Li-Cor®) and Image Studio™ Software v5.2 (Li-Cor®).
2.2.5 In situ hybridization
Staining of C-TAF1 (ADC Bio, #713771) and, in adjacent sections, N-TAF1 (ADC Bio, #713761) and GFP (ADC Bio, #400281) was performed in CalDAG-GEF1 mouse line (Table 2.1). Coronally sections containing anterior striatum were imaged using a slide scanner (Aperio Technologies Inc.) at 40X. After image processing in Adobe
Photoshop CC (Adobe Systems), sections were viewed at high magnification and true perinuclear signals were identified and circled manually using ImageScope (Leica Biosystems Imaging, Inc.). The number of N-TAF1 cells within striosomes, defined by
Ondik 23
GFP-negativegroups of cells within the striatum of the CalDAG-GEF1 mouse, and matrix, defined asregions of GFP-positivecells, were counted and the number of cells per square area of striosome versus matrix was compared.
2.2.6 Immunofluorescent and immunohistochemical labeling with C-TAF1 and N-TAF1
Sections were incubated overnight with primary antibodies on a shaker at 4°C (special conditions described in Table S1). Bound antibodies were detected by fluorophore-coupled secondary antibodies (Table S2). Sections for some reactions were then incubated for five minutes in DAPI to label cell nuclei (Table S1). Antibodies were suspended in blocking solution (TSA; PerkinElmer) at each step. Mounting and cover-slipping with fluorophore-compatible media (ProLong Antifade Reagent; Thermo Fisher Scientfic) prepared the sections for imaging by ZEN imaging software on the Zeiss LSM 510 Confocal Microscope. Fiji (ImageJ) software was used to analyze images.
2.3 Results
The mouse models in which in situ hybridization, immunofluorescent (IF) Western blot, and IF in situ staining were performed are described in Table 2.1.
2.3.1 In situ hybridization with C-TAF1 and N-TAF1 BaseScopeTM probes in the striatum
In situ hybridization with C-TAF1 or N-TAF1 within tissue in which striosomes could be differentiated from matrix made possible the quantification of C-TAF1 and N-TAF1 expression in various regions of interest in mouse brain. In situ labeling in mouse
Ondik 24
showed abundant C-TAF1 signal, as expected, in the glial-enriched corpus callosum, in regions with few post-mitotic neurons, e.g. cells lining the ventricle walls and the sub-ventricular zone (SVZ), and neuronal cells throughout the striatum and cerebral cortex (Fig. S3; Fig. 2.3). N-TAF1, also as expected, was instead enriched in neuron-dense regions of the striatum and cerebral cortex. Within the striatum, C-TAF1 and N-TAF1-positive cells were present in both the striosome and matrix (Fig. 2.3A; Fig 2.3B). More
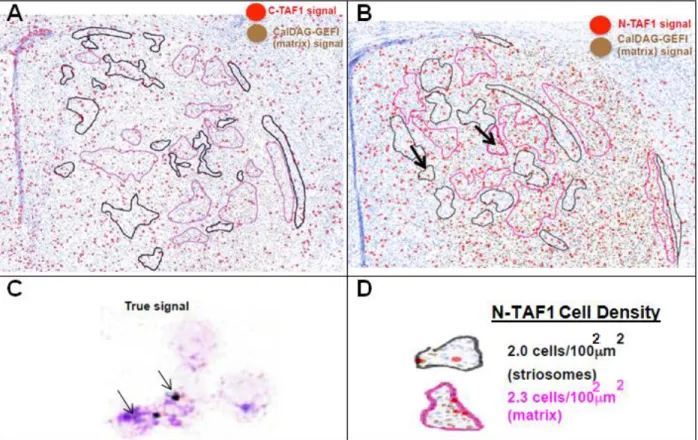
Figure 2.3 N-TAF1 and C-TAF1 are abundantly expressed in both the striosomes and
matrix of the striatum. In situ GFP labeling was overlaid with nearby sections labeled for A) C-TAF1 and B) N-TAF1. Arrows in (B) point to the striatal sub-compartments, striosomes (black outline) and matrix (pink outline). Arrows in (C) show raw signal in cells warranting a red circle in A) and B). D) Examples of outlined striosome and matrix compartments and calculations of N-TAF1-psoitive cell density.
Ondik 25
specifically, 2.0 x 10⁻⁴ N-TAF1-positive cells / µm2 and 2.26 x 10⁻⁴ C-TAF1-positive cells / um^2 of striosome compared to 2.3 x 10⁻⁴ N-TAF1-positive cells / µm2 and 1.68 x 10⁻⁴ C-TAF1-positive cells / um^2 of matrix was observed (Fig 2.3D).
2.3.2 Western blotting with C-TAF1 and N-TAF1 antibodies in mouse brain homogenates
Here, immunofluorescent (IF) Western blot of mouse brain homogenates is shown. This experiment was done with the goal of strengthening the observation of C-TAF1 and N-TAF1 via chemiluminescent Western blot of HeLa cells to further validate the use of these antibodies in mouse tissue. A positive C-TAF1 band at the expected 250kDa size
Figure 2.4 C-TAF1 and N-TAF1
specific signal in Western blot in mouse tissue homogenates. A) Western blot of C57BL/6 mouse brain sample homogenized in three different buffers, as indicated, and stained with C-TAF1 (red). B) C57BL/6 mouse brain sample homogenized in RIPA buffer and stained with N-TAF1 (red). β-actin (green) serves here as a
Ondik 26
intensity in mouse tissue was observed in mouse brain sample homogenized in SHB, TT, and RIPA buffer (Fig. 2.4; Fig. S1). Signal was best observed with the lowest background and reasonable homogenized in RIPA buffer at a 1:5,000 C-TAF1
concentration. N-TAF1-specific immuno-signal was not observable in IF Western blot of any mouse tissue sample at a dilution rate of either 1:3,000 or 1:10,000 (Fig. S1).
2.3.3 Immunofluorescent staining with C-TAF1 and N-TAF1 antibodies
IHC was performed to co-label cells with TAF1 isoform-specific antibodies and a variety of immuno-markers to begin characterizing the cell-specific expression patterns of C-TAF1 and N-C-TAF1. C-C-TAF1 signal in the striatum was observed in DRD1 and DRD2 DA-receptor expressing neurons and appeared to be equivalent across the striatum with no hints of compartment segregation between the matrix and striosomes (Fig. 2.5A). C- TAF1 was also observed in dopamine producing cells in the SNc (Fig. 2.5B),
parvalbumin (PV)-positive cells (Fig. 2.5C), somatostatin(SOM)-positive cells (Fig. 2.5D) and GFAP-positive cells (Fig. 2.5E). PV and SOM are interneuron markers and GFAP is a prominent astrocyte marker indicating that C-TAF1 is present in multiple subtypes of interneurons and GFAP-positiveastrocytes. Ki-67-positive proliferating cells in the SVZ (Fig. 2.6), which are possibly neural progenitor cells, were also C-TAF1-positive. PV-positive interneurons also co-labeled with N-TAF1; N-TAF1 signal was observed in PV labeled cells in primarily the nucleus with some extra-nuclear signal. This experiment shows that N-TAF1 antisera signal is present in at least a subset of PV-positive striatal interneurons (Fig. 2.7).
Ondik 27
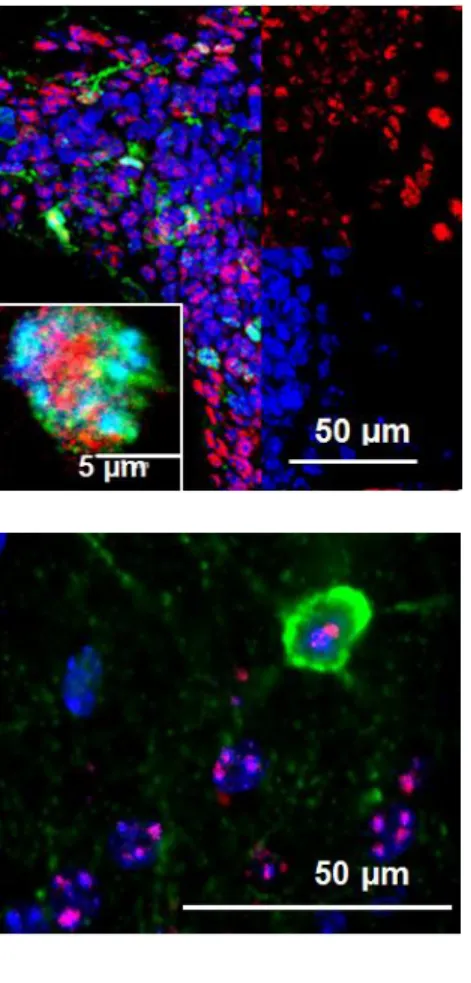
Figure 2.5 C-TAF1 is expressed by striatal neurons as well as dopamine producing
neurons of the substantia nigra, interneurons, and astrocytes. C-TAF1 (cyan) signal overlays with A) tdTom (red) signal and GFP (green) signal in double transgenic D1-tdTom BAC, D2-GFP BAC mouse. C-TAF1 signal is found in B) dopamine-containing neurons labeled by DAT immuno-marker (magenta), C) PV signal, D) SOM signal, and E) GFAP signal in coronal mouse brain sections. Cell specific markers parvalbumin (PV), somatostatin (SOM), and glial fibrillary acidic protein (GFAP), are shown in magenta while C-TAF1 is shown in cyan and DAPI is in blue.
Ondik 28
Figure 2.6 C-TAF1 is expressed in proliferating cells of
the SVZ. C-TAF1 (cyan) overlaid with Ki-67 (red) and DAPI (blue) in Q-175 (wild-type) mouse. Expression of the cell-specific marker, Ki-67, is significantly increased in proliferating cells.
Figure 2.7 N-TAF1 is expressed by a subset of
interneurons. N-TAF1 (red) overlaid with PV (green) and DAPI (blue) in Cre-ERT2 (wild-type) mouse.
Cell-specific marker, PV is Cell-specific to parvalbumin-positive interneurons.
2.4 Discussion
In Western blot, any of the three tested buffers resulted in 250 kDa signal in mouse tissue. For this to happen, RIPA, TT, and Sucrose homogenization buffers were able to extracted C-TAF1 from the nucleus and sufficiently dissociated C-TAF1 from other proteins, and throughout this process, C-TAF1 maintained its conformation.
Furthermore, within the buffers used for Western blot, the C-TAF1 antibody maintained its affinity for its target resulting in the signal observed here.
N-TAF1 antisera signal was not observed. It is possible that N-TAF1 protein requires a homogenization buffer other than the three that I tried. A more likely possibility is that the 1:3,000 and 1:10,000 antibody concentrations, first estimates derived from the 1:3,000 dilution rate used by the Marc Timmers group, used are too low for N-TAF1 to
Ondik 29
work in immunofluorescent Western blot of brain homogenates. The Timmers group obtained N-TAF1-specific signal from human HeLa cells that overexpressed N-TAF1. The optimal concentrations in an overexpression system is not an ideal reference for what might work best on brain homogenates however. Thus, this experiment would likely benefit from a broader range of concentrations of antibody inclusive of 1:100, 1:500, and 1:1,000.
With these remaining possibilities, one cannot yet conclude whether or not these N-TAF1 antisera is a fit immuno-label for N-N-TAF1 in tissue homogenates. Some
antibodies never produce signal in Western blot, for they either have insufficient affinity for their target in Western blot or their target cannot be extracted from cells while conserving its structural conformation. Although it is preferable to obtain Western blot signal, and thus confirm the size of the target bound by a particular antibody, it could be that this will not be possible for this N-TAF1 antisera.
In situ hybridization of C-TAF1 and N-TAF1 showed C-TAF1 signal in cells of mouse liver, heart, and brain whereas N-TAF1 signal was only present in the brain. This was expected because across the literature, C-TAF1 is known to be constitutively expressed in all cells that have been analyzed while N-TAF1 is known as the neuronal isoform of TAF1. More specifically C-TAF1 is present in glial-enriched CC and the undifferentiated cells of the SVZ in neuron-enriched striatum. These observations indicate that C-TAF1 is expressed in a variety of neuronal and non-neuronal cell types throughout the body. As of date, N-TAF1 has only been observed in neuronal cells validating its name, neuronal TAF1.
Ondik 30
Here, the first cell-type characterization experiment of C-TAF1 and N-TAF1 expression in mouse has been described. As 95% of the striatum is made up of MSNs, it is likely that N-TAF1 and C-TAF1, which were both observed in relatively high levels throughout the striatum via ISH, are expressed by MSNs of the striatum (22). This prediction of C-TAF1, for instance, is confirmed by co-labeling DRD1 and DRD2 with C-TAF1 via IF. Furthermore, it is possible that N-TAF1 is present in PV-positive interneurons as well as other subsets of interneurons and types of neurons as was observed in rat (22).
Use of the N-TAF1 antisera showed N-TAF1 signal co-localized with the PV immuno-marker, but some N-TAF1 signal appeared to be extra-nuclear. This is unexpected because N-TAF1 is known to localize to the nucleus of cells. It is possible that this can be attributed to non-specific background. Use of N-TAF1 with antigen retrieval
diminished the signal, and antigen retrieval is observed to reduce non-specific signal throughout other studies’ results (16
). However, further experimentation will be required to probe this discrepancy further. Validation of this N-TAF1 antisera in IF of mouse tissue will allow its use along with the C-TAF1 antibody in further characterization of N-TAF1 and C-N-TAF1 in control mouse brain, in validation of future XDP mouse models, and ultimately in the testing of novel therapies for XDP.
In studies of human XDP tissue, a preferential degeneration of the striosomal neurons has been observed (8). In experiments in rat, it was shown that N-TAF1 is preferentially localized to striosomes, providing an explanation for the vulnerability of striosomes observed in XDP tissue (22). Here in mouse tissue, expression of N-TAF1 in both the striosomal and matrix sub-compartments of the striatum appeared to be
N-Ondik 31
TAF1 expression differs across species. However, this lack of correlation between the cell-type expression of N-TAF1 in mouse and neurodegeneration, although initially bewildering, is similar to a number of neurodegenerative disorders, including Huntington’s disease and SCA17 (25
).
The experiments performed to date have confirmed the absence of N-TAF1 and the presence of C-TAF1 in tissues outside of the brain and in non-neuronal rich regions of the brain, the corpus callosum (CC) and the SVZ. These observations are strengthened by work done with the BaseScope™ probes (Fig. 2.3; Fig. S3) and IHC experiments with C-TAF1 and N-TAF1 antibodies performed by members of the Anne Graybiel laboratory (Fig. S4). The differential localization of these isoforms supports the possibility of distinct functions for these two isoforms of TAF1 highlighting the importance of proper regulation of alternative splicing.
As this work is continued by other members of the Graybiel lab to characterize C-TAF1 and N-TAF1 in normal mouse brain, creation and commercialization of an XDP mouse model is underway in other laboratories. These findings will serve as the control to which findings in diseased tissue can be compared. Furthermore, the antibodies and probes produced for these studies may serve as valuable tools for validating mouse models that may be produced. These mice models will allow for a quantitative analysis of how TAF1 isoforms in specific cells are impacted by XDP, and eventually, they will provide a vehicle for XDP therapies to be tested.
Ondik 32
Chapter 3
Testing C-TAF1 and N-TAF1 antibodies in human tissue
3.1 Introduction
In this work, antibodies raised against C-TAF1 and N-TAF1 were tested via Western blot and single immunoperoxidase histochemical labeling (IHC) in human tissue. Furthermore, like in mouse, singleplex BaseScopeTM probes have been produced against human N-TAF1 and C-TAF1 nucleotide sequences. In producing probes
Figure 3.1 Species-specific sequences of C-TAF1 and N-TAF1 mRNA and protein. A)
C-TAF1 (blue) and N-TAF1 (red) BaseScopeTM probes were produced to target the nucleotides—beneath each bar—that correspond with the human C-TAF1 and N-TAF1 mRNA sequences. B) The peptide sequence against which Monoclonal C-TAF1
antibody #177-4, derived from rabbit, Timm1-2, and polyclonal N-TAF1 antisera from rabbit, Timm2-3, were raised is conserved across mouse, rat, and human. Exon 34’ (gctaag)) encodes the amino acids A (alanine) and lysine (K), shown in bold.
Ondik 33
and testing TAF1 antibodies, this work was devoted to discovering, if possible, the optimal conditions for target specific labeling with the polyclonal N-TAF1 antisera, Timm2-3, and the monoclonal C-TAF1 antibody, #177-4, in human tissue.
There are a few distinctions between human and mouse, which were necessary to consider when applying antibodies used in mouse to human tissue. Unlike mouse striatum, which is a combination of caudate nucleus and putamen, human basal ganglia (BG) contains distinct caudate nucleus and putamen, which are separated by the white matter known as the internal capsule. Although the anterior BG organization differs between in human compared to mouse, the caudate nucleus and putamen are both composed of striosomal and matrix sub-compartments in both species. As such, these are the compartments that were scanned for C-TAF1 and N-TAF1 labeling in the
experiments presented here.
3.2 Methods
All experiments and trials in human tissue and human brain homogenates were
conducted at the University of Auckland’s Centre for Brain Research in the laboratory of Prof. Richard Faull.
3.2.1 Tissue acquisition and fixation
Brains donated to the Neurological Foundation of New Zealand Human Brain Bank were perfused with 1% sodium nitrite in PBS, pH 7.4, for 15 minutes followed by 15% formalin in 0.1M phosphate buffer (fixative) for 40 minutes. Brains were post-fixed in fixative for 24 hours then dissected into blocks of anatomical interest. These blocks
Ondik 34
were immersed in fixative for another 24 hours, incubated in 20% sucrose solution for a 2 day minimum, and then incubated in 30% sucrose solution for another 2-3 weeks. Anatomical blocks were snap-frozen, wrapped in tinfoil, labeled, and stored at -80°C.
3.2.2 Western blot
~0.2g of normal human brain, case H146, was homogenized in SHB and of Alzheimer’s disease brain, case AZ114, was homogenized in TT and RIPA buffer. Mouse
homogenates were used as a positive control (section 2.2.3). Western blot was performed as described in section 2.2.4.
3.2.3 Immunohistochemical labeling
Two series of IHC experiments were performed using C-TAF1 and N-TAF1 primary antibodies. In the first series of experiments, sections were not treated with antigen retrieval and primary antibodies were tested at antibody concentrations of 1:500,
1:1,000, 1:5,000, 1:10,000,1:20,000, and 1% normal goat serum in PBS (NGS) to serve as a control. In the second series of experiments, sections were treated in a series of antigen retrieval methods then stained with primary antibodies at concentrations of 1:2,000, 1:10,000, and NGS to serve as a control.
Free-floating anterior striatum tissue sectioned at 70 µm from three human cases , H242R, H243R, and H230R, was transferred from storage in PBS-azide to 0.2% Triton-X in PBS (PBS-T) filled wells. After a ten minute rinse, they were transferred to fresh PBS-T or their respective antigen retrieval buffer and left overnight on a shaker at 4°C. Next, sections were rinsed in fresh PBS-T for 15 minutes. For antigen retrieval
Ondik 35
trials, sections were treated with citric acid (pH 4.6) and heat, citric acid (pH 6.0) and heat, formic acid for 5 minutes, or tris-EDTA (pH 9.0) and heat followed by three ten minute rinses in PBS-T. Heating was performed in the microwave for 30 seconds. Next, sections were incubated in a 50% methanol, 49% Milli-Q water, and 1% H2O2
blocking solution for 20 minutes, rinsed three times for ten minutes in PBS-T, and incubated for three night in primary antibody diluted in NGS.
Sections were rinsed three times for ten minutes in PBS-T and incubated in biotinylated secondary antibody in 1% NGS overnight. After three ten minute rinses in PBS-T, sections were incubated in Extravidin peroxidase (Sigma E2886, 1:1,000) for four hours, taken through three ten minute rinses in PBS-T, and incubated in a [3,
3’-diaminobenzidine] (DAB) and H2O2 solution for twenty minutes. Stained sections
underwent three ten minute rinses in PBS-T. Then, using gelatin solution, they were mounted onto glass slides and allowed to dry (minimum of 10 days). Dried sections were dehydrated through a graded alcohol series and three twenty minute incubations in xylene. Dehydrated slides were cover-slipped with DPX mounting media and left to dry for approximately one month before imaging via a bright field microscope (Leica Biosystems Imaging, Inc.).
3.3 Results
The control mouse model used in IF Western blot is described in Table 2.1 while human cases used in IF Western blot and IHC are described in sections 3.2.2 and 3.2.3.
Ondik 36
In IF Western blot of human Alzheimer’s tissue, C-TAF1 signal was observed at the expected 250 kDa band in brain tissue sample from Alzheimer’s disease brain case, AZ114, homogenized in RIPA buffer (Fig. 3.2A). Clear C-TAF1 signal was also
Figure 3.2 Serial dilution of
C-TAF1 in IF Western blot of human brain
homogenates. Membranes were stained with C-TAF1 (red) at concentrations (A) 1:1,000, (B) 1:5,000 and (C) no C-TAF1 primary antibody, negative control. β-actin (green) serves here as a housekeeping control. observed in the positive (mouse tissue sample) control at the 1:1,000 and 1:5,000 antibody concentrations (Fig. 3.2A; Fig. 3.2B). C-TAF1 signal with low background was only observed in human tissue at an antibody concentration of 1:1,000 and was not observed in tissue homogenized with TT buffer or stained with antibody at 1:5,000 (Fig. 3.2B) nor was C-TAF1 signal observed in the negative (no primary antibody) control (Fig.3.2C). The N-TAF1 antisera did not produce signal in either positive (mouse tissue sample) control or human tissue. This is true for all samples homogenized in RIPA, TT, or sucrose homogenization buffer and stained with N-TAF1 antibody at a concentration of 1:3,000 (Fig. 3.3A) or 1:10,000 (Fig. 3.3B).
Ondik 37
Figure 3.3 Serial dilution of N-TAF1 in IF
Western blot of human brain
homogenates. The AZ114 RIPA lane in the left membrane contains 25µg and in the right membrane contains 2.5µg. Samples were stained with N-TAF1 (red) two different antibody concentrations (left side of ladder and right side of ladder). β-actin (green) serves here as a
housekeeping protein control. Specific antibody concentrations are given at the bottom of both membranes.
3.2 Immunohistochemical labeling of C-TAF1 and N-TAF1 in free-floating sections of human anterior striatum
In untreated sections stained with a range of antibody concentrations, 1:500 – 1:20,000, neither C-TAF1 nor N-TAF1 signal was observed (data not shown). Minimal
background in sections stained at 1:5,000 and 1:10,000 and the optimal concentration for use of C-TAF1 and N-TAF1 in mouse IF guided the decision to then use
concentrations, 1:2,000 and 1:10,000, in IHC staining with antigen retrieval. All antigen retrieval treated human sections immuno-labeled with C-TAF1 or N-TAF1 from normal cases H243R and H230R had overall darker background than from normal case H242R. There was no observable stain or background in sections treated with citric acid pH 4.6 plus heat and only slight observable background in sections treated with
RbαN-TAF1 1:3,000 mSαβ-ACTIN 1:1,000
RbαN-TAF1 1:10,000 mSαβ-ACTIN 1:1,000
Ondik 38
citric acid pH 6.0 plus heat. There was heavy observable background in all sections from all cases treated with 50% formic acid and moderate background in all sections from all cases treated with tris-EDTA pH 9.0 plus heat. For C-TAF1 stained sections, no signal was observed in any sections under any of the concentrations or antigen retrieval conditions. The N-TAF1 antibody provided signal in both the nucleus and
Figure 3.4 Immunohistochemical labeling of human N-TAF1 in anterior caudate
nucleus. Free floating sections from normal case A) H230R and B) H243R were labeled with N-TAF1 antisera diluted in 1% NGS at a 1:2,000 concentration.
Ondik 39
cytoplasm of cells under one antigen retrieval method and concentration only, tris-EDTA of pH 9.0 and 1:2,000, in the striatum of the right hemisphere from both normal human cases H230 (Fig. 3.4A) and H243 (Fig. 3.4B).
3.4 Discussion
Isoform specific antibodies have been used in IHC experiments to study the striatal sub-compartment and localization of N-TAF1 in specific cell types of mouse and rat tissue, but not yet in human tissue (Chapter 2; 22). However, it is possible that the antibodies produced against C-TAF1 and N-TAF1, which have shown target specific reactivity in mouse tissue, could also be reactive in human tissue. The N-TAF1 antisera produced for use in mouse and rat studies, which warranted isoform specific signal in each of the intended species, were raised against an identical peptide fragment. This was possible because the N-TAF1 sequence is highly conserved between mouse and rat. In fact, both the C-TAF1 and N-TAF1 isoform sequences are highly conserved, not only between mouse and rat, but also in human (Fig. 3.1).
Here, C-TAF1 was shown to produce signal at the 250 kDa band in Western blot. This signal had medium intensity, was consistent with the molecular weight of C-TAF1, and was accompanied by low background indicating it was true and specific signal. Under these conditions, neither true nor specific signal was observed in tissue samples labeled with N-TAF1 antisera. Due to N-TAF1 specific signal observed in chemi-luminescent Western blot in human HeLa cells overexpressing C-TAF1 and N-TAF1, as shown by the Marc Timmers group, this was unexpected. There are multiple possible
Ondik 40
that the N-TAF1 does not work in human tissue via Western blot as is true for certain antibodies. Two alternative possibilities are that the antibody did not survive transport and has denatured, or the optimal buffer, Western blot membrane type and antibody concentration combination has not yet been identified. It will be beneficial to test these possibilities in the positive control, mouse brain homogenate, to quickly determine which conditions are best to achieve specific signal and then, apply them to human tissue. Western blot labeling with N-TAF1 did not produce true and specific signal in any of the tissue samples at any antibody concentration. Despite the absence of specific signal, an optimistic eye can see feint bands in the 250kDa region in the mouse 98 RIPA buffer sample and the H146 sucrose homogenization buffer sample at a concentration of 1:3,000. These bands do not show brighter intensity than some other background. However, unlike other background, they are confined to their lanes and do not streak across the entire membrane. Repeating this experiment with higher antibody
concentrations has the potential to produce true and specific N-TAF1 signal in IF Western blot of human brain homogenates.
In IHC labeling with C-TAF1 and N-TAF1, potentially specific signal was observed only with N-TAF1 under a single antigen retrieval method and antibody concentration. This signal could be N-TAF1 specific, but it appears that extra-nuclear background is stained with comparable intensity to the nuclei of cells. N-TAF1, thus far, has been known to localize to the nucleus, which suggests the signal is non-specific. Furthermore, the pH of 9 used to obtain this signal is undesirably high for it may have interfered with the N-TAF1 antisera’s antigen affinity thus resulting in non-specific signal. True and specific
Ondik 41
signal is reproducible at a range of antibody concentrations with signal increasing in intensity at a concentration dependent manner, which was not observed here.
A major difference between mouse and human work that may have contributed to lack of C-TAF1 and definite N-TAF1 signal in human is the set of techniques used to prepare and perform IHC in human tissue sections. Brains were fixed using formalin solution instead of PFA. Then human tissue was incubated in sucrose solution, instead of glycerol solution, for weeks, versus one hour, then snap-frozen and stored at -80°C, versus storage in glycerol solution at 4°C, until sectioning at 70 µm, instead of 30 µm as was done in mouse. Human specific protocols could have prevented signal by IHC. Thickness of the human tissue, for example, may have interfered with antibody penetration and thwarted TAF1 labeling. Perhaps sectioning human tissue thinner could mediate this possibility. Additionally, the antigen retrieval methods used so far may not have been basic enough to properly expose the N-TAF1 protein. Increasing the pH of the antigen retrieval buffer could yield signal not yet observed. However, increasing pH could also create artifacts or destroy tissue organization, further thwarting antibody-antigen binding and N-TAF1 detection. Other possibilities may include using a PFA fixative or testing antibodies in paraffin embedded sections. With these
possibilities remaining, further experiments are needed to determine whether or not C-TAF1 and N-C-TAF1 are compatible with IHC protocols in human tissue.
The results described here serve as a foundation for studying the cell-specific
localization of TAF1 isoforms in human tissue, which is currently being done in mouse and has been done in rat. C -TAF1 and N-TAF1 are only two of multiple protein
Ondik 42
isoforms transcribed from the TATA-binding protein-associated transcription factor-1 gene, TAF, but studying them and how their expression is changed in X-linked dystonia-parkinsonism could produce important results for the young field of XDP research.
Ondik 43
Chapter 4
Concluding remarks
4.1 Major observations and interpretation of complete set of results
Here, BaseScope™ probes and monoclonal and polyclonal antibodies have been produced to differentiate between mRNA and proteins that differ only by two codons or amino acids. The C-TAF1 and N-TAF1 BaseScopeTM probes showed target specific signal via in situ hybridization in mouse, and the monoclonal C-TAF1 antibody and polyclonal N-TAF1 antisera showed the same patterns in IF and IHC labeling of mouse tissue. The C-TAF1 antibody was also successful in detecting a single band, of the predicted 250 kDa size, by IF Western blot of mouse and human brain homogenates. Using these antibodies and probes, the canonical and neuron-specific localization of C-TAF1 and N-C-TAF1 has been verified via immunohistochemical labeling and qPCR (quantitative polymerase chain reaction) in mouse tissue.
I observed that C-TAF1 is abundantly expressed in both DRD1- and DRD2-positive MSNs across the striosomal and matrix sub-compartments of the mouse striatum, as well as in cells of the CC and SVZ. N-TAF1 signal was observed to be abundant across the striatal neurons in both the striosomal and matrix sub-compartments of mouse brain, and, in co-localization experiments, N-TAF1 was found to be sparsely expressed by PV-positiveinterneurons. C-TAF1 signal was also observed PV-positive as well as SOM-positive interneurons, in GFAP-SOM-positive astrocytes, and Ki-67-SOM-positiveproliferating cells of the SVZ (possibly neuronal progenitor cells). The non-neuronal mouse tissues
Ondik 44
examined, heart and liver of mouse, were also positive for C-TAF1 IHC. Furthermore, members of Prof. Ann Graybiel’s lab observed signal from the polyclonal N-TAF1 antisera and an nSR100 specific antibody in neurons of mouse brain. This observation provides support of neuron-specific localization of both N-TAF1 and nSR100, and thus the involvement of nSR100 in the regulation of N-TAF1 splicing.
The sub-compartmental distribution of N-TAF1 observed here in mouse striatum differs from the enrichment observed in rat. It is possible that N-TAF1 is striosome-enriched in rat but not in mouse. Alternatively, the two N-TAF1 immuno-labels are independently produced antisera that may differ in specificity and/or background. Considering both this difference and variation in tissue preparation methods that may have influenced target binding affinity of both antisera, I conclude that the observations in mouse do not disclaim the striosome-enrichment of N-TAF1 in rat tissue. Moreover, this result is a reminder that differences exist across species, and that it is important to be aware and consider the possibility of these differences (22).
Furthermore, the polyclonal N-TAF1 antisera have shown cellular but not nuclear signal by IHC in human striatum, which may or may not be specific to the N-TAF1 protein. The extra-nuclear signal that was observed in mouse and human contradicts what is known about the localization of N-TAF1, i.e. it localizes in the nucleus of cells. This may indicate that the observed signal is not specific, however, it is also possible that true signal was observed that indicates N-TAF1 does not solely localize in the nucleus. Performing experiments that reduce non-specific signal, such as has been observed with antigen retrieval, could help deduce which of the above is true. This is because antigen retrieval has the potential to destroy non-specific antigen epitopes and unmasks
Ondik 45
true antigen epitopes allowing true binding to out-compete non-specific binding.
Preliminary tests of N-TAF1 immuno-labeling in human require follow-up experiments such as various antigen retrieval methods to optimize the IHC conditions and probe the nature of extra-nuclear signal observed in N-TAF1 immuno-staining.
In IF Western blot neither mouse nor human brain homogenates were successfully labeled with the polyclonal N-TAF1 antisera. The Timmers laboratory showed N-TAF1 label in Western blot of a human cell culture line, but that was under conditions of over-expression that maximize immuno-detection. Further WB optimization is necessary to draw any conclusions about its reactivity for endogenous human N-TAF1.
The specificity of the N-TAF1 antisera must be confirmed and is a top priority.
Validating the signal observed with the N-TAF1 antisera would allow for the complete set of cell-specific experiments performed with C-TAF1 to be repeated with N-TAF1. In response to this question of validity, members of the Marc Timmers laboratory are working to produce a monoclonal N-TAF1 antibody that may validate the specificity of the polyclonal N-TAF1 antisera by reproducing identical signal or serve as an effective alternative. Once an N-TAF1 specific antibody has been validated, a complete analysis of N-TAF1 expression in GFAP, SOM, PV, Ki-67, DRD1, and DRD2 labeled cells can be performed.
These findings with other observations in XDP research serve as a basis for a hypothesis that C-TAF1 and TAF1 have unique functions and misregulation of N-TAF1 in particular is capable of causing neuron-specific death. In mouse embryos, the onset of and level of expression of C-TAF1 and N-TAF1 differ (11). In humans,
Ondik 46
mutations in C-TAF1 protein result in symptoms including dysmorphic facial features and intellectual impairment consistent with canonical effects (19). Mutations that instead cause downregulation of N-TAF1 and decreased inclusion of exons downstream intron 32 result in motor defects consistent with disruption to proper neuron function (1). In all, my results show that C-TAF1 is constitutively expressed in all cell types whereas N-TAF1 is detected in neurons. I hypothesize that C-TAF1 promotes transcription important for all cell types, as has been observed for general TAF1 (Wassarman and Sauer et al., 2001), while N-TAF1 promotes neuron specific transcription in neurons. Thus, N-TAF1 could be important specifically for proper neuronal function and survival, and its downregulation in XDP could be the cause of neurodegeneration of the caudate nucleus and putamen. My results with the reagents described here serve as an
important basis for a broad range of experiments to be conducted in the field of XDP research.
4.2 Prospective work and larger implications
4.2.1 Results in mouse are relevant to XDP mouse models under development and to testing of future XDP therapies
This work represents the first steps towards using isoform specific bio-labeling tools to support the development and to test the efficacy of new XDP materials, models and therapies as they are developed. Cell-specific characterization of C-TAF1 and N-TAF1 will continue in various cell types in mouse making possible the study of isoform-specific changes in various XDP mouse models that are currently being developed in other laboratories. Genetic modifications embodied by XDP models may include an SVA
Ondik 47
insertion at the site observed in an XDP afflicted genome. Another important
modification would be an insertion of the entire DYT3 haplotype or yet another would be a deletion of microexon 34’. Observed changes or lack thereof in C-TAF1 and N-TAF1 expression in these examples of XDP mouse models would shed light on the
importance of the SVA insertion versus the other six mutations observed in the DYT3 haplotype and the role of N-TAF1 in motor function.
Current therapies for XDP include multi-annual Botox regimens and deep brain
stimulation to treat dystonic symptoms followed by oral dopamine-replacement therapy (levodopa) to treat parkinsonian symptoms. In continuing to explore the functions of C-TAF1 and N-C-TAF1 and other C-TAF1 isoforms for that matter, unique isoform specific functions, if they exist, will inform the development, testing, and scrutiny of new XDP therapies. For example, would gene therapy to delete the SVA insertion by
CRISPR/Cas9 be a viable therapy for XDP? Once potential XDP therapies come into fruition, their effects on C-TAF1 and N-TAF1 expression in XDP and XDP models may be monitored and analyzed via the isoform specific antibodies and quantitative probes described here.
4.2.2 Reproducing observation of preferential degeneration of striosomes in XDP
Currently, a collaborative effort is underway between the Faull laboratory and the
Neurological Foundation of New Zealand, Massachusetts General Hospital (MGH), and the Sunshine Care Foundation’s support of the Roxas City clinic and the Makati Medical Centre in Manila, Philippines. In this effort, diseased XDP brains are being provided to the Auckland Brain Bank. In previous work, diseased XDP tissue was labeled with