HAL Id: hal-00304749
https://hal.archives-ouvertes.fr/hal-00304749
Submitted on 1 Jan 2002HAL is a multi-disciplinary open access archive for the deposit and dissemination of sci-entific research documents, whether they are pub-lished or not. The documents may come from teaching and research institutions in France or abroad, or from public or private research centers.
L’archive ouverte pluridisciplinaire HAL, est destinée au dépôt et à la diffusion de documents scientifiques de niveau recherche, publiés ou non, émanant des établissements d’enseignement et de recherche français ou étrangers, des laboratoires publics ou privés.
small Mediterranean forested catchment
Susana Bernal, Andrea Butturini, Francesc Sabater
To cite this version:
Susana Bernal, Andrea Butturini, Francesc Sabater. Variability of DOC and nitrate responses to storms in a small Mediterranean forested catchment. Hydrology and Earth System Sciences Discus-sions, European Geosciences Union, 2002, 6 (6), pp.1031-1041. �hal-00304749�
Variability of DOC and nitrate responses to storms in a small
Mediterranean forested catchment
Susana Bernal, Andrea Butturini and Francesc Sabater
Department d´ Ecologia, Facultat de Biologia, Universitat de Barcelona.Diagonal 645, 08028 Barcelona, Spain Email for corresponding author: [email protected]
Abstract
Severe drought periods followed by intense rainfall often leads to major floods in Mediterranean catchments. The resulting hydrology is complex and the response of solutes in the streams is often unpredictable. This study aimed to identify the most relevant factors controlling the hydrological responses to storms of an intermittent Mediterranean stream and to link those factors with dissolved organic carbon (DOC) and nitrate during storm events. Measurements of climate, hydrology, DOC and nitrate concentrations during 26 storm events over three hydrological years were analysed. The contribution of the storm events to the total DOC and nitrate annual export was also calculated. Nitrate was mainly mobilised during high flow, while most of the DOC export occurred during baseflow. Solute concentrations peaked after drought periods and the solute export was maximal during the largest rainfalls (i.e.>100 L m-2). One single large storm contributed some 22%
of the total annual export of DOC, and about 80% of that of nitrate. Discharge was a good predictor of neither DOC nor nitrate responses, so variables other than discharge were considered. Factor Analysis was used to identify the main factors controlling the biogeochemical responses. Antecedent moisture conditions and the magnitude of the storm event were the most relevant factors and accounted for 63% of the total variance. Solute responses during high flow were highly variable. However, solute concentration changes showed a significant and moderate relationship with the factors controlling the hydrological responses (i.e. ∆ DOC v. the antecedent moisture conditions and ∆ NO3-N v. the
magnitude of the storm event).
Keywords: dissolved organic carbon, nitrate, Mediterranean, drought, Fuirosos catchment, storms
Introduction
Studies in small forested catchments in both Mediterranean and humid regions have shown abrupt streamwater chemistry changes during storm events (see Meyer et al., 1988 for a thorough review, Mulholland et al., 1990; Ávila
et al., 1992; Arheimer et al., 1996; Brown et al., 1999; Biron et al., 1999; Hagedorn et al., 2000; Butturini and Sabater,
2000). These short-term variations may be of major importance when solute output fluxes from a catchment have to be estimated because solute concentrations do not vary linearly with discharge (Arheimer et al., 1996). Changes in concentration of DOC and nitrate are often erratic and depend on the intensity of rainfall and on antecedent soil moisture conditions (Ávila et al., 1992; Britton et al., 1993; Brown et al., 1999; Biron et al., 1999), catchment characteristics (i.e. soil type, land use, altitude, topography) and seasonality of biological processes (Arheimer et al., 1996).
Knowledge of the processes affecting solute concentration
changes during storms is important for understanding both short and long term variations in solute cycling in catchments and for accurate modelling of solute mass-balances. Dissolved organic carbon (DOC) and nitrogen are two of the most studied nutrients in biogeochemistry. DOC is a primary component in the organic energy budget of running waters (Mulholland, 1981; Schlesinger, 2001). The flushing of interstitial and soil water DOC into the stream channel during high flow is presumably one of the main surges in DOC (Allan, 1995). In Mediterranean forested catchments, in particular, soils are poorly developed (Serrasolses et al., 1999). This might limit DOC inputs into the stream channel and consequently, DOC dynamics might be erratic. In its turn, nitrogen usually limits vegetation growth in arid and semi-arid regions (Terrades, 2001). Nitrate is the most abundant and mobile form of nitrogen within stream waters (Schlesinger, 2001) and is a limiting nutrient in pristine streams in Mediterranean (Martí and Sabater, 1996) and arid regions (Grimm and Fisher, 1986).
Studies of solute responses during storms have generally been based on a limited number of events (Britton et al., 1993; Hagedorn et al., 2000) or at different times in the hydrological cycle (Brown et al., 1999; Ribolzi et al., 2000). These studies involve a detailed description of the solute dynamics during stormflow and in the separation of the hydrograph components. Also, the within-year variability in the response of solute concentrations to storms has been examined and a positive relationship has been established between DOC concentration and discharge (Meyer et al., 1988; Brown et al., 1999; Butturini and Sabater, 2000) and a large variability in the relationship between nitrate concentrations and discharge has been observed, both among and within catchments (Meyer et al. 1988; Arheimer et al., 1996; Hagedorn et al., 2000; Butturini and Sabater, 2002; Ávila et al., 1992). However, the potential seasonality of solute short-term variations induced by storms has not been studied widely. Futhermore, several studies have suggested a relationship between the antecedent moisture conditions and changes in DOC concentration during storms (Brown
et al., 1999; Biron et al., 1999). Butturini and Sabater (2000),
for example, reported a seasonality of DOC concentrations during storms not related to the duration of the inter-storm period. On the other hand, several authors have noted that the largest changes in nitrate concentration were induced by storms following warm (Roberts et al., 1984) or dry periods (Ávila et al., 1992; Biron et al., 1999).
In this study, factorial analysis is used to separate the different influences of biogeochemical processes and the hydrological cycle on the response of solutes in Fuirosos, a small Mediterranean catchment. This multivariate analysis method has been applied in other hydrogeochemical studies (Reid et al., 1981; Williams et al. 1983; Davies et al. 1993, Evans et al. 1996). The aims of this study were to identify the most relevant factors controlling the hydrological responses of a small intermittent Mediterranean stream during storms and to find general links between those factors and DOC and nitrate concentrations, particularly during storm events. This was undertaken to gain understanding of the variability of DOC and nitrate concentrations during storms in Mediterranean catchments subjected to severe summer drought.
Site description of the Fuirosos
catchment
Fuirosos is an intermittent third order stream located in a forested catchment (16.2 km2) near Barcelona, in northeastern Spain (latitude 41º 42´N, longitude 2º 34´W; altitude range 50–770 m.a.s.l.). The climate is typically Mediterranean, with temperatures ranging from a monthly
mean of 3º C in January to 24ºC in August. Winter air temperatures below 0ºC are infrequent. Precipitation falls mostly in autumn and spring with only occasional storms in summer and the number of days with rain does not usually exceed 70 per year.
The main rock type in the catchment is granite, except at the head of the valley where phyllites are predominant (Sala, 1983). The catchment is covered mostly by perennial cork oak (Quercus suber) and pines (Pinus halepensis and Pinus
pinaster) (Fig. 1) with one or two layers of shrubs (e.g. Rhamnus alaternus, Viburnum tinus, Arbutus unedo, Prunus spinosa) and lianas (e.g. Smilax aspera, Lonicera implexa).
The moss and the litter layer are not dense and leaves do not decompose easily (Sala, 1983). In the valley head, in a mixed deciduous woodland of chestnut (Castanea sativa), hazel (Corylus avellana), and oak (Quercus pubescens), the moss and the litter layer are better developed, while shrubs and lianas are scarcer. The soils are poorly developed, with an A horizon of less than 5-cm. Soils are dominated by sand and fine sand (46 and 24%, respectively), with smaller amounts of silt and clay (15% each, Sala, 1983).
The traditional land use is periodic harvesting of bark from
Fig. 1. Geographical location of the studied catchment, Fuirosos (Catalonia, Spain). Main land uses (agricultural fields, coniferous forest, oak forest, deciduous forest) in Fuirosos are shown in
mg DOC-C L -1 0 10 20 30 Q (L s -1 ) 0 400 800 1200 26000 26100 Time (months) 9 11 1 3 5 7 9 11 1 3 5 7 9 11 1 3 5 7 mg NO 3 -N L -1 0 1 2 3 4 Q (L s -1 ) 0 400 800 1200 26000 26100 Time (m/yy) 9/98 12/98 3/99 6/99 9/99 12/99 3/00 6/00 9/00 12/00 3/01 6/01 Q (L s -1 ) 0 200 400 600 800 1000 1200 1400 26000 26100 0 20 40 60 80 100 Pre cip ita tion (L m -2 d -1 )
a
b
c
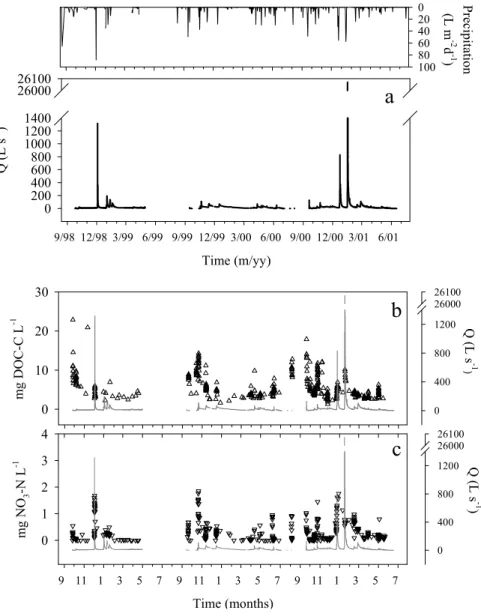
Fig. 2. Temporal dynamics of: (a) discharge (Q, L s-1), and associated daily precipitation (L m-2 d-1), (b)
DOC concentration (mg L-1) and (c) nitrate concentration (mg L-1), in Fuirosos (Catalonia, Spain)
during the study period (September 1998–July 2001).
the cork trees and the partial clearing of pines and shrubs. Agricultural fields occupy less than 10 % of the catchment area. In parts of the catchment, the cork has been replaced by eucalyptus (Eucalyptus sp.). This alien tree species is commonly used for the extraction of cellulose.
The catchment area upstream of the monitoring site is 10.5 km2. The stream channel, 3 to 5 m wide at the monitoring point, is characterised by a steep-pool morphology with large cobbles and boulders. The stream is flanked by a well develop riparian area of 10 to 20 m wide, consisting mainly of alder (Alnus glutinosa) and an exotic species, plane (Platanus acerifolia). The riparian soil is poorly developed and plane leaf litter tends to accumulate over the forest floor because of extremely low decomposition rates (Bernal et al., 2003). The basal
discharge of the stream regime shows a marked seasonal pattern characterised by a long dry period from June to late September–October, when the first autumn storms occur. The average duration of the drought period is 75 ± 5 (± s.e., n=3) days. During the wet period, average water discharge ranges from 7 L s-1 in spring to 25 L s-1 in winter (Fig. 2).
Material and methods
STREAM RUNOFF, PRECIPITATION AND SOIL MOISTURE MONITORING
The stream water level or stage was monitored continuously from September 1, 1998 to July 1, 2001 using a water pressure sensor connected to an automatic sampler (Sigma
900 Max). To estimate stream discharge from measurements of stage, the “slug” chloride addition method (Gordon et
al., 1992) was used to derive an empirical relationship
between the discharge and stage. Precipitation data were recorded continuously at 15-min intervals from the meteorological station commissioned in April 1999 on the study site. Before that time, precipitation data were provided by the Catalan Meteorological Service (SMC) from a meteorological station located at 5 km from the study site. PIMax (Lm–2 h–1) is the highest value of precipitation intensity recorded during a precipitation event; the average precipitation intensity (PIAvg, Lm–2 h–1) is the ratio between the total precipitation of an event (Lm–2) and its duration (Dt, h). Soil moisture content in the catchment area was monitored continuously from December 1998 to June 2001 by time domain reflectometry (TDR). Two probes (Campbell CS615) were placed below the soil surface, one just below the organic horizon (i.e. 5-cm depth) and the other at 15-cm depth. Soil moisture (θ) is expressed as percent of the volumetric water content.
ESTIMATION OF POTENTIAL
EVAPO-TRANSPIRATION (PET) AND SOIL MOISTURE DEFICIT (SMD)
The in situ potential evapotranspiration (PET, L m-2) was calculated on a daily basis from meteorological data using the Penman-Monteith equation (Campbell and Norman, 1998). The soil moisture deficit on a daily basis (SMD of day x, SMDx, L m-2) is, for the xth day:
SMDx = SMDx-1 – Px + AETx if SMDx-1 > Px – AETx SMDx = 0 if SMDx-1 < Px – AETx
where Px is the rainfall observed on day x and AETx is the estimated actual evapotranspiration on day x.
STREAMWATER MONITORING DURING STORM EVENTS AND CHEMICAL ANALYSES
The automatic sampler was programmed to start sampling at an increment in the streamwater level of 2–3 cm. During the rising limb of the hydrograph, samples were collected at intervals of 30–60 minutes; during the recession limb the sampling intervals were 2–5 hours. All water samples were filtered through pre-ashed GF/F fibreglass filters and cold-stored for subsequent analysis. DOC samples were analysed using a high-temperature catalytic oxidation (Shimadzu TOC analyser). Nitrate in samples was analysed colorimetrically with a Technicon AutoanalyserÒ (Technicon, 1976) using the Griess-Ilosvay method (Keeney
and Nelson, 1982) after reduction by percolation on a copper doped cadmium column.
STATISTICAL ANALYSES
Factor analysis classified the climatic and hydrological data of 26 storm events monitored during three hydrological years (1998–2001). This method reduces the complexity of a large dataset by assuming that a linear relationship exists among the set of variables and a smaller number of underlying ‘factors’. Factors, which are uncorrelated with each other, are obtained through an eigenvalue analysis of the correlation matrix of the set of variables (Davis, 1973; Evans
et al., 1996). Each factor explains a percentage of the
variance of the full dataset and, usually, the first few factors explain the bulk of the total variance, so the remaining factors can be excluded from the analysis, although this implies some loss of the information in the full dataset. Here, only those factors explaining at least as much of the total variance as one of the original variables have been considered. The factors selected were then ‘rotated’ using the Varimax method (Johnston, 1978). The rotated factors explain exactly the same amount of covariance among the descriptors as the initial factors, but certain factor loadings are maximised while others are minimised (Legendre and Legendre, 1998, pp 478). In the present study, the variables included in the Factorial Analysis (Table 1) were the amount of rainfall (Rain) and the duration of the rainfall events (Dt), the maximum rainfall intensity (PIMax) and the average rainfall intensity (PIAvg), the stream peakflow value minus the baseflow prior to the storm event (∆Q); the mean soil moisture (θAvg), the mean potential evapotranspiration (PETAvg) and the mean soil moisture deficit (SMDAvg). Means are for periods between storm events. SMDAvg is the mean soil moisture deficit calculated for the five days before each storm (or less, if two storms were less than five days apart). DOC and NO3-N stream fluxes were calculated both at baseflow and during storm conditions. During baseflow conditions, the daily solute fluxes were calculated by multiplying the mean daily discharges by the instantaneous solute concentrations. During storm flow, solute fluxes were estimated by integrating the instantaneous concentrations by the instantaneous discharges. Continuous solute concentrations were estimated by linear interpolation of measured solute concentrations (Hinton et al., 1997). The end of each storm period was marked by a rate of discharge change lower than 10 % d-1. The change in solute concentrations (∆ DOC (mg L-1) and ∆ NO
3-N (mg L-1)) during storms was defined as the difference between peak values measured during the event and the solute concentration in streamwater immediately before the event.
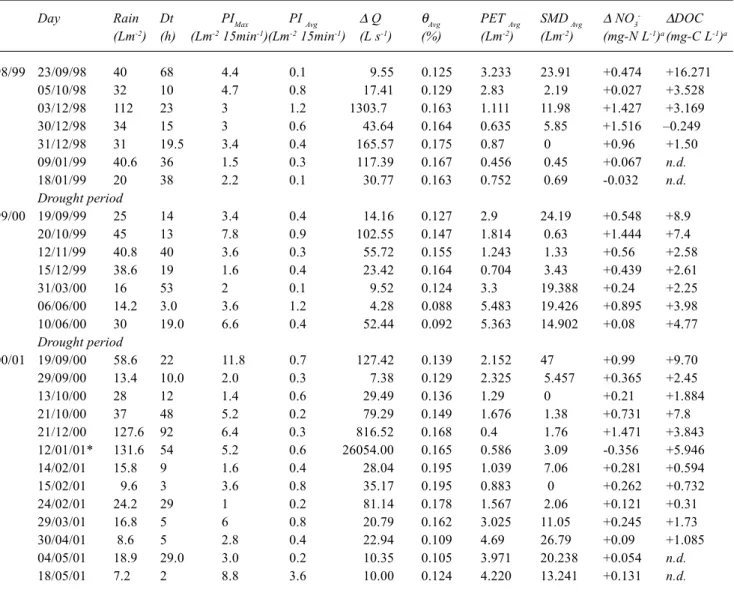
Table 1. Precipitation amount (Rain), rainfall duration (Dt), rain maximum intensity (PIMax), rain average intensity (PIAvg), soil moisture average (θAvg), potential evapotranspiration average (PETAvg) and soil moisture deficit average (SMDAvg), in the small forested catchment of Fuirosos (Catalonia, Spain). Also shown are the magnitude of the flow change (∆ Q) and changes in NO3-Nand DOC concentrations in streamwater during the indicated storm events in the intermittent Fuirosos stream. n.d. no data available. a Positive values indicate that the solute concentration has increased during the storm and
negative values indicate that the solute concentration has decreased.
Day Rain Dt PIMax PI Avg ∆ Q θAvg PET Avg SMD Avg ∆ NO3- ∆DOC
(Lm-2) (h) (Lm-2 15min-1)(Lm-2 15min-1) (L s-1) (%) (Lm-2) (Lm-2) (mg-N L-1)a(mg-C L-1)a 98/99 23/09/98 40 68 4.4 0.1 9.55 0.125 3.233 23.91 +0.474 +16.271 05/10/98 32 10 4.7 0.8 17.41 0.129 2.83 2.19 +0.027 +3.528 03/12/98 112 23 3 1.2 1303.7 0.163 1.111 11.98 +1.427 +3.169 30/12/98 34 15 3 0.6 43.64 0.164 0.635 5.85 +1.516 –0.249 31/12/98 31 19.5 3.4 0.4 165.57 0.175 0.87 0 +0.96 +1.50 09/01/99 40.6 36 1.5 0.3 117.39 0.167 0.456 0.45 +0.067 n.d. 18/01/99 20 38 2.2 0.1 30.77 0.163 0.752 0.69 -0.032 n.d. Drought period 99/00 19/09/99 25 14 3.4 0.4 14.16 0.127 2.9 24.19 +0.548 +8.9 20/10/99 45 13 7.8 0.9 102.55 0.147 1.814 0.63 +1.444 +7.4 12/11/99 40.8 40 3.6 0.3 55.72 0.155 1.243 1.33 +0.56 +2.58 15/12/99 38.6 19 1.6 0.4 23.42 0.164 0.704 3.43 +0.439 +2.61 31/03/00 16 53 2 0.1 9.52 0.124 3.3 19.388 +0.24 +2.25 06/06/00 14.2 3.0 3.6 1.2 4.28 0.088 5.483 19.426 +0.895 +3.98 10/06/00 30 19.0 6.6 0.4 52.44 0.092 5.363 14.902 +0.08 +4.77 Drought period 00/01 19/09/00 58.6 22 11.8 0.7 127.42 0.139 2.152 47 +0.99 +9.70 29/09/00 13.4 10.0 2.0 0.3 7.38 0.129 2.325 5.457 +0.365 +2.45 13/10/00 28 12 1.4 0.6 29.49 0.136 1.29 0 +0.21 +1.884 21/10/00 37 48 5.2 0.2 79.29 0.149 1.676 1.38 +0.731 +7.8 21/12/00 127.6 92 6.4 0.3 816.52 0.168 0.4 1.76 +1.471 +3.843 12/01/01* 131.6 54 5.2 0.6 26054.00 0.165 0.586 3.09 -0.356 +5.946 14/02/01 15.8 9 1.6 0.4 28.04 0.195 1.039 7.06 +0.281 +0.594 15/02/01 9.6 3 3.6 0.8 35.17 0.195 0.883 0 +0.262 +0.732 24/02/01 24.2 29 1 0.2 81.14 0.178 1.567 2.06 +0.121 +0.31 29/03/01 16.8 5 6 0.8 20.79 0.162 3.025 11.05 +0.245 +1.73 30/04/01 8.6 5 2.8 0.4 22.94 0.109 4.69 26.79 +0.09 +1.085 04/05/01 18.9 29.0 3.0 0.2 10.35 0.105 3.971 20.238 +0.054 n.d. 18/05/01 7.2 2 8.8 3.6 10.00 0.124 4.220 13.241 +0.131 n.d.
* Cases not included in the Factorial Analysis.
Solute concentration during storm flow was regressed against discharge. The analyses were performed with logarithmic transformation of flow, since the concentration-discharge relationship rarely changes linearly over time (Arheimer et al., 1996). Changes in solute concentrations were also regressed against variables included in the Factor Analysis and against each factor extracted after the Varimax rotation. A multiple regression analysis was performed between the factors extracted, which are independent of each other, and one dependent variable (i.e. DOC or NO3-N
concentration change). Regression techniques are empirical and, therefore, any statistically significant relationship does not imply causality.
Results
PRECIPITATION AND CATCHMENT RUNOFF
Annual precipitation during the three hydrological years monitored (1998–2001) averaged 613 L m–2 yr–1. Precipitation occurred 2.5% of the time and rain intensities
ranged between 0.02 and 1.45 L m–2 min–1. The highest values of PIMax were recorded in September 1999 (1.29 L m–2 min–1) and September 2000 (0.78 and 1.45 L m–2min–1). During the study period, 66 precipitation events were recorded (spring (24), summer (12), autumn (15) and winter (15)) with rainfall levels between 5 and 131.6 L m–2. Precipitation events were generally < 65 L m-2, except for three cases, when precipitation exceeded 100 L m-2. On 50% of occasions, total precipitation was less than 15 L m–2 (Table 2). Twenty-six storm events were selected for this study, for which complete climatic, hydrological and chemical data were available.
Stream discharge was low during the dry period, from the end of May each year and the channel was completely dry from July to September, until the first autumn rains in late September. During baseflow conditions, discharge ranged between 0.1 L s–1 in autumn to 25 L s–1 in winter. Rainfalls of between 5 and 65 L m–2 induced peak discharges between 4.3 L s–1 and 200 L s–1. The rainiest episodes (i.e. > 100 L m–2) produced the highest peak discharges, i.e. December 1998 (Rain =112 L m–2, Q peak = 1315 L s–1), December 2000 (Rain = 128 L m–2, Q peak = 829 L s–1) and January 2001 (Rain = 132 L m–2, Q peak = 26000 L s–1) (Fig. 2). The relative contribution of storm flow to the total annual water flux during the three hydrological cycles studied was 41% in 1998/1999, 35.5% in 1999/2000, and 72.5% during 2000/2001. The larger contribution of storm flows in 2000/ 2001 resulted from the large peak flow in January 2001. Further information about the hydrological regime of Fuirosos stream can be found in Butturini et al. (2002). FACTORS CONTROLLING THE HYDROLOGICAL RESPONSES DURING THE STORM EVENTS
The results of the factor analysis after Varimax rotation for the 26 selected storm cases are shown in Table 3. For the
purpose of interpretation, a ‘high’ loading was defined as greater than 0.75, and a ‘moderate’ loading as 0.40 to 0.75. The categories are arbitrary, although Puckett and Bricker (1992) and Evans et al. (1996) used the same classification. Factors 1 and 2 explained 38.2% and 25.2% respectively of the total variance; together they account for 63.4 % of the total variance (Fig. 3). In Factor 1, both PETAvg and SMDAvg were inversely related to soil moisture (θAvg) and consequently Factor 1 may be regarded as representing the moisture conditions prior to the storm event; the storm cases
Table 2. Precipitation events in Fuirosos (Catalonia, Spain) during
three hydrological periods (1998–2001) grouped by rainfall level classes. In brackets, occasions in each rainfall class which have been included in analyses.
L m-2 No. of cases 5-15 33 (5) 15-25 15 (7) 25-35 10 (6) 35-45 5 (5) 45-55 1 (0) 55-65 1 (1) >65 3 (2) TOTAL 66 (26)
Table 3. Varimax-rotated factor loadings for the indicated
climatological and hydrological variables in 26 storm events in Fuirosos (Catalonia, Spain) measured during three hydrological years (1998–2001). Loadings in the range 0–0.50 are given in brackets. The total variance in the data set explained by each other (%) is also shown.
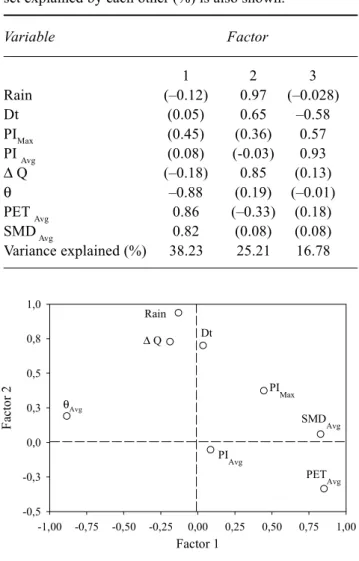
Variable Factor 1 2 3 Rain (–0.12) 0.97 (–0.028) Dt (0.05) 0.65 –0.58 PIMax (0.45) (0.36) 0.57 PI Avg (0.08) (-0.03) 0.93 ∆ Q (–0.18) 0.85 (0.13) θ –0.88 (0.19) (–0.01) PET Avg 0.86 (–0.33) (0.18) SMD Avg 0.82 (0.08) (0.08) Variance explained (%) 38.23 25.21 16.78 Factor 1 -1,00 -0,75 -0,50 -0,25 0,00 0,25 0,50 0,75 1,00 Fa ct or 2 -0,5 -0,3 0,0 0,3 0,5 0,8 1,0 PETAvg SMDAvg PIMax Dt Rain ∆ Q θAvg PIAvg
Fig. 3. Plot of the factor loadings 1 and 2 from the factor analysis for the indicated variables (amount of rainfall (Rain), duration of the rainfall event (Dt), maximum rainfall intensity (PIMax) average rainfall intensity (PIAvg), peak flow value minus the base flow value prior to the storm event (∆Q), mean soil moisture (θAvg), mean
potential evapotranspiration (PETAvg) and mean soil moisture deficit (SMDAvg). Factor 1 is related to the antecedent moisture conditions, Factor 2 is related to the magnitude of the event (see text).
are organised to show a gradient from wet to dry antecedent conditions. The amount of precipitation (Rain), the duration of the event (Dt) and the ∆ Q were variables with high positive loadings, and consequently Factor 2 is interpreted as the magnitude of the storm event. Factor 3 explained 16.7% of the total variance and the variables related to rain intensity (i.e. PIMax and PIAvg) had high positive loadings. In contrast, the duration of the precipitation event showed a moderate negative loading.
ANNUAL DOC EXPORT AND STORM DOC RESPONSES
Annual DOC export was 180.7± 43.8 (standard error) kg-C km–2 yr–1. The contribution of storms ranged from 30 to 60% of the total annual DOC-C export (Table 4). The
three largest storms (i.e. > 100 L m–2) contributed most to the annual DOC-C export (i.e. 22% each), owing to the large volume of water in these storm flows. Stream DOC concentrations during baseflow averaged 3 mg-C L–1 in winter and spring, while in summer and autumn, DOC concentration ranged from 4 to 8 mg-C L–1. The DOC concentration during storm flow increased by 1.1 to 3.5 times pre-storm DOC concentrations. The most pronounced concentration changes in DOC concentration occurred during high flow following droughts (Table 1). The variability in DOC concentration explained by the logarithm of discharge during high flow generated by rainfall up to 65 L m-2 was not significant (r2=0.004, d.f.= 308, p>0.05). The overall relationship ∆ DOC v. ∆ Q for all selected storms together was not significant either (r2= 0.09, d.f. = 21, p > 0.05). In contrast, during high flow following the three
Table 4. Summary of annual stream DOC and NO3-N exports (in kg m–2) in Fuirosos (Catalonia, Spain) during three hydrological cycles (1998/1999, 1999/2000, 2000/2001). Export values are shown separately for the baseflow and stormflow periods in each hydrological year. The relative contribution to the total annual export is shown in brackets in each case. 98-99 99-00 00-01 DOC Baseflow 82.42 (70%) 107.91(67%) 106.57 (40%) (kg-C km-2) Stormflow 35.31 (30%) 51.68 (33%) 158.34 (60%) TOTAL 117.73 159.59 264.91 NO3-N Baseflow 1.86 (12.6%) 4.69 (48.2%) 7.94 (19.9%) (kg-N km-2) Stormflow 12.94 (87.4%) 5.03 (51.8%) 31.95 (80.1%) TOTAL 14.8 9.72 39.89 log Q (L s-1) 1 10 100 1000 10000 DOC (m g-C L -1 ) 0 5 10 15 20 25
Fig. 4. Relationship between stream DOC concentrations (mg-C L-1)
and logarithm of the discharge (logQ, L s-1) during stormflow for all
the selected storm events. Crosses refer to stormflow generated by rainfalls smaller than 100 L m-2 (r2= 0.004, d.f. = 308, p>0.05).
Circles correspond to rainfalls higher than 100 L m-2. Solid line is
the fitted logarithm curve (r2= 0.65, d.f. = 57, p<0.001).
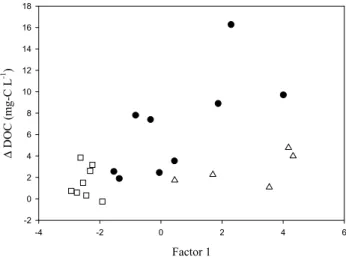
Factor 1 -4 -2 0 2 4 6 ∆ D O C (mg-C L -1 ) -2 0 2 4 6 8 10 12 14 16 18
Fig. 5. Relationship between Factor 1 extracted from the factor analysis, representing the antecedent moisture conditions and ∆ DOC during highflow for each selected storm event. Squares are winter and autumn cases, filled circles are late summer cases and empty triangles are spring cases.
largest precipitation events (i.e. >100 L m-2), there was a strong positive semilog-relationship between discharge and DOC concentration (Fig. 4, r2= 0.65, d.f. = 57, p < 0.001). The results of the factorial analysis showed that the antecedent moisture conditions (i.e. Factor 1) explained 22.7% of the total variability in DOC concentration during storm flow (Table 5). The scores of Factor 1 for spring cases were similar to those for summer ones, indicating that the antecedent moisture conditions in spring and summer were comparable. Nevertheless, DOC concentration changes in streamwater were more pronounced during late summer storm events (Fig. 5). The two first factors extracted from the factorial analysis (F1+F2 in Table 5) and ∆ DOC were related significantly (p < 0.05). In this case, the variance explained (R2 = 37.9%, p < 0.05) was larger than that explained by the antecedent moisture conditions only (i.e. Factor 1), suggesting that the changes in DOC concentration
during storms were also influenced by the magnitude of the event (i.e. Factor 2).
ANNUAL NITRATE EXPORT AND STORM NITRATE RESPONSES
The calculated annual NO3-N export was 21.4 ± 9.3 (s.e.) kg-N km–2 yr–1. The contribution of storms to the total nitrate-N export was 16.64 ± 7.9 (s.e.) kg-N km–2 yr–1, ranging between 52% and 87% of the total annual export (Table 4). The contribution to the total export of the three largest storms (i.e. >100 L m–2) ranged between 34% (December 1998) and 45% (December 2000 and January 2001). Stream NO3-N concentration at baseflow mean 0.04 mg-N L–1 during spring and summer, while in autumn and winter, basal concentrations ranged between 0.15 and 0.8 mg-N L–1. The changes in NO
3-N concentration during storms were variable. Nitrate concentrations increased during storms by 1.3 to 9 times those prior to the event.
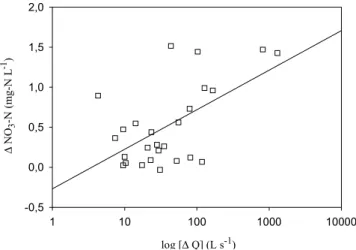
During some storms in late summer, nitrate concentrations increased by one to two orders of magnitude due to the low basal concentrations. By contrast, on two occasions (18 Jan, 1999 and 12 Jan, 2001), NO3-N concentrations during the stormflow decreased in relation to pre-storm concentrations. A positive weak semilog-relationship between discharge and NO3-N concentration was found with rainfall levels less than 65 L m–2 (r2= 0.08, d.f. = 384, p <0.001). For the largest rain episodes (i.e. >100 L m–2), the logarithm of discharge and NO3-N concentration were also weakly related (r2= 0.12, d.f. = 57, p <0.01). Moreover, there was a significant relationship between ∆ NO3-N and ∆ Q (r2= 0.32, d.f. = 26, p <0.01) (Fig. 6). In contrast, for the largest rain episodes
Table 5. r2 statistics (%) for the regressions between each variable included in the factorial analysis (i.e. precipitation amount (Rain) and rainfall duration (Dt), rain maximum intensity (PIMax), rain average intensity (PIAvg), magnitude of the flow change (∆ Q), soil moisture average (θAvg), potential evapotranspiration average (PETAvg) and soil moisture deficit average (SMDAvg)) and changes in DOC (∆ DOC) and NO3-N(∆ NO3-N) concentrations in streamwater during high flow in Fuirosos (Catalonia, Spain). Also shown are r2 statistic (%) for simple and multiple regressions of the factors extracted from the factorial analysis (Factor 1 (F1), Factor 2 (F2), Factor 3 (F3)) against changes in DOC (∆ DOC) and NO3-N(∆ NO3-N) concentrations in streamwater. (* p < 0.05; ** p < 0.01, ***p < 0.001). ∆ DOC ∆ NO3-N Rain 5.12 12.26 Dt 17.06 0.80 PIMax 27.07* 7.86 PI Avg 1.78 0.37 ∆ Q 0.09 32.67** θ Avg 12.52 2.20 PET Avg 4.92 5.85 SMD Avg 22.16* 0.1 Factor 1 22.71* 3.75 Factor 2 4.11 39.68*** Factor 3 0.31 0.6 F1+F2 37.92* 39.9** F1+F3 26.1 7.95 F2+F3 4.98 44.83** log [∆ Q] (L s-1) 1 10 100 1000 10000 ∆ NO 3 -N (m g-N L -1) -0,5 0,0 0,5 1,0 1,5 2,0
Fig. 6. Relationship between the nitrate concentration changes during stormflow (∆ NO3-N, mg L-1) and the logarithm of the
discharge increment (log ∆ Q, L s-1) for the 26 selected storms
(i.e. >100 Lm–2) discharge and NO
3-N concentration were unrelated (r2= 0.01, d.f. = 57, p > 0.05). On the other hand, NO3-N changes (i.e. ∆ NO3-N) could not be explained by the antecedent moisture conditions (i.e. Factor 1, r2= 0.03, d.f. = 25, p > 0.05), and NO3-N concentration changes during storms did not show any seasonal trend along the hydrological cycle. Thus, although a statistically significant relationship was found between ∆ NO3-N and the two first factors extracted from the factorial analysis (F1 + F2 in Table 5, R2 = 0.39, p < 0.01), the variance explained (39.9%) was equal to that explained by the magnitude of the event (i.e. Factor 2).
Discussion
ANNUAL DOC EXPORT AND STORM DOC RESPONSES
The annual DOC export estimated for Fuirosos is similar to that estimated by Butturini and Sabater (2000) in another Mediterranean forested catchment (Riera Major: 220 kg-C km–2 yr–1). However, these estimates are one to two orders of magnitude lower than the annual DOC export documented for small humid and forested catchments (e.g. 185 × 102 kg-C km–2 yr–1 in the pre Alps of central Switzerland, Hagedorn et al., 2000; or 15 × 102 kg-C km–2 yr–1 in North Carolina, U.S.A, Meyer and Tate, 1983). The small value for the annual DOC export in Fuirosos suggests that the productivity in this catchment is low, as has already been observed in other Mediterranean systems (Schlesinger and Hasey, 1981).
Hinton et al. (1997), establishing the importance of individual storms for DOC export in humid regions, found that storms were responsible for some 60% of the total annual DOC export during autumn and 35% in spring. Also, Butturini and Sabater (2000) estimated that 52% of the total annual DOC export from Riera Major, a Mediterranean catchment, occurred during storms. In Fuirosos, a maximum of 30% of the annual DOC export was due to mobilization of dissolved organic matter during storm events, although most of the DOC export occurred during baseflow. Large rain episodes strongly influenced the flush of solutes. For example, a single large storm was found to be responsible for 20% of the total annual DOC export. The strong positive relationship found between DOC concentrations and discharge for the largest rainfall episodes (r2 = 0.65, p < 0.001), suggests that a reservoir of DOC in the soil may be leached only during the largest storms, when pathways other than the usual hydrological pathways are established between the catchment and the stream.
In Fuirosos, discharge was not a good predictor of DOC
concentrations during high flow except for the largest storm cases. In upland catchments and humid climates, a direct relationship between DOC concentration and stream discharge has frequently been observed (Meyer and Tate, 1983; Hornberger et al., 1994; Mulholland and Watts, 1982; Thurman, 1985; Hinton et al., 1997). In other Mediterranean catchments, a moderate relationship between DOC concentrations and stream discharge has been reported (e.g. 40% of the total DOC variance is explained by discharge in Butturini and Sabater, 2000). However, in the Fuirosos case, DOC concentrations were unrelated to stream discharge, suggesting the importance of the biogeochemical processes in the response of solutes. In Fuirosos, the largest changes in DOC concentration during storm flow occurred in late summer, when antecedent conditions following the seasonal drought period were very dry. In contrast, spring storms occurring after similarly dry antecedent conditions did not produce DOC concentration changes as pronounced as during summer. Also, DOC concentration changes in spring were small and comparable to those during winter episodes. Hence, DOC responses in late summer were affected by biogeochemical processes other than antecedent moisture conditions. For instance, the leaching of fresh organic matter accumulated during the drought period in the streambed and in the riparian zone can explain late summer surges in DOC. In fact, previous studies in Fuirosos have estimated that all the leaf litter accumulated on the dry streambed during the period without water flow (0.45 kg DW m–2) was removed and transported downstream with the first rains after the summer drought (Sabater et al., 2001). Basal DOC concentrations during September and October were two to four times higher than during the rest of the year. Thus, the influence of the recently fallen litter on DOC concentration may extend also to the baseflow conditions during late summer and early autumn. The influence of litter fall on stormflow DOC concentrations has been observed in other intermittent streams (Biron et al., 1999) and also in perennial streams (Hinton et al., 1997; Butturini and Sabater, 2000). ANNUAL NO3-N EXPORT AND STORM NO3-N
RESPONSES
The annual NO3-N export estimated for Fuirosos (0.22 kg-N ha–1 yr–1) was four times higher than that estimated at La Castanya (0.05 kg-N ha–1 yr–1), a small Mediterranean holm oak and undisturbed catchment (Ávila et al., 2002). However, these estimates seem low when compared with the output of NO3-N at Riera Major (0.66 kg-N ha–1 yr–1), another small Mediterranean catchment (Butturini and Sabater, 2002). Previous studies conducted in the Fuirosos riparian area have shown that the inorganic N content in the
riparian soil was low, due to slow decomposition and low nitrogen mineralisation rates (Bernal et al., 2003). In addition, the catchment studied is characterised by a poorly developed soil structure, and a thin organic horizon. All these factors suggest that this catchment is nitrogen-limited. Other studies conducted in undisturbed Mediterranean catchments have concluded that biological demand is a major process controlling a tight N cycle (e.g. Ávila et al., 2002).
In Fuirosos, the contribution of storms to the total annual NO3-N export was larger than that estimated for DOC; the export of NO3-N during storm flow ranged between 52% and 87% of the total annual export, depending on the occurrence of large storm events, while the corresponding figure for DOC was between 30% and 60%. The largest storms (i.e. >100 L m–2) produced a disproportionally large contribution to the annual nitrate export. A moderately positive relationship was observed between discharge and NO3-N concentration changes during high flow (r2= 0.12, p < 0.001). Likewise, studies in humid regions have found that discharge is not a good predictor of nitrate concentrations during highflow (Arheimer et al., 1996; Hagedorn et al., 2001). However, in Fuirosos, a better relationship was found when the magnitude of the storm event was considered simultaneously (i.e. Factor 2 v. ∆ NO3 -N; r2= 0.39, p < 0.001). In Riera Major, a perennial Mediterranean stream, storm magnitude was the key to explaining nitrate concentrations and discharge could account for 47 % of the annual variability in nitrate concentrations (Butturini and Sabater, 2002). Thus, in Fuirosos, processes other than hydrological seem to govern the behaviour of nitrate dynamics during highflow, as has also been found for DOC. Studies focused on the response of solutes during the transition from dry to wet antecedent conditions have observed a marked peak in nitrate concentration after the first storm event ending the drought period, followed by slighter increases during subsequent events (Ávila et al., 1992; Biron et al., 1999). The increases in nitrate on the first large storm event probably relate to the contribution of rapid runoff through the organic-rich surface horizons. From these near-surface zones, the products of organic matter decomposition and nitrification accumulated during the inter-storm periods are leached during precipitation events (Biron et al., 1999). In Fuirosos, however, nitrate did not behave in this way even though peaks occurred after the drought period. In addition, it was not possible to distinguish any seasonal trend in relation to the antecedent moisture conditions because important nitrate peaks were also detected during winter precipitation events.
Conclusion
This study shows that the hydrochemistry in this Mediterranean intermittent stream is highly variable and unpredictable. However, antecedent moisture conditions, and the magnitude of storm events had significant effects on the hydrochemical responses during storms. DOC showed a moderate relationship with antecedent moisture conditions, while NO3-N was related significantly to the magnitude of the storm events.
In perennial streams belonging to both humid (Meyer and Tate, 1983; Hornberger et al., 1994; Mulholland and Watt, 1982; Thurman et al., 1985; Hinton et al., 1997) and Mediterranean regions (Butturini and Sabater, 2000), a direct relationship has been observed between DOC concentrations and stream discharge. In contrast, in the intermittent Fuirosos stream, DOC concentrations were unrelated to discharge. The suggestion is that DOC dynamics in Fuirosos are related to the abrupt changes occurring between drought and humid periods. For both nitrate and DOC, additional research is necessary to understand the processes which may be altered by these drastic changes and to evaluate the links between surface and groundwater during and after spates. Catchments such as Fuirosos are particularly susceptible to varying global weather conditions and should become ‘hot-spots’ for future studies on the effects of climatic change on catchment functioning.
Acknowledgements
The authors thank Antoni Bombí (Diputació de Barcelona, Servei Parcs Naturals), Esta Nin and Joan Cerrato-Gallego for their support in the field. Juan Lluís Riera provided the map of the study site and David Balayla revised the English version of the manuscript. Thanks are also due to Colin Neal for his valuable coments. This study was supported by funds provided by the European Community (INCA project EVK1-1999-00011) and by the Comisión Interministerial de Ciencia y Tecnología (CICT, reference # REN 01-3327).
References
Allan, J.D. 1995. Stream ecology. Structure and function of running
waters. Chapman and Hall. London. 388 pp.
Arheimer, B., Andersson, L. and Lepistö, A., 1996. Variation of nitrogen concentration in forest streams-influences of flow, seasonality and catchment characteristics. J. Hydrol. 179, 281– 304.
Ávila, A., Rodrigo, A. and Rodà, F., 2002. Nitrogen circulation in a Mediterranean holm oak forest, La Castanya, Montseny, northeastern Spain. Hydrol. Earth Syst. Sci., 6, 551–557. Ávila, A., Piñol, J., Rodà, F. and Neal, C., 1992. Storm solute
behaviour in a montane Mediterranean forested catchment. J.
Bernal, S., Butturini, A., Nin, E., Sabater, F. and Sabater, S., 2003. Leaf litter dynamics and nitrous oxide emission in a Mediterranean riparian forest: implications for soil nitrogen dynamics. J. Environ. Qual., 32 (in press).
Biron, P.M., Roy, A.G., Courschesne, F., Hendershot, W.H., Côté, B. and Fyles, J., 1999. The effects of antecedent moisture conditions on the relationship of hydrology to hydrochemistry in a small forested watershed. Hydrol. Process., 13, 1541–1555. Britton, D.L., Day, J.A. and Henshall-Howard, M.P., 1993. Hydrochemical responses during storm events in South African mountain catchment: the influence of antecedent conditions.
Hydrobiologia, 250, 143–157.
Brown, V.A., McDonnell, J.J., Burns, D.A. and Kendall, C., 1999. The role of event water, a rapid shallow flow component, and catchment size in summer stormflow. J. Hydrol., 217, 171–190. Butturini A. and Sabater, F., 2000. Seasonal variability of dissolved organic carbon in a Mediterranean stream. Biogeochemistry,
51, 303–321.
Butturini A., Bernal, S., Sabater, S. and Sabater, F., 2002. The influence of the riparian-hyporheic zone on the hydrological responses in an intermittent stream. Hydrol. Earth Syst. Sci., 6, 515–525.
Butturini, A. and Sabater, F., 2002. Nitrogen concentrations in a small Mediterranean stream: 1. Nitrate 2. Ammonium. Hydrol.
Earth Syst. Sci., 6, 539–550.
Campbell, G.S. and Norman, J.M., 1998. An introduction to
environmental biophysics. 2nd ed. Springer, New York, Inc. 281
pp .
Davies, T.D., Tranter, M., Blackwood, I.L. andAbrahams, P.W., 1993. The character and causes of a pronounced snowmelt-induced ´acidic episode‘ in a stream in a Scottish subarctic subcatchment. J. Hydrol. 146, 267–300.
Davis, J.C., 1973. Statistics and Data Analysis in Geology. Wiley, New York.
Gordon, N.D., McMahon, T.A. and Finlayson, B.L., 1992. Stream
hydrology. An introduction for ecologists. Prentice Hall, New
Jersey, USA.
Grimm, N.B. and Fisher, S.G., 1986. Nitrogen limitation in a Sonoran desert stream. J. N. Amer. Benthol. Soc., 5, 2–15. Evans, C.D., Davies, T.D., Wigington, P.J., Tranter, M. and Kretser,
W.A., 1996. Use of factor analysis to investigate processes controlling the chemical composition of four streams in the Adirondack Mountains, New York. J Hydrol., 185, 297–316. Hagedorn, F., Bucher, J.B. and Schleppi, P., 2001. Contrasting
dynamics of dissolved inorganic and organic nitrogen in soil and surface waters of forested catchments with Gleysols.
Geoderma, 100, 173–192.
Hagedorn, F., Schleppi, P., Peter, W. and Hannes, F., 2000. Export of dissolved organic carbon and nitrogen from Gleysol dominated catchments-the significance of water flow paths.
Biogeochemistry, 50, 137–161.
Hinton M.J., Schiff, S.L. and English, M.C., 1997. The significance of storms for the concentration and export of dissolved carbon from two Precambrian Shield catchments. Biogeochemistry, 36, 67–88.
Hornberger, G.M., Bencala, K.E. and McKnight, D.M., 1994. Hydrological controls on temporal variation of dissolved organic carbon in the Snake River near Montezuma, Colorado.
Biogeochemistry, 25, 147–165.
Johnston, R.J., 1978. Multivariate Statistical Analysis in
Geography. Longmans, London.
Keeney. D.R. and Nelson, D.W., 1982. Nitrogen Inorganic Forms. In: Methods of Soil Analysis, Part 2. Chemical and
Microbiological properties, A.L. Page (Ed.). Agronomy
Monographs nº 9, AA-SSSA Publisher. 643–698.
Legendre, P. and Legendre, L., 1998. Developments in
Environmental Modelling 20. Numerical Ecology, 2nd Edn.
Elsevier, Amsterdam, The Netherlands. 853 pp.
Martí, E. and Sabater, F., 1996. High variability in temporal and spatial nutrient retention in Mediterranean streams. Ecology,
77, 854–869.
Meyer, J. L. and Tate, C.M., 1983. The effects of watershed disturbance on dissolved organic carbon dynamics of a stream.
Ecology, 64, 33–44.
Meyer , J.L., Mac Dowell, W.H., Bott, T.L., Elwood, J.W., Ishizaki, C. Melack, J.M., Peckarsky, B.L., Peterson, B. L. and Rublee, P.A., 1988. Elemental dynamics in streams. J. N. Amer. Benthol.
Soc., 7, 410–432.
Mulholland, P.J., 1981. Organic carbon flow in a swamp-stream ecosystem. Ecol. Monogr., 51, 307–322.
Mulholland, P.J. and Watts, J.A., 1982. Transport of organic carbon to the oceans by the rivers of North America: a synthesis of existing data. Tellus, 34, 176–186.
Mulholland, P.J., Wilson, G.V. and Jardine, P.M., 1990. Hydrochemical responses of a forested watershed to storms: effects of preferential flow along shallow and deep pathways.
Water Resour. Res. 26, 3021–3036.
Puckett, L.J. and Bricker, O.P., 1992. Factors controlling the major ion chemistry of streams in the Blue Ridge and Valley and Ridge physiographic provinces of Virginia and Maryland. Hydrol.
Process., 6, 79–98.
Reid, J.M., MacLeod, D.A. and Cresser, M.S., 1981. Factors affecting the chemistry of precipitation and river water in an upland catchment. J. Hydrol. 50, 129–145.
Ribolzi, O., Andrieux, P., Valles, V., Bouzigues, R., Bariac, T. and Voltz. M., 2000. Contribution of groundwater and overland flows to storm flow generation in a cultivated Mediterranean catchment. Quantification by natural chemical tracing. J.
Hydrol., 233, 241–257.
Roberts, G., Hudson, J.A. and Blackie, J.R., 1984. Nutrient inputs and outputs in a forested and grassland catchment at Plynlimon, Mid Wales. Agr. Water Manage., 9, 177–191.
Sabater, S., Bernal, S., Butturini, A., Nin, E. and Sabater, F., 2001. Wood and leaf debris input in a Mediterranean stream: the influence of riparian vegetation. Arch. Hydrobiol.153, 91–102. Sala, M., 1983. Fluvial and slope processes in the Fuirosos basin, Catalan Ranges, North- east Iberian coast. Z. Geomorphologue.
N.F., 27, 393–411.
Schlesinger, W.H., 2001. Biogeoquímica: un análisis del cambio
global. Ariel Ciencia. Barcelona. 577 pp.
Schlesinger, W.H. and Hasey, M.M., 1981. Decomposition of chaparral shrub foliage: losses of organic and inorganic constituents from deciduous and evergreen leaves. J. Ecol., 62, 762–774.
Serrasolses, I., Diego, V. and Bonilla, D., 1999. Soil nitrogen
dynamics. In: Ecology of Mediterranean evergreen oak forests
F. Rodà (Ed.). Ecol. Studies 137. Springer, Berlin.
Technicon, 1976. Technicon instrument System. Technicon Method Guide. Tarrytown. NY, USA.
Terrades, J., 2001. Ecología de la vegetación. De la ecofisiología
de las plantas a la dinámica de comunidades y paisajes. Ed.
Omega. Barcelona. 703 pp.
Thurman, E.M., 1985. Organic geochemistry of natural waters. Martinus Nijhoff/Dr. W. Junk, Boston.
Williams, A.G., Ternan, J.L. and Kent. M., 1983. Stream solute sources and variations in a temperate granite drainage basin.