EARTHQUAKE-INDUCED TILT OF RETAINING
WALL WITH SATURATED BACKFILL
by
Nai-Hsin Ting
M.S., Civil Engineering (1991) Massachusetts Institute of Technology
B.S., Civil Engineering (1986) National Taiwan University
Taipei, Republic of China
Submitted to the Department of Civil and Environmental Engineering in Partial Fulfillment of the Requirement of the Requirements for the Degree of
DOCTOR OF PHILOSOPHY at the
MASSACHUSETTS INSTITUTE OF TECHNOLOGY May, 1993
© Nai-Hsin Ting, 1993. All rights reserved
The author hereby grants to MIT permission to reproduce and distribute publicly copies of this thesis document in whole or in part.
Signature of Author
Certified by
Accepted by
Department of Civil and Environmental Engineering May 7, 1993
Robert V. Whitman Thesis Supervisor
EARTHQUAKE-INDUCED TILT OF RETAINING WALL WITH SATURATED BACKFILL
by NaiHsin Ting
Submitted to the Department of Civil and Environmental Engineering on May 7, 1993 in partial fulfillment of the requirements for the Degree of Doctor of Philosophy in Civil and Environmental
Engineering
ABSTRACT
A series of dynamic centrifuge tests were performed to simulate some important aspects of the behavior of waterfront retaining structures when shaken by earthquakes. The tests were undertaken to obtain data for use in two different ways: (1) for use in verification of liquefaction analyses; and (2) for development of a better understanding of the behavior of these complex 3 oil-structure systems. This thesis is concerned with the results of the centrifuge model tests; it also provides a set of numerical predictions for the dynamic centrifuge tests using a finite element program, CYCON, developed by Bouckovalas (1982) and Stamatopoulos (1989) at MIT.
The centrifuge tests involved a model retaining wall, hinged at the base and designed to yield when the total load exceeded the shear resistance of a slider that was inserted in a tie-back supporting the retaining wall near its upper edge. In some tests involving strong earthquakes, the tie-back yielded and resulted in a plastic tilt in the wall. A lumped-mass-sliding-block model was developed to analyze the amount of plastic tilt in the wall. A reasonable comparison was obtained between the measured and predicted plastic tilting of the wall.
The investigation of tests where no slippage occurred at the slider (no yielding of the tie-back) led to some important findings about the behavior of the soil backfill and the soil-wall system during the tests: (1) threshold acceleration for pore pressure build-up; (2) threshold cyclic shear strain for pore pressure build-up; (3) loosening of soil skeleton versus earthquake intensity; and (4) phase relations between the ground acceleration and the dynamic earth and water thrusts. The investigation also revealed the characteristics of liquefaction and quasi-liquefaction of soils; and it examined the validity of Mononobe-Okabe (M-O) and Westergaard equations for estimating dynamic earth and water thrusts on retaining walls. The M-O and Westergaard equations did not work for estimating the dynamic thrusts from the soil skeleton and the pore water, chiefly because of the interaction between the retaining wall and the backfill soil. However, an equation combining these two equations gave reasonable estimates for the total dynamic thrust from the backfill soil (both soil skeleton and pore water). The study of phase relations provided significant information supporting the above findings.
A set of quantitative criteria was developed to inspect numerical predictions for the behavior of soils during earthquakes. The CYCON predictions survived an examination with these criteria and CYCON proved to be effective in predicting the behavior of one type of sand during the dynamic centrifuge tests. These systematic criteria are reasonably stringent and are potentially applicable in the verification of other numerical methods that predict behavior of soils during earthquakes.
Thesis Supervisor: Dr. Robert V. Whitman
ACKNOWLEDGMENTS
I would like to express my gratitude to the many people who have helped me in my studies at MIT. Special thanks are given to the following:
* Professor Robert V. Whitman, my advisor for both of my degrees at MIT, for his patient guidance and invaluable advice. It has been my privilege and great honor to accomplish this study under his supervision. In addition to the technical details concerning the research project, I have learned much from him, especially how to perform scientific research with engineering insight.
* Dr. John T. Germaine, for providing wonderful ideas and significant suggestions in solving the experimental problems. By having the opportunity to work with him in two research projects I was able to learn many techniques in performing experiments meticulously.
* Professor Andrew J. Whittle, for serving on my thesis committee and for his efforts in reviewing this thesis. I wish to thank him also for his advice, encouragement and substantial assistance during the early stage of my study at MIT.
* Dr. John T. Christian and Professor Eduardo Kausel, for serving on my thesis committee and for providing their professional insight and guidance in my research.
* Professor George Bouckovalas at the National Technical University of Athens, for his assistance in performing the numerical predictions. It has been a great privilege to work with him during and after his four-week visit to MIT.
* Professor Raj Siddharthan at the University of Nevada at Reno, for his suggestions and assistance. Many lunch box discussions with him were joyful and fruitful.
* Professor Charles C. Ladd, for his excellent teaching and considerable assistance in my master's research.
* Ute Schran, for her considerable assistance in the lab work and in reducing the test data.
* Stephen Rudolph, for providing excellent ideas in designing, and precise work in constructing, the equipment.
* Paul Van Laak and Li Liu at Rensselaer Polytechnic Institute, for their assistance in operating the centrifuge.
* The National Science Foundation, whose financial support through Grant BCS-900378 made the research possible.
I would also like to express my gratitude to the many people who made my five-year stay at MIT and in the greater Boston area colorful and memorable. Special thanks are extended to:
* Shun-Min Lee and his family, for their warmth and genuine consideration. Shun-Min is my best friend at MIT and has added substantial breadth to my knowledge and concern for the world at MIT and elsewhere. I will cherish the time we spent together.
· Lucy Jen, Xiaomeng Yu, Chuin-Ping Chen and Hsien-Yen Tien, for their sincerity.
* My other colleagues at the Constructed Facility division: Professor Tom Sheahan, Chris Swan and Doug Cauble, my dear officemates; Dr. Geraldo Iglesia, Juan Pestana-Nascimento, Dr. Doug Larson, Dr. Tien-Ho Seah, Mauricio Abramento, Dante Legaspi, Masahiro Iwano, Marika Santagata and many others, for all the discussions and otherwise.
* The members of the Republic of China Student Association (ROCSA) at MIT and many other friends around Boston, particularly Jory Tsai, Chia-Li Liu and Cliff Cheng, for their assistance in serving the ROCSA community.
Ultimately, I thank the lord, Allah, Who gave me all chances in my life.
TABLE OF CONTENTS
ABSTRACT ... 3 ACKNOWLEDGMENTS...5 TABLE OF CONTENTS ... 7 LIST OF TABLES ... 11 LIST OF FIGURES ... 13 1. INTRODUCTION ... ... 191.1 PROBLEM DEFI NITION ... 19
1.2 CLASS A PREDICTIONS ... 21
1.3 SCOPE OF RESEARCH ... 23
1.4 UNITS AND SCALES ... 25
1.5 DEFINITIONS OF SPECIAL TERMS IN THIS THESIS . ...25
2. BACKGROUND ... 29
2.1 ANALYTICAL METHODS FOR DYNAMIC LATERAL PRESSURES ON RETAINING WALLS . ... 30
2.1.1 Dynamic Earth Thrust on Retaining Walls ... 30
2.1.2 Hydrodynamic Pressures on Retaining Walls ... 31
2.1.3 Dynamic Earth Pressures From a Saturated Backfill ... 33
2.1.4 Influence of Phase on Earth Pressure Calculation ... 33
2.2 DYNAMIC CENTRIFUGE MODELING OF EARTH RETAINING STRUCTURES . ... 34
2.2.1 Cantilever Retaining Wall ... 35
2.2.2 Tilting Retaining Wall ... ... 35
2.2.3 Amplification of Peak Acceleration ... 37
2.2.4 Belleville Disc Washers to Model Foundation Soils ... 38
2.3 LIQUEFACTION POTENTIAL OF SATURATED SANDS ... 39
2.4 NUMERICAL MODELS FOR SANDS DURING EARTHQUAKES ... 40
2.4.1 Fully Coupled Analyses ... 40
2.4.2 Partially Coupled Analyses ... 41
3. CENTRIFUGE CHECK TEST ... ... 45
3.1 TESTING PROGRAM ... ... 46
3.2 PREPARATION FOR SATURATED SAND STRATUM ... 47
3.2.1 Pluviation of Dry Sand ... ... 47
3.2.2 Saturation Procedures ... ... 49
3.3 IMPORTANT INFORMATION FROM CHECK TEST RESULTS ... 52
4. CENTRIFUGE MODEL TEST ... 61
4.1 IN TRO D U CTION ... 61
4.1.1 The Model Retaining Wall and the Tie-Back System ... 62
4.1.2 Instrum entation . .. . . ... ... 63
4.2 TESTING PROGRAM ... 65
4.2.1 Testing Program ... 65
4.2.2 Test Procedures ... 66
4.3 TEST RESULTS ... ... 68
4.3.1 Liquefaction of the Backfill Soil ... ... 70
4.3.2 Summary of Other Data Features ... ... 72
4.3.3 Incremental Earth Thrust and Tilt of the Retaining Wall ... 74
5. NUMERICAL PREDICTIONS FOR MODEL TESTS .... ... 91
5.1 INTRODUCTION ... 92
5.2 THE FEM PROGRAM CYCON ... 93
5.2.1 INTRODUCTION ... 93
5.2.2 Constitutive Relationships of the Residual Strain Method (RSM) ... 94
5.3 ANALYTICAL SIMULATION OF CENTRIFUGE TESTS WITH CYCON.. 97
5.3.1 DETERMINATION OF CONSTITUTIVE MODEL PARAMETERS... 97
5.3.2 Finite Element Discretization ... 99
5.3.3 Dynamic Shear Stresses ... 100
5.4 EVALUATION OF ANALYTICAL PREDICTIONS WITH CYCON ... 101
5.4.1 Analytical Predictions of Pore Pressure Build-up . ... ... 102
5.4.1.1 Peak Pore Pressure ... 102
5.4.1.2 Pore Pressure Rising Rate ... 104
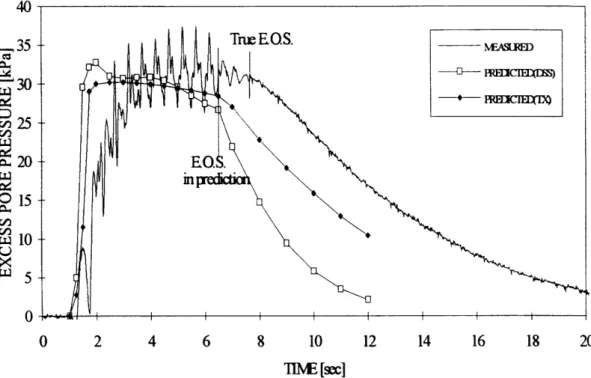
5.4.1.3 Decay of Excess Pore Pressure During Shaking ... 106
5.4.1.4 Post Shake Pore Pressure Decay ... 107
5.4.2 Horizontal Wall Movements ... 109
5.4.3 SUMMARYY . . ... 110
6. BEHAVIOR OF THE SOIL-WALL SYSTEM IN CENTRIFUGE MODEL TEST (I) BEHAVIOR PRIOR TO SLIPPAGE AT SLIDER... ... 133
6. 1 PORE PRESSURE VARIATIONS ... 135
6.1.1 Increase of the Average Transient Pore Pressure ... 135
6.1.2 Cyclic Pore Pressure Variation ... ... ... 136
6.2 EARTH THRUSTS ACTING ON WALL ... 142
6.2.1 Moments Acting on Wall During Shaking ... 143
6.2.2 Thrust from Excess Pore Pressure ... ... 146 8
6.2.3 Restraining Forces at Tie-Back From Various Thrusts on Wall ... 147
6.3 GENERAL OBSERVATION OF ALL THRUSTS ON WALL ... 149
6.3.1 Variation of Average Transient Thrusts on Wall from Pore Pressure and Soil Skeleton ... 150
6.3.2 Cyclic Fluctuations of Thrusts on Wall ... 156
6.3.3 Summary ... 162
7. BEHAVIOR OF THE SOIL-WALL SYSTEM IN CENTRIFUGE MODEL TEST (I)EARTHQUAKE-INDUCED PLASTIC TILT OF THE RETAINING WALL203 7.1 LOAD AND SLIP AT SLIDER ... 204
7.1.1 Load at The Fixed Support of Slider ... 205
7.1.2 Load at The Sliding Layer of The Slider ... 206
7.1.3 Verification of Slip at Slider ... 207
7.2 LUMPED-MASS-SLIDING-BLOCK MODEL ... 210
7.2.1 The Model for The Stick-Slip Tilting Retaining Wall ... 210
7.2.2 Horizontal Wall Displacements at The Tie-Back Level During Earthquakes ... 215
7.2.3 Summary ... 222
8. SUMMARY AND CONCLUSIONS ... ... 243
8.1 PURPOSE AND SCOPE OF RESEARCH ... 243
8.2 SUMMARY OF SCIENTIFIC FINDINGS ... 246
8.3 FACTORS AFFECTING THE PLASTIC TILT OF A RETAINING WALL. 249 8.4 RECOMMENDED CONSIDERATIONS FOR SEISMIC DESIGN OF EARTH RETAINING STRUCTURES ... 251
8.5 RECOMMENDATIONS FOR FUTURE RESEARCH ... 254
8.5.1 More Investigation on the Existing Centrifuge Model Tests ... 254
8.5.2 Analytical Work on the Dynamic Centrifuge Model Tests ... 258
8.5.3 Investigations of More Realistic Waterfront Structures ... 260
REFERENCES... 261
Appendices A. DEFINITIONS OF TERMS ... 269
B. CENTRIFUGE MODEL TEST RESULT ... ... 273
C. DETERMINATION OF MODEL PARAMETERS .... ... 389
D. INPUT FILES FOR FEM PROGRAMS ABAQUS AND CYCON ... 419
LIST OF TABLES
Table 1.1 Classification of Predictions (from Lambe, 1973) ... 21
Table 3.1 Summary of Properties of Nevada Sand ... 54
(from The Earth Tech. Report, 1992)
Table 4.1 Information of the model retaining wall and tie-back ... 77
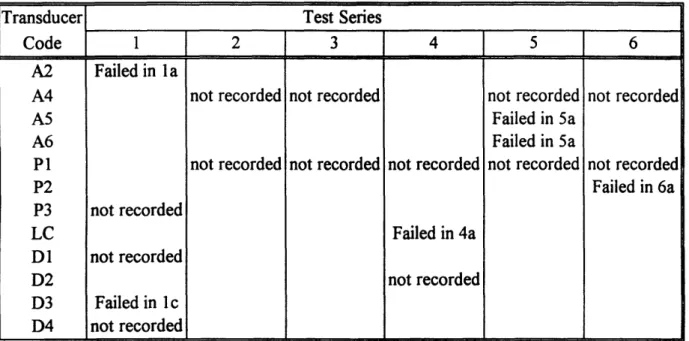
Table 4.2 Instrumentation (see Figure 4.4 for transducer code) ... 77
Table 4.3 Channels not recorded or failed to record correctly in the testing program
... 78
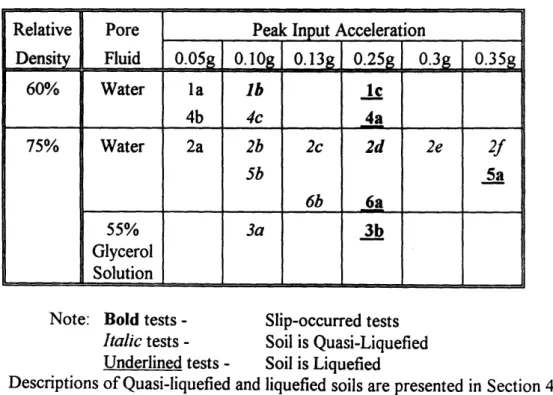
Table 4.4 Summary of the Testing Program ... 79
Table 4.5 Summary of occurrences of slip and liquefaction of the test program ... 79
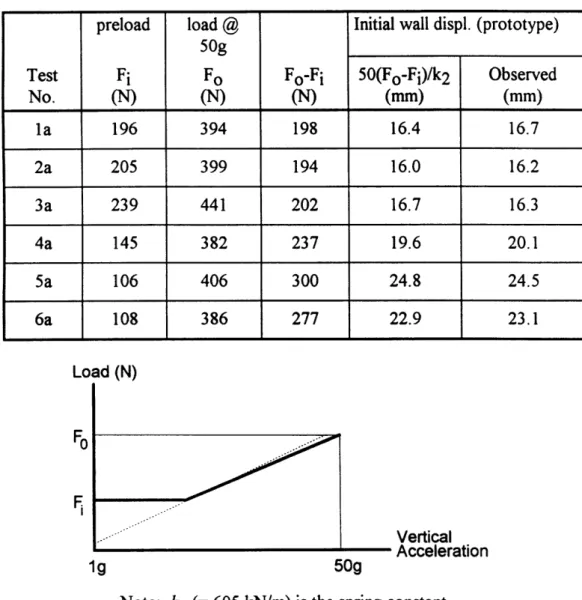
Table 4.6 Incremental load in the tie-back and horizontal wall movement during
centrifuge spin-up ... 80
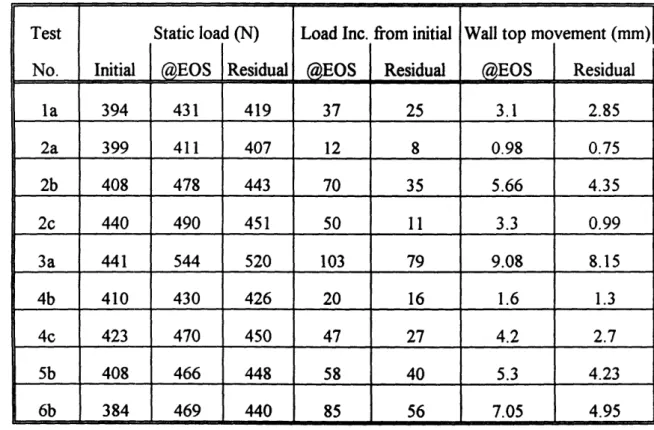
Table 4.7 Incremental load in the tie-back and horizontal wall movement during
non-slip tests ... 81
Table 5.1 Model parameters of Nevada Sand for Program CYCON ... 112
Table 5.2 Model parameters of all materials used in Program CYCON ... 113
Table 5.3 Stresses and Coordinates at the centroid of each element ... 1.. 114
Table 5.4 Comparison of excess pore pressure predictions with measurements
- Peak excess pore pressure ... 115
Table 5.5 Comparison of excess pore pressure predictions with measurements
- Peak excess pore pressure ratio... 116
Table 5.6 Qualitative comparison of peak excess pore pressure ratio ... 117
Table 5.7 Comparison of excess pore pressure predictions with measurements
- Time to rise 1/2 peak excess pore pressure ... 118
Table 5.8 Comparison of excess pore pressure predictions with measurements
- Rate of pore pressure increment (kPa/sec) ... 119
Table 5.9 Qualitative comparison of peak excess pore pressure rising rate ... 120
Table 5.10 Comparison of excess pore pressure predictions with measurements
- Ratio of excess pore pressure @ EOS / peak excess pore pressure .... 121
Table 5.11 Qualitative comparison of rate of decay in excess pore pressure
during shaking... 122
Table 5.12 Comparison of excess pore pressure predictions with measurements
- Rate of time taken to decay one half excess pore pressure @ EOS .... 123 Table 5.13 Qualitative comparison of post shake decay of excess pore pressure ... 124
Table 5.14 Comparison of predicted horizontal wall movements with measurements
... 125
Table 6.1 Presence of "Double Cycling" of excess pore pressure fluctuation
in all tests... ... 164
Phase angle between cyclic thrust fluctuation and inward input acceleration
... ·... ooo..o ... ... 166
Table 6.4 Summary of double amplitude of cyclic fluctuations of all thrusts on wall
in non-slip tests ... 167
Table 7.1 Interpreted spring constant and damping coefficient of the soil-wall system in non-slip tests ... 224
Table 7.2 Summary of horizontal wall displacements in prototype scales predicted with the Lumped-Mass-Sliding-Block model ... 225
Table C. 1 Determination of Bc from resonant column tests ... 404
Table C.2 Computation of vertical strain in undrained cyclic triaxial tests ... - D r = 40% ... 405
Table C.3 Computation of vertical strain in undrained cyclic triaxial tests - D r = 60% ... 406
Table C.4 Determination of 13c from cyclic strain - Dr = 40% ... ... 407
Table C.5 Determination of ,3c from cyclic strain - Dr = 60% ... 408
Table C.6 Summary of undrained cyclic DSS test data ... 409
Table C.7 Model parameters of Nevada Sand for Program CYCON ... 410
Table C.8 Procedures for Evaluation of C1... ... 411
Table C.9 Extrapolation of 3c based on Ycyc ratios . ... 411 Table 6.3
LIST OF FIGURES
Figure 1.1 Average transient earth thrust in Test a ... 26
Figure 3.1 Check test model and instrumentation ... 55
Figure 3.2 Sand pluviation device ... 56
Figure 3.3 Removing over-pluviated sand with vacuum ... 57
Figure 3.4 Saturation of sand sample and pore pressure transducers ... 58
Figure 3.5 Pore pressure behavior during check tests ... 59
Figure 4.1 Concepts of designing the centrifuge test model ... 82
Figure 4.2 Complete assembly of the tie-back system ... 83
Figure 4.3 Detailed design of the slider ... 83
Figure 4.4 Locations of instruments in the centrifuge test model ... 84
Figure 4.5 Calibration for effective mass of load cell ... 85
Figure 4.6 Pore pressure ratio and acceleration response in backfill in Test la ... 86
Figure 4.7 Pore pressure ratio and acceleration response in backfill in Test 6b ...87
Figure 4.8 Pore pressure ratio and acceleration response in backfill in Test 5a ...88
Figure 4.9 Factor of acceleration amplification at load cell (A4/A1) ... 89
Figure 4.10 Horizontal wall movement (D3) in Test la ... 89
Figure 4.11 Static load increments and wall movements in non-slip tests ... 90
Figure 5.1 Grain size distribution curves of Nevada, Leighton-Buzzard and Oosterschelde Sands ... 125
Figure 5.2 Finite element mesh for numerical prediction with CYCON ... 126
Figure 5.3 Numbering of element and periferal coordiates of the finite element mesh ... 127
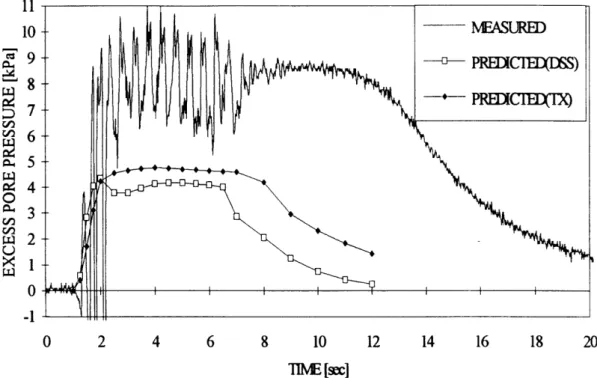
Figure 5.4 CYCON predicted and measured excess pore pressure at P5 in Test 5a ... 128
Figure 5.5 CYCON predicted and measured pore pressure ratio at P5 in Test 5a ... 1... 128
Figure 5.6 CYCON predicted and measured excess pore pressure at P4 in Test 3a ... 129
Figure 5.7 CYCON predicted and measured excess pore pressure at P4 in Test 2a ... 129
Figure 5.8 CYCON predicted and measured excess pore pressure at P3 in Test 4a ... 130
Figure 5.9 CYCON predicted and measured excess pore pressure at P5 in Test 4a ... ... 1 3 0 Figure 5.10 CYCON predicted and measured wall displacement at sand surface in T est 2a ... 131
Figure 5.11 CYCON predicted and measured wall displacement at sand surface in Test 3a ... 131
Figure 6.4 Acceleration Record of ACC3 in Test 5a ... 169
Figure 6.5 Results of Cyclic Simple Shear Test on Nevada Sand (Test No. 60-04) (Reproduced from The Earth Technology Report) ... 170
Figure 6.6 Results of CIUC Test on Nevada Sand (Test No. 60-12) (Reproduced from The Earth Technology Report) ... 171
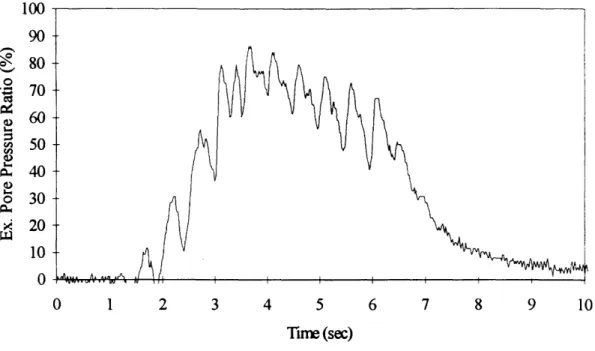
Figure 6.7 Excess Pore Pressure Record of P4 in Test 2d ... 172
Figure 6.8 A Simplified Configuration of the Testing Model ... 173
Figure 6.9 Excess Pore Pressures of P2, P4 and P6 in Test 2b ... 174
Figure 6.10 Schematic pore pressure distribution during centrifuge model test ... 175
Figure 6.11 Pore pressrue thrust calculated from P2, P4 and P6 in Test 2b ... 176
Figure 6.12 Figure 6.13 Figure 6.14 Figure 6.15 Figure 6.16 Figure 6.17 Figure 6.18 Figure 6.19 Figure 6.20 Figure 6.21 Figure 6.22 Figure 6.22 Figure 6.24 Figure 6.25 Figure 6.26 Figure 6.27 Figure 6.28: Figure 6.29 Figure 6.30 Figure 6.31 Figure 6.32 Figure 6.33 Figure 6.34 Figure 6.35 Figure 6.36 Figure 6.37 Figure 7.1 Figure 7.2 Earth Thrusts and Thrust from Wall Inertia inTest Earth Thrusts and Earth Thrusts and Earth Thrusts and Earth Thrusts and Earth Thrusts and Earth Thrusts and Earth Thrusts and Earth Thrusts and Earth Thrusts and Thrust from Wall Inertia inTest Thrust from Wall Inertia inTest Thrust from Wall Inertia inTest Thrust from Wall Inertia inTest Thrust from Wall Inertia inTest Thrust from Wall Inertia inTest Thrust from Wall Inertia inTest Thrust from Wall Inertia inTest Thrust from Wall Inertia inTest la ... 177 lb ... 178 2a ... . ... 179 2b ... 180 2c ... ... 181 3a ... ... 182 4b ... 183 4c ... ... 184 5b ... 185 6b ... 186
Soil skeleton thrust in non-slip tests ... 187
Pore pressure thrust in non-slip tests ... 189
Decrease in Soil Skeleton Thrust during shaking in non-slip tests ... 191
Pore Pressure Thrust Increment during shaking in non-slip tests ... 191
Pore Pressure Build-up of saturated sands in cyclic triaxial tests ... 192
(from Dobry et al., 1981) Pore Pressure Build-up versus cyclic shear strain in non-slip tests ... 192
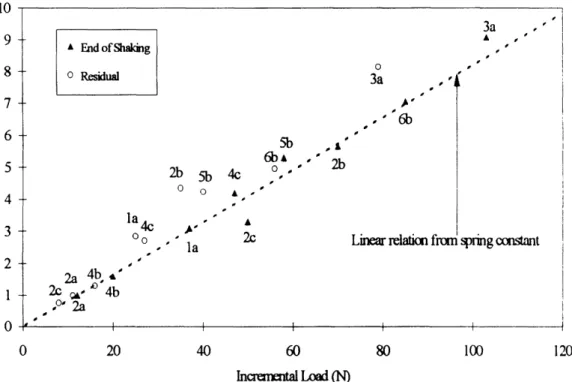
Incremental earth thrust at the end of shaking in centrifuge model tests 193 Post Shake Soil Skeleton Thrust Increment in non-slip tests ... 193
Residual Earth Thrust Increment after earthquakes in non-slip tests .... 194
Hypothetical contours of normalized dynamic response in soil backfill 195 Acceleration responses in soil (A3) and input accelerations (Al) in non-slip tests ... ... 196
Acceleration at top of retainig wall (A6) and input accelerations (Al) in non-slip tests with no slippage at slider ...198
Phase lags of various thrusts and wall rotations to peak inward input acceleration ... ... 200
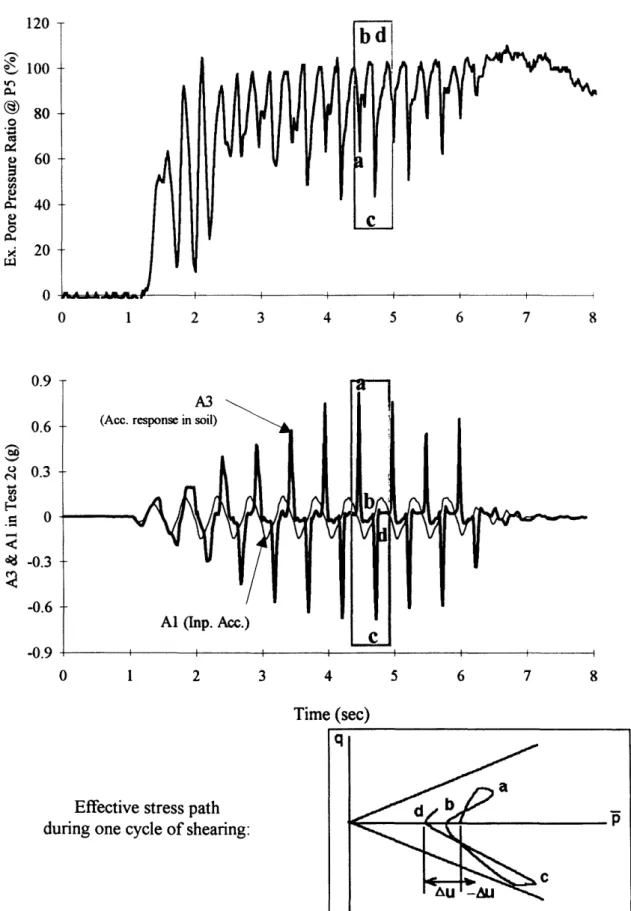
Hypothetical model for dynamic pore pressure fluctuation due to periodic rotation of retaining wall ... 201
Double amplitude of cyclic thrust variation of thrusts from wall inertia and soil backfill in non-slip tests ... ... 202
Double amplitude of cyclic thrust variation of thrusts from pore pressure and soil skeleton in non-slip tests ... 202
A1, A4 and A5 in Test la ... 226
Figure Figure Figure Figure Figure Figure Figure Figure Figure Figure Figure Figure Figure Figure Figure 7.3 7.4 7.5 7.6 7.7 7.8 7.9 7.10 7.11 7.12 7.13 7.14 7.15 7.16 8.1 Figure B.1 Figure B.2 Figure B.3 Figure B.4 Figure B.5 Figure B.6 Figure B.7 Figure B.8 Figure B.9 Figure B. 10 Figure B.11 Figure B. 12 Figure B. 13 Figure B. 14 Figure B. 15 Figure B. 16 Figure B. 17 Figure B. 18 Figure B. 19 Figure B.20 Figure B.21 Figure B.22 Figure B.23 Figure B.24 Figure B.25
Load at Slider in Tests 2b, 2c, and 2d ... 228
Load at Slider in Tests 3a and 3b ... 229
Load at Slider in Tests 4b and 4c ... 230
Load at Slider in Tests 5a and 5b ... 231
Load at Slider in Tests 6a and 6b ... 232
Frequency Response of Displacement Transducer ... 233
The Lumped-Mass-Sliding-Block Model ... 234
(A6-A1) and A4 in Tests c and 4a ... 235
Load at slider and horizontal wall top displacement in Test lb ... 236
Load at slider and horizontal wall top displacement in Test c ...237
Load at slider and horizontal wall top displacement in Test 2d ...238
Load at slider and horizontal wall top displacement in Test 3b ...239
Load at slider and horizontal wall top displacement in Test 5a ...240
Load at slider and horizontal wall top displacement in Test 6a ... 241
Recommended configuration of the centrifuge model for future research ... 2 56 Acceleration data in Test la ... 274
Displacement and load data in Test la ... 276
Excess pore pressure data in Test la ... 277
Excess pore pressure ratio in Test la ... 279
Acceleration data in Test lb ... 281
Displacement and load data in Test lb ... 283
Excess pore pressure data in Test lb ... 284
Excess pore pressure ratio in Test lb ... 286
Acceleration data in Test c ... 288
Displacement and load data in Test c ... 290
Excess pore pressure data in Test c ... 291
Excess pore pressure ratio in Test c ... 293
Acceleration data in Test 2a ... 295
Displacement and load data in Test 2a ... 296
Excess pore pressure data in Test 2a ... ... 297
Excess pore pressure ratio in Test 2a ... 299
Acceleration data in Test 2b ... 301
Displacement and load data in Test 2b ... 302
Excess pore pressure data in Test 2b ... 304
Excess pore pressure ratio in Test 2b ... 305
Acceleration data in Test 2c ... 307
Displacement and load data in Test 2c ... 308
Excess pore pressure data in Test 2c ... 309
Excess pore pressure ratio in Test 2c ... 311
Figure B.29 Figure B.30 Figure B.31 Figure B.32 Figure B.33 Figure B.34 Figure B.35 Figure B.36 Figure B.37 Figure B.38 Figure B.39 Figure B.40 Figure B.41 Figure B.42 Figure B.43 Figure B.44 Figure B.45 Figure B.46 Figure B.47 Figure B.48 Figure B.49 Figure B.50 Figure B.51 Figure B.52 Figure B.53 Figure B.54 Figure B.55 Figure B.56 Figure B.57 Figure B.58 Figure B.59 Figure B.60 Figure B.61 Figure B.62 Figure B.63 Figure B.64 Figure B.65 Figure B.66 Figure B.67 Figure B.68 Figure B.69 Figure B.70 Figure B.71 Figure B.72 Figure C. 1
Acceleration data in Test 2e ... ... ... 319
Displacement and load data in Test 2e ... ... 320
Excess pore pressure data in Test 2e ... 321
Excess pore pressure ratio in Test 2e ... 323
Acceleration data in Test 2f ... ...325...3325... Displacement and load data in Test 2f...326
Excess pore pressure data in Test 2f ... ... 327
Excess pore pressure ratio in Test 2f ... 329
Acceleration data in Test 3a ... 331
Displacement and load data in Test 3a ... 332
Excess pore pressure data in Test 3a ... 333
Excess pore pressure ratio in Test 3a ... 335
Acceleration data in Test 3b ... 337
Displacement and load data in Test 3b ... 338
Excess pore pressure data in Test 3b ... 339
Excess pore pressure ratio in Test 3b ... 341
Acceleration data in Test 4a ... 343
Displacement and load data in Test 4a ... 345
Excess pore pressure data in Test 4a ... 346
Excess pore pressure ratio in Test 4a ... 348
Acceleration data in Test 4b ... 350
Displacement and load data in Test 4b ... 352
Excess pore pressure data in Test 4b ... 353
Excess pore pressure ratio in Test 4b ... 355
Acceleration data in Test 4c ... 357
Displacement and load data in Test 4c ... ... 359
Excess pore pressure data in Test 4c ... 360
Excess pore pressure ratio in Test 4c ... ... 362
Acceleration data in Test 5a . ... 364
Displacement and load data in Test 5a ... 365
Excess pore pressure data in Test 5a . ...366
Excess pore pressure ratio in Test 5a ... 368
Acceleration data in Test 5b ... 370
Displacement and load data in Test 5b ... 371
Excess pore pressure data in Test 5b ... 372
Excess pore pressure ratio in Test 5b ... 374
Acceleration data in Test 6a ... 376
Displacement and load data in Test 6a ... 377
Excess pore pressure data in Test 6a ... 378
Excess pore pressure ratio in Test 6a ... 380
Acceleration data in Test 6b ... 382
Displacement and load data in Test 6b ... ... 383
Excess pore pressure data in Test 6b ... 384
Excess pore pressure ratio in Test 6b . ...386
Figure Figure Figure Figure Figure C.2 C.3 C.4 C.5 C.6 Figure C.7 Figure C.8 Figure E. 1 Figure E.2 Figure E.3 Figure E.4 Figure E.5 Figure E.6 Figure E.7 Figure E.8 Figure E.9 Figure E. 10 Figure E. 11 Figure E. 12 Figure E. 13 Figure E. 14 Figure E. 15 Figure E. 16 Figure E. 17 Figure E. 18
Determination for the Parameter C2 ... 413
Determination for the Parameter a ... 414
Determination for the Parameter C3 ... 415
Comparison of Predicted Shear Strain and Triaxial Test Data ...416
Comparison of Predicted Excess Pore Pressure and Triaxial Test Data ... 416
Comparison of Predicted and Measured Number of Cycles to Failure in Cyclic Triaxial Test ... 417
Comparison of Predictions and Cyclic DSS Test Data ... 417
Predicted and observed Predicted and observed Predicted and observed Predicted and observed Predicted and observed Predicted and observed Predicted and observed Predicted and observed Predicted and observed Predicted and observed Predicted and observed Predicted and observed Predicted and observed Predicted and observed excess pore pressure in Test la ... 436
excess pore pressure ratios in Test a ... 439
excess wall top displacements in Test a ...442
excess pore pressure in Test la ... 443
excess pore pressure ratios in Test la ... 445
excess wall top displacements in Test a ... 447
excess pore pressure in Test la ... 448
excess pore pressure ratios in Test la ... 451
excess wall top displacements in Test a ... 453
excess pore pressure in Test la ... 454
excess pore pressure ratios in Test la ... 457
excess wall top displacements in Test a ... 459
excess pore pressure in Test la ... 460
excess pore pressure ratios in Test a ...463
Predicted and observed excess wall top displacements in Test a ... 465
Predicted and observed excess pore pressure in Test la ... 466
Predicted and observed excess pore pressure ratios in Test a ... 468
CHAPTER 1
INTRODUCTION
This thesis is concerned with results from a series of centrifuge model tests simulating some important aspects of the behavior of waterfront retaining structures when shaken by earthquakes. The tests were undertaken to obtain data for use in two different ways:
· For use in verification of liquefaction analyses
· For development of a better understanding of the behavior of this complex soil-structure system, with the hope of improving and developing relatively simple rules for the analysis and design of such systems.
1.1
PROBLEM DEFINITION
The soils behind waterfront retaining structures are often cohesionless; and water tables are usually high in such soil backfills. During strong earthquakes, there is a strong possibility of pore pressure build-up and associated liquefaction phenomena. There have been numerous cases of failure or unsatisfactory performance of such structures.
soils and of structures that retain the soils or those are built upon such soils. Up to the present time, a variety of techniques have been proposed for the analysis of earthquake-induced deformations of both the ground and the structures. Typically, many of these methods, employing numerical procedures, are used to assess the dynamic performance of
soil and structures during earthquakes. Consequently, validation of these numerical
techniques is required, by comparisons of the numerical predictions with observed soil behaviors. However, there are only few documented histories of the performances of both the soils and structures (pore pressure, acceleration and deformation data) during natural earthquakes. Even if many sites were instrumented to monitor these data, the use of field
data to validate numerical methods would suffer from the following difficulties:
1. One cannot predict when and where an earthquake will take place. Field
instrumentation would need to be installed in many sites. Both the capital and
maintenance costs of such instrumentation would be prohibitively large. In
addition, it might take decades, or even centuries, to obtain comprehensive field data for validating the numerical predictions.
2. It is difficult to determine the properties of field soils because of the inherent non-homogeneity of naturally deposited soil layers.
3. It is difficult to define the boundary conditions of field deposits.
Laboratory shaking table tests, as one alternative to field data, have been used to validate several numerical procedures (Yoshimi and Tokimatsu, 1978). The application of shaking table tests to validate numerical models is confined, however, to soils having much lower effective stresses than those in the field. Recently, one experimental technique has been employed to offer realistic full-scale stress states together with uniform soil and
well-defined boundary conditions. This technique is dynamic centrifuge testing (Schofield,
1981).
This research studies the behavior of a saturated sand and the retaining wall that supports it during earthquakes by dynamic centrifuge testing. One numerical model (CYCON) was employed to make predictions for the tests of the centrifuge. For the purpose of validating numerical models, a set of numerical criteria was established in this study to evaluate numerical predictions in a systematic fashion.
1.2
CLASS A PREDICTIONS
In the Thirteenth Rankine Lecture, Lambe (1973) examined the anatomy of predictions. He used an example of predicting the settlement of a building to illustrate the definitions of three types of predictions. A class A prediction of settlement would be made before construction and based entirely on data available at that time. A class B prediction would be made during the construction and might use data obtained during the
Table 1.1 Classification of predictions (from Lambe, 1973)
Prediction When prediction Results at time
type made prediction made
A Before event
B During event Not known
initial part of the construction, such as measurements made during excavation, foundation construction, etc. A class C prediction is one made after the settlement has occurred. Table 1.1 summarizes the characteristics of the classifications.
A complete set of numerical analyses has been carried out to make "Class A" predictions for the outcomes of the centrifuge model tests. A numerical prediction for a dynamic centrifuge model test was performed based upon the soil properties, the geometry and boundary conditions of the test model, and the input motions applied to the model. Ideally, the prediction should be performed before the centrifuge test is conducted, according to the definition of class A predictions. However, it is impossible to make true class A predictions for such tests because the true acceleration applied to the model cannot be known in advance. On the other hand, the acutal acceleration data must be used for making class A predictions for the purpose of verifying the numerical methods.
In this research, the soil properties were obtained from other independent laboratory tests performed by The Earth Technology Corp. (1992). The geometry and boundary conditions of the test model were determined before the tests were performed. The only information from the test results used in the numerical predictions was the input acceleration. Therefore, the predictions are really "Class A" predictions. The quotation marks around the term "Class A" denote that the numerical predictions were made, based on the author's honesty in not looking at the test results after the centrifuge tests had been
performed. That is, the predictions were made after the fact; however, the only
information from the test data that was used in the predictions was the acceleration applied to each model.
The dynamic centrifuge model in this research was part of the original proposal for MIT's participation in the research program VELACS (Verification of Liquefaction
Analyses by Centrifuge Studies) sponsored by the National Science Foundation. When the program was modified to include the Class A Prediction exercise, MIT first proposed to offer a similar experiment for that purpose (Figure 4. la), but then withdrew from that exercise when it appeared that it was not possible to define well in advance test conditions
that would yield results worthy of the effort of a prediction. The complex results
presented in this thesis justify that decision. However, one set of "Class A" predictions were undertaken, as described herein, and the data are now available to everyone for the
purpose of Class C predictions.
1.3
SCOPE OF RESEARCH
This research involves four major tasks to investigate the behavior of a retaining wall and a saturated sand behind the wall during earthquakes:
1. Centrifuge Check Test (Chapter 3)
The check test was performed to evaluate the dependence of centrifuge liquefaction test results on the testing facility and experimenter. This is a part of a research project, Verification of Liquefaction Analysis by Centrifuge Studies (VELACS), sponsored by National Science Foundation, in which eight institutions performed similar tests using various geotechnical centrifuges.
2. Dynamic Centrifuge Model Testing (Chapter 4)
This phase involved a series of dynamic centrifuge tests on a model retaining wall supporting a saturated sand. The wall was hinged at the base, and was supported
The plastic extension, which would cause a permanent tilt of the wall, was made possible by a slider in the tie-back system.
3. Numerical Analyses for the Centrifuge Model Tests (Chapter 5)
The primary objective of the numerical analysis is to investigate the applicability of one currently available analytical procedure to study liquefaction problems. A series of "Class A" predictions for the centrifuge model tests were performed using a finite element program, CYCON, which was developed at M.I.T. by Bouckovalas (1982) and Stamatopoulos (1989).
The second objective is to establish a systematic approach to rate the numerical predictions for dynamic geotechnical centrifuge tests. A reasonably strict set of numerical criteria was established to systematically evaluate analytical models for predicting seismic soil behaviors, by comparisons with observations. These criteria were employed to evaluate the numerical predictions with CYCON.
4. Analyses of the Centrifuge Model Tests (Chapters 6 and 7)
The centrifuge model tests were categorized into two types of tests based upon the behavior of the slider: non-slip tests and slip tests. The major aspects of behavior of the model during non-slip tests are earthquake-induced pore pressure changes in the soil and various thrusts acting on the wall from both the pore fluid and the
mineral skeleton. Chapter 6 presents an extensive investigation of these tests. During slip tests, the major concerns are the characteristics of slippage and cyclic tilt of the retaining wall. A lumped-mass-sliding-block model was developed to analyze the slippage and the movement of the retaining wall during the slip tests. These analyses will be presented in Chapter 7.
Chapter 8 presents a summary of this research, recommended considerations for seismic design of earth retaining structures and suggestions for future study.
1.4
UNITS AND SCALES
Units:
The S.I. system of units is used throughout this thesis. Scales:
· The centrifuge tests were performed at a centrifugal acceleration of 50g. Values of length and time in prototype scales are 50 times of those in model scale.
· All dimensions, accelerations, times and stresses are reported in prototype scales. · Forces (in the tie-back) and spring constants discussed in Chapter 7 are reported in
model scale [Newtons]'. Prototype forces and spring constants would be 2,500 and 50 times larger, respectively.
1.5
DEFINITIONS OF SPECIAL TERMS IN THIS THESIS
Some special terms are used throughout this thesis to indicate some specific subjects
related to the behavior of the soil-wall system. The definitions of these terms are
described as follows:
Average Transient Thrust acting on a retaining wall
The average transient earth thrust during an earthquake is the average earth thrust over time, in which the dynamic flutuations are smoothed out. Figure 1.1 shows a typical
average transient earth thrust which is obtained by connecting the averages of the peaks and valleys in the load history. Detailed discussions redarding the average transient earth thrust will be presented in Chapters 6 and 7.
AIY 380 Z 360 H340 300 28O 0 1 2 3 4 5 6 7 8 9 10 Tmre (saoml)
Figure 1.1: Average transient earth thrust in Test a
Plastic Tilt of a retaining wall
The retaining wall may tilt as a result of increase of the thrust acting on it. During a weak earthquake that does not cause a yield of the tie-back system, the permanent tilt of the wall is a result of increase of the thrust acting on the wall, which in turn causes elongation of the spring in the tie-back system. At the end of an earthquake, the wall may tilt somewhat due to increased average transient thrust (accompanied by a pore pressure
build-up). The amount of tilt will decrease after the dissipation of the excess pore pressure. There is a residual tilt (compared to the pre-earthquake position of the wall) which is associated with the residual increment in the static earth thrust. The amount of
this tilt is more or less proportional to the incremental static thrust and is refered as elastic
tilt
During a strong earthquake, the wall's tie-back system may yield temporarily as a result excessive dynamic load (and the increased average transient thrust). The total amount of residual tilt of the retaining wall includes both elastic tilt and plastic tilt. The elastic tilt is due to the incremental static earth thrust. The plastic tilt is due to the yield of the tie-back system during the earthquake. In this research, the plastic tilt of the wall is a result of yield in a tie-back that supports the wall. Therefore, in this thesis, the term
plastic tilt of the wall is directly related to the amount of elongation of the tie-back due to
CHAPTER 2
BACKGROUND
The problem with the behavior of waterfront retaining structures during earthquakes is complicated. The major concern in this thesis is concentrated on the thrust acting on the wall during earthquakes. Section 2.1 reviews some analytical methods for dynamic lateral pressures on the wall from both the soil skeleton and pore fluid within the backfill.
Section 2.2 reviews previous studies on the retaining wall problem by dynamic
centrifuge testing. These studies provide significant insight as to the designing of
centrifuge models of earth retaining structures to simulate key behaviors of such structures during earthquakes.
Section 2.3 reviews the study of liquefaction potential of saturated sands, which is helpful in understanding the characteristics of the liquefiable backfill soil in this research.
Section 2.4 reviews some existing literatures about current numerical models that
predict the behavior of soils during earthquakes. The cited numerical models were
claimed to be effective in predicting some aspects of the soil behavior during earthquakes in some particular cases.
model to estimate the amount of plastic tilt in a model retaining wall during dynamic centrifuge tests.
2.1
ANALYTICAL METHODS FOR DYNAMIC LATERAL
PRESSURES ON RETAINING WALLS
2.1.1 Dynamic Earth Thrust on Retaining Walls
The earliest studies of dynamic lateral earth pressure on a retaining structure were
presented by Okabe (1924) and Mononobe and Matsuo (1929). Their pseudo-static
approach became known as the Mononobe-Okabe equation. The method was developed for dry cohesionless material. This method assumes that the wall tilts sufficiently to produce minimum active earth pressure during earthquakes. Under such a condition, a rigid soil wedge behind the wall may move with the wall during earthquakes. This is an extension of the Coulomb Sliding Wedge Theory modified to account for a lateral
component of acceleration.
Many experiments have been performed on shaking tables to verify this pseudo-static approach. Shaking table and field experiments have been reported by Mononobe and Matsuo (1929), Ishii et al. (1960), Matsuo and Ohara (1960), and Richards and Elms (1979). Dynamic centrifuge tests have also been carried out of verify the Mononobe-Okabe equation by Steedman (1984), Zeng and Steedman (1988) and Anderson (1987). Seed and Whitman (1970) summarized previous experimental studies and commented that the lateral earth pressure coefficients computed for a cohessionless backfill using the Mononobe-Okabe equation are in reasonable agreement with the model test observations. They proposed a simplified Mononobe-Okabe equation as
1 3
APE 2-yH2 *-kh (2.1)
2 4
and PE 1YH2(KA +3 kh) (2.2)
where APAE and PAE are the dynamic and total thrust acting on the wall at peak acceleration, respectively; y is the unit weight of the backfill soil; H is the thickness of the
backfill; and kh (= amax/g) is the coefficient of horizontal acceleration.
This force was originally assumed to act at 1/3 H from the base of the wall. However, various experimental shaking table tests on model retaining walls have shown the resultant force acts above the 1/3 point (Seed and Whitman, 1970). Seed (1969) has recommended that the dynamic component in the Mononobe-Okabe force be placed at 0.6 H above the base for design of vertical walls with horizontal dry backfill. This point of action of 0.6 H is a bit conservative for the purpose of designing a retaining wall. Sherif et al. (1981, 1982) performed a series of shaking table tests and concluded that the point of action of the earth thrust is at approximately 0.4 H above the base. Steedman and Zeng (1990) further showed that the point of action is above the 1/3 point when there is a phase change of the lateral acceleration in the backfill. Steedman (1984) assumed a height of 0.5 H. This height is more realistic in analyzing dynamic retaining wall problems.
2.1.2 Hydrodynamic Pressures on Retaining Walls
Westergaard (1933) developed a pseudo-static approximation for the change of water pressures during an earthquake for the case of a straight dam with a vertical up-stream face. The result of the Westergaard analysis is: the pressures are the same as if a
remainder of the reservoir is left inactive. A parabolic dynamic pressure distribution, Pwd, is proposed as
Ap = khYw wH (2.3)
where Yw is the distance below the water table. The resultant hydrodynamic thrust is
7
APu=- lkhyWH2 (2.4)
acting at an elevation equal to 0.4H above the base of the pool.
The Westergaard approximation, Eq. (2.4), sometimes is used to estimate the thrust from pore water behind a vertical retaining wall' (Ebeling et al., 1992). However, due to the soil's permeability and inclination of the retaining wall, some modification to the Westergaard equation may be desirable (Matsuzawa et al., 1985).
Zangar (1953) presented an approximate solution for hydrodynamic water pressure against an inclined wall surface. Chwang (1978) developed an analytical solution that is close to Zangar's approximation as follows:
Pwd = CkhYwH, with C = 2 [ (2- ) + 2- )] (2.5)
in which Cm is a parameter related to the inclination angle and can be approximated as 3c
Cm = 4 /2 where a is the angle (in radians) between the backfill face of the wall and the
horizontal base away from the backfill. When the wall is vertical, a = /2, Zangar's
Christian (1993) indicated that a reduced (70%) hydrodynamic thrust in Eq. (2.4) is often used in practice.
approximation is about the same as the Westergaard's approximation between H/3 and
2H/3 above the base2and is slightly smaller elsewhere.
2.1.3 Dynamic Earth Pressures From a Saturated Backfill
Ishibashi and Madi (1990) proposed three methods to analyze the dynamic thrust acting on quaywalls based on case studies:
A. to use the traditional Mononobe-Okabe's dynamic lateral earth pressure
B. to use modified Mononobe-Okabe's in terms of the point of application of the resultant force depending upon wall movement modes and to use generalized apparent seismic coefficient and partial dynamic water pressure depending on the backfill soil's permeability
C. to apply dynamic liquid soil pressure against the backfill face of the wall.
They applied these analytical methods to study the stability of three types of quaywalls. Their case studies show that method (C) provided the lowest safety factors.
2.1.4 Influence of Phase on Earth Pressure Calculation
The results of dynamic centrifUge tests performed by Anderson (1987) showed clear phase changes in the lateral acceleration in the backfill soil as shear waves propagated from the base of the soil model towards the ground surface. Zeng (1990) also observed a similar pattern of phase change in the ground acceleration in their centrifuge model tests.
Steedman and Zeng (1990b) proposed an analysis that takes into account a finite shear wave velocity in the backfill, thus allowing for a phase change in a prototype structure. The phase change does not have a significant influence of the total earth pressure, but it has a marked effect on the distribution of the dynamic increment. The resultant pressure is shown to act at a point above one third of the height of the wall.
2.2
DYNAMIC CENTRIFUGE MODELING OF EARTH
RETAINING STRUCTURES
Centrifuge testing of dynamic problems has been widely employed by geotechnical
investigators in a variety of test configurations (Schofield, 1981). In recent years,
centrifuge model tests have become extremely popular in the study of the behavior of soil deposits and structures supported by or retaining the soil. The centrifuge modeling technique has been shown to be a useful tool for development and verification of analytical models, especially in the subject of earthquake engineering where detailed field evidence is
in shortage (Kutter, 1984).
Dynamic centrifuge testing has been applied to investigate the behavior of retaining structures during earthquakes (Steedman, 1984; Anderson, 1987; Pahwa et al., 1987; Kutter et al., 1990; Vucetic et al, 1993; Zeng, 1990). The techniques and experiences of modeling retaining structures developed in these dynamic centrifuge tests are valuable for the planning of subsequent tests.
2.2.1 Cantilever Retaining Wall
Steedman (1984) conducted a series of cantilever retaining wall experiments with dense, dry sand backfill on the Geotechnical Centrifuge in Cambridge, England. The static deflections and bending moments of these walls were found to be consistent with a triangular stress distribution. The lateral stress ratios indicated that the static rotations of the walls were sufficient to cause active failure. Measured dynamic forces were found to be in agreement with the estimation using the Mononobe-Okabe equation. The resultant height was assumed to be at 0.5H. Plastic deformations of the retaining walls occurred with stronger earthquakes.
Zeng (1990) performed 9 centrifuge tests on quay walls carried out at the Cambridge Geotechnical Centrifuge. The tests involved models of free cantilever walls and anchored cantilever walls supporting dry or saturated backfills of Leighton-Buzzard 52/100 sand prepared at various relative densities (ranging from about 40% to about 90%). In saturated tests, the soil models were saturated or submerged with silicone oil that reduced the time scale for consolidation to 1/N during the centrifuge tests.
Based on Zeng's saturated tests, Steedman and Zeng (1990a) showed that an initially stiff soil-wall system may deteriorate towards failure as strain softening is brought about by dynamic amplification or pore pressure build-up.
test results and and obtained some findings regarding the soil thrust acting on the wall during earthquakes. The major findings obtained from Anderson (1987) and Al-Homoud (1990) are summarized as follows:
I. Phasing
The most important observation is the phase relation between the ground
accelerations and the dynamic earth thrust acting on the wall. Anderson's (1987)
observations show that the earth force was about 1800 out of phase with the lateral acceleration field tests with firm foundation soils, which is opposite to the assumption of the Mononobe-Okabe equation. Al-Homoud's (1990) finding shows that the measured earth thrust was approximately in phase with the wall movement: the minimum earth force occurred at the time of maximum outward tilt in the wall, while the maximum earth force occurred at the time of maximum inward tilt in the wall.
H. Dynamic Earth Thrust
The vertical position of the dynamic earth thrust was approximately 0.58 H above the wall base. This point of action was close to the value of 0.6 H suggested by Seed (1969).
Il. Wall Movement
The rotational stiffness of the wall deteriorated with increasing outward tilt in the wall. This deterioration was due to the accumulation of outward wall tilt during successive cycles of strong shaking and the fact that there is an ultimate capacity of the resisting moment.
2.2.3 Amplification of Peak Acceleration
Much evidence (from both field and laboratory observations) show that the lateral ground acceleration is amplified as shear waves propagated from the base of the soil stratum. This information suggests that awareness should be paid to the amplification of
ground acceleration in dynamic centrifuge tests. Some typical evidence from field
observations and centrifuge model test results are listed as follows:
I. Field Observations
Seed and Lysmer (1980) presented data of maximum accelerations observed at different depths during the Tokyo-Higashi-Matsuyama earthquake of July 1, 1968. The data showed that the peak accelerations observed at the surface were about twice as large as those measured at a depth of about 10 m. Evidence from the Humbolt Bay Power Station during the 1975 Ferndale earthquake showed that accelerations at the surface were 2.3 times those at a depth of 24 m.
Seed et al. (1992) presented the strong motion data of the seismic response of soft and deep clay sites obtained during the 1989 Loma Prieta Earthquake. This article shows the ground surface acceleration data measured at various locations. The acceleration observed at Yerba Buena Island, a large, rocky outcrop near the center of the San Francisco Bay, was viewed as the input ground acceleration at the bed rock. The
acceleration data obtained at four soft clay3 recording sites showed amplified ground
surface accelerations. The peak acceleration at the surface of soft clay was three to four times the peak acceleration of the bed rock.
II. Dynamic Centrifuge Test Results
Steedman (1984) demonstrated the evidence of amplifications of peak ground accelerations, at various depths in dry sand models during dynamic centrifuge tests. The amplifications of ground acceleration at surface in dry sands were also observed during the
centrifuge tests conducted by Anderson (1987).
2.2.4 Belleville Disc Washers to Model Foundation Soils
The dynamic behavior of a realistic retaining wall is tangled with two types of interaction between the wall and the soil:
. the interaction between the wall and the backfill soil . the interaction between the wall and the foundation soil.
Clearly, the first one is the primary interaction. In the past few years, MIT's concentration was on the interaction between the wall and the backfill soil. Anderson (1987) used Belleville disc washers to model the stiffness of the foundation soils in his dynamic centrifuge tests, so that the interaction between the wall and the foundation soil was simplified.
The washers are conically shaped discs that can be stacked on top of each other. By varying the arrangement of these washers, one can obtain various load deflection characteristics of each stack of washers. In Anderson's model, the resistance to rotation of the wall was provided by two stacks of the disc washers. The load-deflection relationships
The application of Belleville disc washers in centrifuge tests was an experimental advance in the field of dynamic centrifuge modeling. Disc springs function best under high load conditions in confined space. Springs composed of these disc washers are adequate for use in centrifuge testing. In this research, the author applied disc springs to provide
both elastic and plastic4 characteristics of a model retaining wall.
2.3 LIQUEFACTION POTENTIAL OF SATURATED SANDS
Dobry et al. (1981) showed that the liquefaction potential of a saturated sand depends on both the characteristics of the seismic shaking and of the soil. Their evidence indicated that overconsolidated sands have a larger resistance to liquefaction than normally consolidated sands. They reviewed a series of strain-controlled cyclic tests and showed the following:
1. There is a threshold cyclic shear strain for pore pressure build-up of 10-2% for normally consolidated sands. That is, there was no excess pore pressure in tests with cyclic shear strain smaller than 10-2%.
2. Overconsolidation increases the value of the threshold strain from 10-2 % to about 3 x 10⁻²%.
3. A heavily overconsolidated sand develops much less pore pressure at a cyclic strain, 0.05%, than the same sand when normally consolidated.
It was suggested that heavily overconsolidated sands subjected to ground accelerations of 0. 15g will probably not liquefy because of the combined effects of larger
shear modulus in the field, a larger threshold strain and a smaller pore pressure build-up for a strain somewhat above the threshold.
2.4
NUMERICAL MODELS FOR SANDS DURING
EARTHQUAKES
Various numerical models for dynamic analysis of earth structures have been developed during the past fifteen years. There are wide variations in basic principles of these analysis procedures. Whitman (1992) made an extensive review of many of the numerical techniques. Some of these techniques and other currently available codes are described as follows.
2.4.1 Fully Coupled Analyses
The code DYNAFLOW developed by Prevost (1981) is based upon a constitutive model involving a concept of multi-yield surface plasticity, with a linearized hyperbolic backbone curve for the stress-strain relations during loading, unloading and reloading. Segments of the backbone curve are fitted to stress-strain curves observed in monotonic loading tests for the particular soil. Fundamental studies on soils were applied in establishing the shapes of yield surfaces. The flow rule associated with the yield surface provides the inelastic volume strain, and hence pore pressure changes. Validation has been achieved through comparisons between calculations and centrifuge test results, although this information is not generally available in the literature (Whitman, 1992).
Elgamal et al. (1985) described an analysis based upon Prevost's constitutive model and applied it to the case of La Vallita Dam (Elgamal et al., 1990). The results suggest that dispersed plastic deformation is less important than concentrated slip.
Another fully coupled analysis, DYSAC2 (Muraleetharan, 1990), was claimed to be successful in predicting the acceleration and pore pressure time-histories of level ground stratified soil deposits composed of a sand layer overlain by a silt layer (Arulanandan et al., 1992).
2.4.2 Partially Coupled Analyses
Finn et al. (1977) developed a nonlinear dynamic effective stress response analysis for level ground condition. The analysis was implemented in programs DESRA (Lee and Finn, 1975; 1978) and TARA. The latest versions of the computer code TARA are known as TARA-3 and TARA-3FL (Finn et al., 1986). The soil response is modeled by combining the effects of shear and normal stresses. In shear, the soil is treated exactly as in the level ground analysis where it is considered as a nonlinear hysteretic material during unloading and reloading. The shear stress-strain behavior is characterized by a tangent shear modulus which depends on the shear strain, the state of effective stress, and the previous loading history.
Siddharthan (1984) extended the Finn model to include the effects of initial static shear stress. The pore water pressure is computed in two steps. First, the "apparent" plastic volume change is evaluated from the shear strain history of an element. The
is to estimate the rebound modulus and multiply it by the increment in volume change to determine the increment in pore water pressure.
Siddharthan (1984) reported a validation study on a series of seismic tests on
centrifuge models. These tests were conducted on the Geotechnical Centrifuge at
Cambridge University, England. Finn and Siddharthan (1984) showed that the recorded acceleration response and the response computed by the program TARA were in remarkable agreement.
2.4.3 Uncoupled Analyses
The Residual Strain Method (RSM) (Bouckovalas et al, 1984, 1991; Stamatopoulos and Whitman, 1987) is an uncoupled analysis that predicts the behavior of sands during earthquakes and earthquake-induced permanent deformations of foundations resting on sands. The program CYCON is an application of the RSM, a semi-empirical model, which computes the permanent strains and pore pressures from viscoelastic constitutive equations where time has been replaced by the number of load cycles (Bouckovalas, 1982). The constitutive parameters dependent upon the soil properties, the initial stresses and dynamic stress amplitudes, and they can be obtained from common static and cyclic laboratory tests on the particular soil. Computations focus upon displacements and pore pressures at the end of one or more load cycles.
The RSM was originally developed to analyze cyclic loading of offshore foundations on sands, under drained or undrained conditions (Bouckovalas et al., 1984, 1986). Recently, the method was extended to partially drained cyclic loading (Bouckovalas et al., 1991). In addition, research was invested to improve the accuracy of the semi-empirical
constitutive equations and fit the method to specific needs of earthquake-related applications (Stamatopoulos et al., 1991). CYCON was used in this research to predict the pore pressure behavior of a backfill behind a retaining wall as well as the tilt of the wall due to various earthquakes. The results of the numerical prediction and the evaluation of the predictions will be presented in Chapter 5. A brief review of the residual strain method will also be described in Chapter 5.
2.5 SLIDING BLOCK MODEL FOR THE PERMANENT
MOVEMENT OF A RETAINING WALL
Newmark (1965) first introduced the block-on-an-inclined-plane model to evaluate seismically-induced displacements along the slopes of earth dams. The features of the Newmark's sliding block approach are as follows.
1. The permanent displacement induced during the seismic motion is accumulated through a series of slips along a well-defined yielding (sliding) surface in the soil. Slip starts when the inertia force of the upper soil wedge exceeds the shear strength along the sliding surface. When the relative velocity between the sliding wedge and the underlying dam body becomes zero, the slip ceases.
2. The material along the sliding surface is treated as rigid-plastic. The occurrence of slippage is characterized by a yield acceleration (a limiting ground acceleration
above which sliding takes place), Ac. Sliding takes place when the ground
acceleration exceeds this limiting acceleration.
has been studied by Lin and Whitman (1983). This was accomplished by analyzing the response of a multi-degree of freedom mass-spring-slider system instead of calculating the response of an intact structure and then using that response as input to a mass-slider system. Newmark's sliding block approach has gained considerable popularity because of its simplicity. This approach will be used in Chapter 7 to analyze the seismically-induced tilt of a retaining wall with a tie-back that yielded temporarily during cyclic loading.
Richards and Elms (1979) used Newmark's sliding block concept to develop the first systematic approach to the seismic design of gravity retaining walls supporting dry cohesionless soils. The wall plus the soil wedge is treated as a rigid block, with the maximum transmittable acceleration determined by frictional resistance at the base of the wall plus the shear resistance along a failure plane through the soil. Whitman and Liao (1985) investigated factors affecting the choice of a suitable safety factor for use with the Richards-Elms method: errors in the use of a sliding block to represent a retaining wall and associated backfill, near-randomness in time-histories of earthquake ground motion and uncertainty in strength parameters. They developed a systematic approach for treating these uncertainties. Whitman (1990) developed new design rules for gravity walls based on the insights from the above analyses.
The above studies were concentrated on the outward sliding of a gravity wall. However, field observations suggest that, where there have been significant movements of gravity walls during earthquakes, rotations of the wall about their base has been important (Whitman, 1990). The behavior of tilting walls has, until very recently, received relatively little study.