RUGC 2020 AJCE, vol. 38 (1)
205
Apparent and complex viscosity versus the
water content of clay
Hongwei WANG1,2,Rachid ZENTAR1, Dongxing WANG2
1 Department of Materials and Processes, , IMT-Lille-Douai, ULR 4515, Laboratoire de Génie Civil et géo-Environnement (LGCgE), Douai, F-59500, France
2 School of Civil Engineering, Wuhan University, 430072 Wuhan, People’s Republic of China
ABSTRACT The objective of this paper is to investigate the viscosity characteristics of fine-grained material (typically clay). A series of laboratory tests were conducted using MCR 102 rheometer to investigate the viscosity properties of the material under steady and dynamic conditions. The results indicate that the apparent viscosity at the same shear rate of Kaolinite is highly dependent on the shear rate and the W/S ratios, it decreases as the shear rate and the W/S ratios increase. In the considered frequency range, the complex viscosity of different W/S ratio sample have a nearly parallel linear trend in a log-log scale, and the complex viscosity sharply decreases with the frequency increasing.
Key words Kaolinite, Sediments, Rheology, Apparent viscosity, Complex viscosity.
I. INTRODUCTION
Sediments are commonly found in lake beds, river beds, or coastal seabed. They are cohesive material which contains predominantly clay minerals, water, organic matter silt, and sand. However, for coastal management, sediment accumulation in the port or river may hinder navigation but also induce several problems during removal (as by dredging) (Yang et al., 2018). Thus, the determination of the rheological properties of cohesive fine sediment, especially the viscosity of cohesive fine sediment is an important issue. Moreover, during the study of the sediment transport, when subjected to oscillatory shear by water waves, or simple shear by the current (Shakeel et al., 2019; Jeong et al., 2007; Bala et al., 2007) is an interesting subject. Prior to studying sediments which could be considered to some extent a complex material (presence of organic matter, silt …), a first study based on studying a well-known material is engaged.
The main objective of this research is to evaluate the change of viscosity of well-known fine-grained material (typically kaolinite) with Water to Solid (W/S) ratios under steady and dynamic conditions. In the second step of this work (not included in this paper), the same protocol on dredged sediment will be performed. The results of the present study will help in explaining the observed results on the dredged sediment.
RUGC 2020 AJCE, vol. 38 (1)
206 II. MATERIALS AND METHODS
2.1 Materials
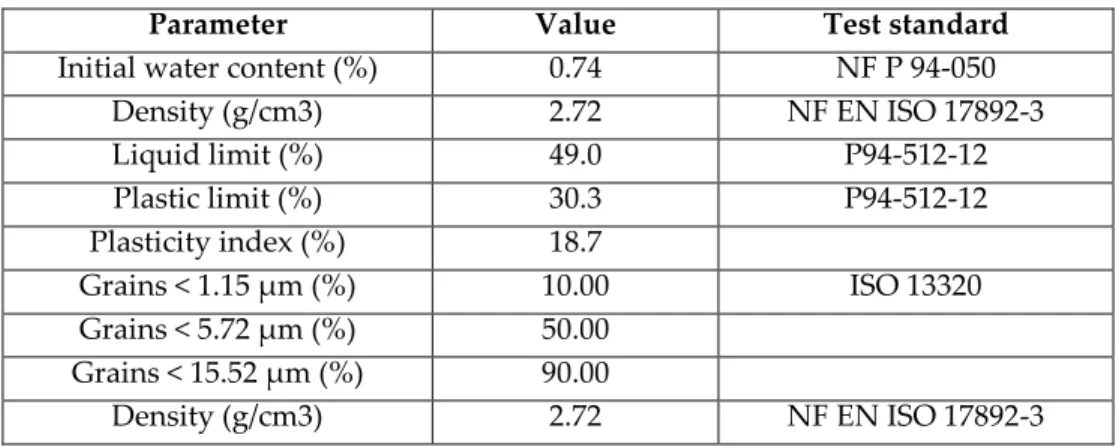
The Physical characteristics of the Kaolinite used in this study (in the form of manufactured powder) are reported in Table 1 and Fig 1. The initial water content is 0.74%, measured according to test standard NF P 94-050. The true density, measured using a helium pycnometer, was 2.72 g/cm3. The liquid limit and plastic limit, defined by the percussion-cup method and the rolling thread method according to test standard P94-512-12, are respectively 49.0% and 30.3%. The test results induce a plasticity index of 18.7 %. The results for particle size distribution of the raw Kaolinite show that the d50 is about 5.7 µ m. This denotes the high fineness of the material used in
this study.
TABLE 1. Physical characterization of sediments
Parameter Value Test standard
Initial water content (%) 0.74 NF P 94-050
Density (g/cm3) 2.72 NF EN ISO 17892-3 Liquid limit (%) 49.0 P94-512-12 Plastic limit (%) 30.3 P94-512-12 Plasticity index (%) 18.7 Grains < 1.15 μm (%) 10.00 ISO 13320 Grains < 5.72 μm (%) 50.00 Grains < 15.52 μm (%) 90.00 Density (g/cm3) 2.72 NF EN ISO 17892-3 2.2 Methods
The rheological characterization was performed using an Anton Paar MCR 102 rheometer with parallel plates. The rheometer is characterized by high precision and accuracy. The preparation of samples was conducted by mechanically mixing the kaolinite clay powder with tap water at different water to solid (W/S) ratios of 1.0, 1.2, and 1.4.
The static shear test condition to measure the apparent viscosity (η) of the sample is of type Controlled Strain Rate (CSR) test. The whole test procedure includes two stages: the first stage consists of pre-shearing the sample with a high shear strain rate (100 s-1 for 100 s) to homogenize
the sample and to remove any build-up structure of the kaolinite. After this first pre-shearing, the shear rate was increased in steps from 0.001 to 100 s-1 draw the apparent viscosity-shear rate curve
for the material.
Then the frequency sweep oscillatory tests were carried out at the same W/S ratios (1.0, 1.2, and 1.4) samples and the linear visco-elastic domain (LVED). First, have a pre-shearing for 100 s at the high shear rate of 100 s-1, then the frequency was increased in steps from 0.07 to 100 rad/s. This
allowed monitoring the evolution of the complex viscosity (η*) in a non-destructive regime.
RUGC 2020 AJCE, vol. 38 (1)
207 3.1 Apparent viscosity
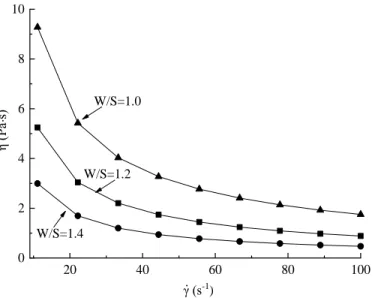
In Fig. 1 the apparent viscosity, defined as the ratio of the shear stress to the corresponding shear strain rate, versus the shear strain rate is reported. From Fig. 1, it can be seen that the apparent viscosity shows a rapid decrease at low shear rate range (0 - 40 s-1), and then a slow decrease at
higher shear rate (40 - 100 s-1) within the measured interval. Moreover, for a given shear strain
rate, the apparent viscosity decrease with the increase of the W/S ratio. This result indicates that the Kaolinite samples with lower water content are deformed more slowly under the same shear strain rate than samples with higher water content. Furthermore, the samples showed a strong shear shinning rheological behavior.
20 40 60 80 100 0 2 4 6 8 10 W/S=1.0 W/S=1.2 W/S=1.4 . .γ (s-1 ) η (P a s )
FIGURE 1. Apparent viscosity - shear rate curves of different W/S ratio samples.
3.2 Complex viscosity
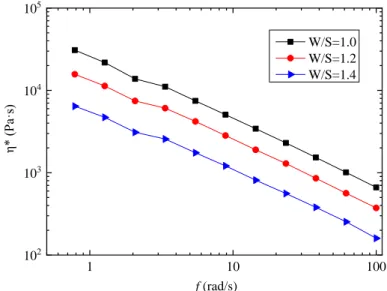
Fig. 2 shows the variations of the complex viscosity (η*) with the frequency for all samples. From Fig. 2, it can be concluded that the complex viscosity sharply decreases with the frequency increasing. And the complex viscosity curves for all samples have a nearly parallel linear trend on a log-log scale. Moreover, Fig. 2 also demonstrates that the complex viscosity decrease with the increase of the W/S ratio at the same frequency.
IV CONCLUSION
Three samples with the W/S ratios of 1.0, 1.2, and 1.4 are used to study the viscosity properties of the kaolinite by the Anton Paar MCR 102 rheometer. Based on the analysis of the results, the following conclusions can be obtained:
(I) The apparent viscosity at the same shear rate of Kaolinite is highly dependent on the shear rate and the W/S ratios, it decrease as the shear rate and the W/S ratios increase.
RUGC 2020 AJCE, vol. 38 (1)
208 (II) In the considered frequency range, the complex viscosity of different W/S ratio sample have a nearly parallel linear trend in a log-log scale, and the complex viscosity sharply decreases with the frequency increasing. 1 10 100 102 103 104 105 η* ( Pa·s) f (rad/s) W/S=1.0 W/S=1.2 W/S=1.4
FIGURE 2. The complex viscosity as a function of the frequency
Acknowledgements
This research was undertaken with the financial support of CSC (China Scholarship Council) and the support of IMT Lille Douai.
REFERENCES
Yang, W., Yu, M., & Yu, G. (2018). Stratification and rheological properties of near-bed cohesive sediments in West Lake, Hangzhou, China. Journal of Coastal Research, 34(1), 185-192.
https://doi.org/10.2112/JCOASTRES-D-16-00182.1
Shakeel, A., Kirichek, A., & Chassagne, C. (2019). Rheological analysis of mud from Port of Hamburg, Germany. Journal of Soils and Sediments, 1-10. https://doi.org/10.1007/s11368-019-02448-7 Jeong, S. W., Locat, J., Leroueil, S., & Malet, J. P. (2007). Rheological properties of fine-grained sediments in modeling submarine mass movements: the role of texture. In Submarine Mass Movements and Their Consequences (pp. 191-198). Springer, Dordrecht.
Bala, M., Zentar, R., & Boustingorry, P. (2019). Comparative study of the yield stress determination of cement pastes by different methods. Materials and Structures, 52(5), 102. https://doi.org/10.1617/s11527-019-1403-4