First International Conference on Bio-based Building Materials June 22nd - 24th 2015 Clermont-Ferrand, France
MECHANICAL PROPERTIES OF UNSTABILIZED EARTH COMPRESSED AT
HIGH PRESSURES
A.W. Bruno1*, D. Gallipoli1, C. Perlot1, J. Mendes1, N. Salmon2 1Université de Pau et des Pays de l’Adour, Anglet, France
2Nobatek, Anglet, France
*Corresponding author; e-mail: agostinowalter.bruno@univ-pau.fr
Abstract
Earthen construction is attracting the interest of civil engineers because of its “green” credentials of limited environmental impact and energy efficiency over the life cycle of buildings. Yet, the adoption of earthen materials in mainstream construction is hindered by serious drawbacks including relatively low strength and water infiltration. Among all earthen materials, compressed earth blocks are the most popular option because of the flexibility of the building process and the possibility to employ standard masonry construction techniques. Compressed earth blocks are currently produced by compacting moist soil inside a mould under pressures that range from 5MPa to 25MPa. This pressure is applied for few seconds, which is too short to allow full dissipation of the excess pore water pressures generated during compaction. In this paper, we propose an alternative compaction method that significantly improves the mechanical properties of compressed earth without resorting to chemical binders. A compaction pressure of up to 100MPa, higher than the pressures currently used, is applied and maintained constant for a longer period of time to allow consolidation of the soil. The attainment of high effective stresses increases the dry density of the soil and changes the material fabric in such a way that mechanical properties are highly enhanced [Olivier 1986; Houben 1994; Kouakou 2009]. Compressed earth samples were prepared according to the proposed compaction method at different water contents as to determine the compaction curves corresponding to different compaction pressures. After compaction, specimens were stored in a climatic chamber at constant temperature and humidity (25°C and 62%) until equalization. Unconfined compressive tests were subsequently performed on the equalized samples to investigate the effects of compaction pressure and dry density on stiffness and strength. The adopted compaction method resulted in mechanical properties that can compete with those of stabilized earth and standard masonry bricks.
Keywords:
Compressed earth; Soil compaction; Young modulus; Compressive strength.
1 INTRODUCTION
Energy costs associated to the construction and operation of buildings are among the highest across all areas of human activity. The development of sustainable construction practices is therefore essential to comply with current targets for reducing carbon emissions and energy consumption worldwide. In this respect, the use of sustainable and energy-efficient construction materials, which can replace conventional energy-intensive options, is being explored and the use of compressed earth is one of the most promising possibilities. Earth can be locally sourced [Morel 2001] and, when used without addition of chemical stabilizers, it is an entirely renewable material that generates limited demolition waste. Moreover, the hygroscopic properties of earthen materials allow buildings to “breathe” by absorbing or releasing ambient moisture depending
on room humidity. In addition, condensation or evaporation of water inside earthen walls generates exchanges of latent heat, which helps regulating temperature of interiors. Earthen buildings therefore require little energy for air conditioning of the indoor space [Allinson 2010] and offer a very high quality ambience for occupants without involving additional energy costs [Pacheco-Torgal 2012].
Despite these benefits, the relatively poor strength and stiffness of earthen materials have impeded the diffusion of this construction technique beyond a very niche market. One possible solution that has been tried over past years is to “stabilise” earthen materials by adding chemical binders (i.e cement or lime) in order to improve both mechanical and durability properties [Walker 2000; Jayasinghe 2007]. This, however, lessens the “green” attributes of earthen materials as it increases levels of embodied energy and reduces the possibility of recycling demolition waste.
Current construction of compressed earth blocks is mainly based on empiricism and heuristic knowledge. The purpose of this study is to complement existing empirical knowledge with a scientific basis that relies on soil mechanics principles. We show that the choice of an appropriate method of soil compaction improves the mechanical properties of earthen materials up to levels that are comparable with those of compressed earth stabilized by addition of cement or lime.
The proposed compaction method is based on two well-known geotechnical principles:
1) The stress applied on a saturated soil volume coincides with the effective stress acting on the solid skeleton only if the excess pore water pressures generated during loading are dissipated. In turn, excess water pressures are dissipated only if the soil is allowed to consolidate, i.e. if pore water is allowed to drain under constant load.
2) The dry density of a soil volume increases as compaction energy increases. Therefore higher compaction pressures generally correspond to improved mechanical properties.
By exploiting the above two simple principles, we have produced compressed earth blocks with excellent mechanical properties. This can help to overcome some of the historical drawbacks that have hindered the dissemination of this construction technique across current practice.
2 MATERIAL AND METHODS 2.1 Material
The soil used in the present work has been provided by a brickwork factory from the region of Toulouse in France. Table 1 show some of the relevant properties of the soil. The grain size distribution has been determined by both wet sieving and sedimentation in compliance with the norms XP P94-041 [AFNOR 1995] and NF P 94-057 [AFNOR 1992]. The plasticity properties of the fine fraction, i.e. of the soil fraction smaller than 400µm, have been measured in agreement with the norm NF P94-051 [AFNOR 1993]. In particular, the liquid limit, plastic limit and plasticity index have been determined as the average of four independent tests. Finally, the specific gravity of the solids has been obtained by means of the pycnometer test and according to the norm NF P 94-054 [AFNOR 1991].
The grain size distribution and the plasticity properties of soils used for earthen construction must fulfil specific requirements [Jiménez Delagado 2007]. For example, Fig. 1 shows the grain size distribution of the soil used in the present study (thick line with markers) in comparison with the lower and upper limits prescribed by three guidelines for compressed earth blocks [AFNOR 2001; CRATerre EAG 1998; MOPT 1992]. The French norm XP P13-901 [AFNOR 2001] coincides with the guidelines provided by the association CRATerre in collaboration with the School of Architecture of Grenoble [CRATerre EAG 1998]. Inspection of Fig. 1 indicates that the grain size distribution of the soil used in the present work lies close to the limit on the finer side of the admissible region.
Table 1: Main material properties
Grain size distribution
Gravel > 2 mm 0.4 % Sand 0.063 – 2 mm 40.4 % Silt 0.002 – 0.063 mm 42.9 % Clay < 0.002 mm 16.3 % Plasticity properties Liquid limit, wL (%) 33.0 % Plastic limit, wP (%) 20.1 % Plasticity index, Ip (%) 12.9 % Activity A (-) 0.79
Specific gravity of soil solids
Gs (-) 2.66
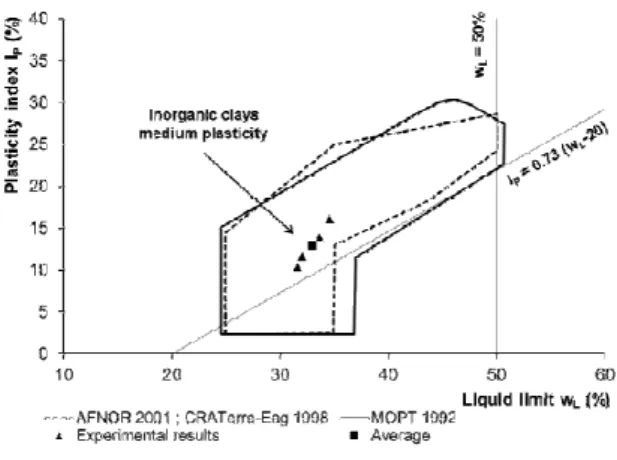
Moreover, in unstabilized compressed earth (i.e. compressed earth without addition of cement or lime), the fine soil fraction plays the role of binder between larger grains [Kouakou 2009] and must therefore satisfy specific requirements to ensure the desired level bonding. Fig. 2 shows that the fine fraction of the present soil is classified as inorganic clay of medium plasticity according to USCS (Unified Soil Classification System) and falls within the admissible region for compressed earth blocks.
Fig. 1: Grain size distribution
The clay activity, defined as the ratio between the plasticity index and the clay fraction (i.e. the soil fraction smaller than 2µm), is equal to 0.79. This means that the clay fraction of the present soil is classified as normally active [Skempton 1953], which is consistent with mineralogy information from the soil provider that indicate that the clay fraction is predominantly illitic with a small quantity of montmorillonite. Illitic clays are three-layers clays which show limited swelling upon wetting. This is the most desirable type of clay for earthen construction as it provides a good level of bonding between soil grains without causing large changes in volume when exposed to water [Dierks 2002].
Fig. 2: Plasticity chart
2.2 Compaction method and sample preparation Earthen samples were compacted at the three pressure levels of 25 MPa, 50 MPa and 100 MPa. The lowest compaction pressure is comparable to that applied by the most powerful presses available on the market. The other two values are obtained by a geometrical progression with a ratio of two and are significantly higher than the pressure levels used during conventional production of earth blocks. Prior to compaction, 500 gr of dry soil were mixed with the desired amount of water by means of an electrical planetary mixer for at least 15 minutes [Kouakou 2009]. This time is sufficient to ensure good homogeneity of moisture throughout the soil mix. The moist soil is subsequently placed inside two plastic bags to prevent loss of water and is left to rest for at least one day to allow equalization of water pressures and redistribution of moisture inside the soil. After this, the moist soil is placed inside a cylindrical mould of 50 mm diameter, where it is vertically compacted at the required pressure by using a load-controlled Zwick press with a capacity of 250 kN.
A careful design of the compaction mould is necessary to satisfy two requirements:
1)
The mould must be strong enough to withstand the high pressures exerted by the soil compressed inside it.2)
The mould must allow water to drain out as easily as possible from the soil under load. This is necessary because, as the pore volume reduces during compression, soil voids may become water saturated with consequent generation of excess pore water pressures. In order for the applied stress to be converted into effective stress, excess pore water pressures must be dissipated during a consolidation phase when water drains out of the soil subjected to constant load. The duration of the consolidation phase depends on the permeability and stiffness of the compacted soil but also on the length of water drainage paths.The mould used in this work consists of a hollow stainless steel cylinder with an external diameter of 170 mm, an internal diameter of 50 mm and a height of 200 mm (Fig. 3). The mould thickness is therefore equal to 60 mm, which is enough to withstand the lateral pressure exerted by the soil during compaction with a good safety margin. The soil is vertically compressed inside the mould by two
cylindrical aluminium pistons acting at the top and bottom of the sample. This double-piston compression reduces the effect of friction between the mould and the sample, thus increasing uniformity of stress levels inside the soil.
Two perforated aluminium disks are also placed between the top and bottom surfaces of the sample and the respective pistons to facilitate drainage of pore water during consolidation. Each disk is perforated by 17 circular holes of 2 mm diameter. Filter papers are located between the soil and the perforated disks, as well as between the perforated disks and the pistons in order to further help water drainage. Finally, eight longitudinal grooves are cut along the lateral surfaces of the two pistons to create a preferential path for water drainage between the outer surface of the pistons and the inner surface of the mould (Fig. 3).
The above design eases drainage of pore water during compaction and accelerates consolidation times. Note that the pistons and the perforated disks have a diameter of 49.5 mm, which is only slightly smaller than the mould diameter of 50 mm. They therefore fit tightly inside the mould with a tolerance of about 0.25 mm, which is small enough to prevent any extrusion of soil during compaction.
The procedure for assembling the mould and compacting the soil is detailed as follows:
The mould is sited on the bottom plate of the Zwick press. A solid aluminium disk (49.5 mm diameter and 10 mm thick), a filter paper, a perforated disk (49.5 mm diameter and 10 mm thick) and another filter paper are inserted, in this sequence, at the bottom of the mould.
The moist soil mix is scooped inside the mould in four layers, with each layer equal to one fourth of the total mass of the mix. In order to reduce the height of the soil inside the mould, a small compaction stress of about 5 MPa is applied to each layer before adding the next amount of soil. It is important to scratch the upper surface of the last compacted layer before adding the next amount of soil in order to ensure good adherence between layers.
A filter paper, a perforated disk (49.5 mm diameter and 10 mm thick), another filter paper and a piston (49.5 mm diameter and 90 mm high) are placed, in this sequence, on top of the soil. About 80% of the target compaction pressure is
applied for few seconds to the soil in order to make sure that the sample sticks to the inner surface of the mould. This is necessary to ensure that the mould can be subsequently lifted without causing the soil to fall out of it.
The entire system is turned upside down inside the Zwick press and the solid aluminium disk is replaced with a piston (49.5 mm diameter and 60 mm high). Fig. 3 shows the equipment in this configuration just before the start of compaction. A compaction pressure is applied to the soil at a
rate of 5 MPa/s until the target value is attained. The target pressure is then kept constant while vertical displacements are recorded until the end of consolidation.
Fig. 3: High pressure compaction set-up
The duration of consolidation increases as water content and compaction pressure increase. Consolidation is assumed to be complete when the vertical displacement rate falls below 0.01 µm/s. This rate is measured as the slope of the straight line that fits the final part of the displacement-time curve over a period of at least one hour (Fig. 4).
Fig. 4: Typical vertical displacement versus time curve
After compaction, each sample was cut to a height of 100 mm by trimming excess soil from both top and bottom. The water content of the trimmed soil was measured as specified in the norm NF P 94-050 [AFNOR 1995] by drying in an oven at 105°C until soil weight became constant. Generally, the values of water content obtained from the top and bottom extremities of the sample are very similar suggesting that moisture is uniform across the entire specimen. The water content of the sample is taken as the average of the top and bottom values.
Three measurements of the sample diameter were taken at different heights and three measurements of the sample height were taken at different angles. The volume of the sample was then calculated from the average values of diameter and height. The mass of the sample was measured by using a scale with a resolution of 0.01 g. Based on the measured values of mass, water content, volume and specific gravity, it was then possible to calculate bulk density, dry density, porosity and degree of saturation.
Each sample is here identified by a code with the form Sxx – CSyy – Wzz, where xx is the sample
number, yy is the compaction stress in MPa and zz is the percentage water content after compaction, e.g. S03 – CS50 – W6.4 is specimen number 3 compacted at a pressure of 50MPa with a water content of 6.4%. Table 2 shows the relevant properties of all specimens: sample code, water content w, bulk density ρb, dry density ρd, porosity n and degree of saturation Sr.
Fig. 5 shows the dry density of all samples plotted against water content together with the interpolating compaction curves at the three different pressures of 25 MPa, 50 MPa and 100 MPa. Note that these curves correspond to a level of compaction energy much higher than that of a standard or modified Proctor test [AFNOR 1999]. Indeed, standard or modified Proctor compaction is not sufficient to ensure sufficiently good mechanical properties for compressed earth blocks [Mesbah 1999].
Samples compacted at higher water contents (points on the right branch of the curves in Fig. 5) are characterised by values of degree of saturation equal or higher than 90%. A good proportion of pores in these samples have therefore become saturated during compaction, as confirmed by drainage of water observed between the piston and the mould at both bottom and top of the specimen (which also confirms the efficiency of double compaction). No water drainage was however observed during compaction of the drier samples (points on the left branch of the curves in Fig. 5), for which degree of saturation is lower and ranges between 60% and 80%.
Inspection of Fig. 5 indicates that an increase of compaction pressure generates an increase of the maximum dry density at the optimum water content. This increase of density with increasing compaction pressure is less than linear, i.e. the increase in dry density corresponding to a change of compaction pressure from 25 MPa to 50 MPa is greater than the increase in dry density corresponding to a change of compaction pressure from 50MPa to 100MPa. In other words, the efficiency of compaction reduces as pressure becomes higher.
Fig. 5: Compaction curves at 25, 50 and 100 MPa
After compaction, all samples were equalized inside a climatic chamber under a constant temperature of 25°C and a relative humidity of 62%. Equalisation took typically 15 days and was considered complete when the mass of the samples changed less than 0.1% over a period of at least one week. This preliminary equalization stage was necessary to eliminate the potential influence of different initial
hygroscopic conditions on the measured mechanical properties of the material [Beckett 2012; Bui 2014]. 3 RESULTS
3.1 Measurement of stiffness
The Young modulus was measured from unconfined loading-unloading cycles at a rate of 0.005 MPa/s. Each test included five cycles between one ninth and one third of compressive strength. The strength was estimated, for each compaction pressure, as the average of two pilot compression tests on randomly chosen samples for each compaction level. The material behaviour during the loading-unloading cycles is elasto-plastic [Kouakou 2009] with a clear hysteretic response (Fig. 6). The value of the Young modulus is taken as the average slope of the unloading branches of the five cycles. This is based
on the assumption that irreversible deformations occur mainly during loading while, during unloading, material behaviour is essentially elastic albeit non-linear. Two different values of the Young modulus have been calculated for each test using the deformations measured from two different sets of displacement transducers at the mid-height of the sample. The first set consists of three transducers that measure displacements over a distance of 10 mm at angles of 120° while the second set consists of two transducers measuring displacements over a distance of 50 mm on diametrically opposed sides of the sample. Differences between these two measurements are generally small and are mainly attributed to experimental variability rather than inhomogeneity of deformation over the sample height.
Table 2: Main properties of all samples
Sample w (%) ρb (kg/m3) ρd (kg/m3) n (-) Sr (%) S01 – CS25 – W10.7 10.7 2235 2020 0.24 89.2 S02 – CS25 – W9.8 9.8 2285 2082 0.22 93.1 S03 – CS25 – W9.0 9.0 2319 2128 0.20 95.2 S04 – CS25 – W9.0 9.0 2317 2125 0.20 94.6 S05 – CS25 – W8.7 8.7 2328 2141 0.19 95.0 S06 – CS25 – W8.5 8.5 2318 2137 0.20 91.3 S07 – CS25 – W7.0 7.0 2254 2107 0.21 70.5 S08 – CS25 – W6.3 6.3 2236 2103 0.21 63.0 S09 – CS25 – W9.4 9.4 2289 2093 0.21 91.6 S10 – CS25 – W7.4 7.4 2296 2137 0.20 80.3 S11 – CS25 – W7.0 7.0 2241 2095 0.21 68.5 S01 – CS50 – W7.2 7.2 2353 2195 0.17 89.9 S02 – CS50 – W6.2 6.2 2329 2194 0.17 76.4 S03 – CS50 – W6.4 6.4 2342 2201 0.17 81.2 S04 – CS50 – W7.2 7.2 2358 2201 0.17 90.6 S05 – CS50 – W7.0 7.0 2363 2209 0.17 90.1 S06 – CS50 – W6.9 6.9 2358 2205 0.17 88.7 S07 – CS50 – W7.5 7.5 2355 2192 0.18 92.2 S08 – CS50 – W6.6 6.6 2366 2220 0.17 87.4 S09 – CS50 – W6.3 6.3 2361 2222 0.17 84.0 S10 – CS50 – W5.6 5.6 2325 2203 0.17 70.7 S11 – CS50 – W5.3 5.3 2295 2179 0.18 63.7 S01 – CS100 – W6.5 6.5 2386 2240 0.16 91.7 S02 – CS100 – W6.3 6.3 2385 2244 0.16 89.0 S03 – CS100 – W5.9 5.9 2382 2250 0.15 84.9 S04 – CS100 – W5.2 5.2 2387 2270 0.15 79.6 S05 – CS100 – W5.4 5.4 2388 2266 0.15 81.7 S06 – CS100 – W5.6 5.6 2367 2241 0.16 79.2 S07 – CS100 – W4.7 4.7 2364 2257 0.15 70.1 S08 – CS100 – W5.4 5.4 2390 2266 0.15 82.5 S09 – CS100 – W6.2 6.2 2385 2247 0.16 88.2 S10 – CS100 – W4.8 4.8 2368 2261 0.15 71.1
Fig. 7 shows the values of Young modulus against dry density for all samples prepared at three different compaction levels. A trend line, together with two dashed lines representing the standard deviation from the trend, is also shown in the same figure. Inspection of Fig. 7 shows that the value of the Young modulus increases with increasing dry density and that samples compacted at a pressure of 100 MPa are, on average, 50% stiffer than the samples compacted at 25 MPa.
The value of Young modulus appears to grow more than linearly with growing dry density. Therefore, any increase of dry density beyond the maximum value of 2270 kg/m3 achieved in this study is expected to produce an even larger increase of Young modulus. Of course, there is a limit to the maximum dry density that can be achieved by mechanical compaction. This limit corresponds to the case where porosity vanishes and the density of the compacted soil becomes equal to the density of the solid grains, which is about 2660 kg/m3 for the present material.
Fig. 6: Cyclic test for measuring Young modulus (S09 – CS100 – W6.2)
Fig. 7: Variation of Young modulus with dry density
3.2 Measurement of compressive strength The same samples that had been previously subjected to loading-unloading cycles for the measurement of Young modulus were then loaded to failure for measuring the unconfined compressive strength.
Insufficient sample slenderness and the occurrence of friction between the sample and the press plates can introduce errors in the measurement of compressive strength [Morel 2007; Ciancio 2012]. In this study, the slenderness ratio of all tested samples is equal to two (samples have a diameter of 50 mm
and height of 100 mm), which is considered sufficient to avoid measurement errors. Also, Teflon spray is used to reduce friction at the contact between the sample surfaces and the press plates. Most samples tested in the present study show sub-vertical failure planes that cut through the top and bottom surfaces of the sample. This corroborates the assumption that the friction with press plates is negligible and does not affect the observed failure mechanism (Fig. 8). All unconfined compression tests were performed under a controlled displacement rate. Before running these tests, a number of preliminary pilot experiments were performed in which the displacement rate was varied from 0.01mm/s [Kouakou 2009] to 0.001 mm/s, which is the slowest rate that can be applied by the press. It was found that, within the above range, the displacement rate does not affect the measured peak of compressive strength but only the shape of the stress-strain curve [Bui 2014]. In the case of a faster rate, a more fragile behaviour was observed with the appearance of small instabilities along the loading branch of the stress-strain curve. On the basis of these preliminary results, the slowest displacement rate of 0.001 mm/s was used in all tests in order to obtain a regular stress-strain curve without instabilities.
Fig. 8: Typical compressive failure mechanism (S10 – CS50 – W5.6)
Fig. 9: Typical compressive strength test (S10 – CS50 – W5.6)
Fig. 10 shows the variation of peak strength with dry density for the samples compacted at the three pressure levels. The trend line is also shown in Fig. 10 together with the standard deviation band. Similarly to the measurement of Young modulus, the strength increases more than linearly with growing dry density with an average gain in strength of about
50% when compaction pressure grows from 25 MPa to 100 MPa.
The values of water content after compaction are also shown next to each experimental point. While a well-defined dependency of strength on dry density can be inferred from the data, no simple relationship can be defined between strength and water content.
Fig. 10: Variation of compressive strength with dry density
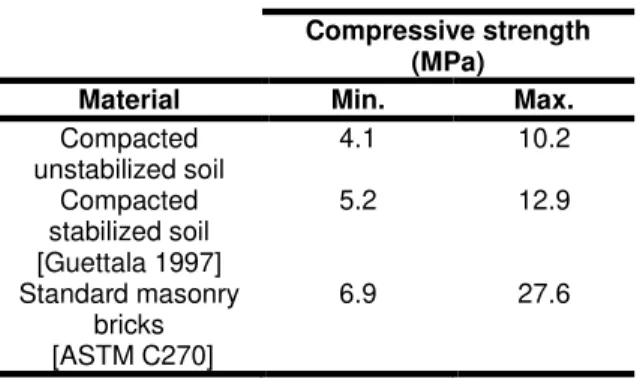
The obtained compressive strength can compete with mechanical performances of more traditional materials such as stabilized compacted earth and standard masonry bricks (Table 3).
Table 3: Comparison in terms of compressive strength
Compressive strength (MPa)
Material Min. Max.
Compacted unstabilized soil 4.1 10.2 Compacted stabilized soil [Guettala 1997] 5.2 12.9 Standard masonry bricks [ASTM C270] 6.9 27.6
For the unstabilized soil compacted with the proposed method, minimum and maximum values of compressive strength correspond respectively to the lowest and the highest level of compaction stress. In the case of the stabilized material, compressive strength varies from 5.2 (0% of cement, i.e. unstabilized soil) to 12.9 MPa that was obtained by adding 10% of cement [Guettala 1997]. The latter percentage of chemical stabilizer is so high that all “green” properties that are connected to the use of earthen materials are completely lost [Bui 2014]. Furthermore, compressive strength of masonry brick unit can vary largely and it can be observed that only the unstabilized soil compacted at the highest compaction stress is in compliance with the indicated requirements [ASTM C270].
4 CONCLUSIONS
The paper presents a new procedure for compaction of unstabilized compressed earth, i.e. compressed earth without chemical binders such as cement or lime. One of the novelties of the proposed procedure consists in the application of a significantly higher
compaction pressure than in standard practice. The compressed soil is also allowed to consolidate under constant load so to allow dissipation of any excess pore water pressure that might have been generated because of saturation of the pore space during compaction.
Three different levels of compaction pressure have been investigated to analyse the dependency of mechanical properties on compaction level. Results have confirmed that the proposed procedure enhances the mechanical properties of the earthen material at both service and ultimate states. In particular, stiffness and strength increase more than linearly with dry density. This also suggests that further enhancements of the mechanical properties are still possible by application of higher compaction pressures leading to larger values of dry density. The maximum value of dry density that can be theoretically achieved is that corresponding to the ideal case where no pore space exists and the dry density of the compacted earth is equal to that of the solid fraction. Of course, this is only a theoretical limit that would be difficult to achieve in practice.
Mechanical performance of the material compacted with the defined method is also comparable with a stabilised compacted earth or with standard masonry bricks.
The proposed compaction method might also contribute to the improvement of the durability characteristics of the earthen material. The application of high compaction pressures reduces the dimensions of the soil pores. This in turn reduces permeability and the sensitivity of the material to water infiltration. Further analysis of the porosity and durability properties of the present soil are planned in the continuation of this study.
5 AKWNOWLEDGMENTS
The authors gratefully acknowledge the financial support to this research by the Aquitaine Region and the Agglomération Côte Basque-Adour.
6 REFERENCES
[AFNOR 1991] AFNOR. NF P 94-054; Soils: investigation and testing – Determination of particle density- Pycnometer method. AFNOR, 1991.
[AFNOR 1992] AFNOR. NF P 94-057. Soils: investigation and testing – Granulometric analysis – Hydrometer method. AFNOR, 1992.
[AFNOR 1993] AFNOR. NF P 94-051; Soils: Investigation and testing – Determination of Atterberg’s limits – Liquid limit test using Casagrande apparatus – Plastic limit test on rolled thread. AFNOR, 1993.
[AFNOR 1995] AFNOR. NF P 94-050. Soils: investigation and testing – Determination of the moisture content – Oven drying method. AFNOR, 1995.
[AFNOR 1995] AFNOR. XP P 94-041. Soils: investigation and testing – Granulometric description – Wet sieving method. AFNOR, 1995.
[AFNOR 1999] AFNOR. NF P 94-093. Soils: investigation and testing – determination of the compaction characteristics of a soil – Standars Proctor test – Modified Proctor test. AFNOR, 1999.
[AFNOR 2001] AFNOR. XP P13-901; Compressed earth blocks for walls and partitions: definitions – Specifications – Test methods – Delivery acceptance conditions. Saint-Denis La Plaine Cedex: AFNOR, 2001.
[ASTM C270] American Society for Testing and Materials, ASTM.Standard Specification for Mortar for Unit Masonry.
[Allinson 2010] Allinson, D.; Hall, M.; Hygrothermal analysis of a stabilised rammed earth test building in the UK. Energy and Buildings, 2010, 42, 845-852. [Beckett 2012] Beckett, C. T. S., Augarde, C. E.; The effect of humidity and temperature on the compressive strength of rammed earth. In Proceedings of 2nd European Conference on Unsaturated Soils; 287-292. Naples, Italy, 20-22 June 2012, Springer, ISBN: 978-3-642-31342-4. [Bui 2014] Bui, Q.-B.;Morel, J. C.; Hans, S., Walker, P.; Effects of moisture content on the mechanical characteristics of rammed earth. Construction and Building materials, 2014, 54, 163-169.
[Ciancio 2012] Ciancio, D.; Gibbings, J.; Experimental investigation on the compressive strength of cored and molded cement-stabilized rammed earth samples. Construction and Building Materials, 2012, 28, 294–304.
[CRATerre-EAG 1998] CRATerre-EAG, CDI, Compressed earth blocks: Standards – Technology series No.11. Brussels: CDI, 1998.
[Dierks 2002] Dierks, K. ; Ziegert, C.; Neue Untersuchungen zum Materialverhaltenvon Stampflehm. In Steingass, P. : Moderner Lehmbau 2002. Tagungsband, Fraunhofer IRB.
[Guettala 1997] Guettala, A; Guenfoud, M.; Béton de terre stabilisée propriétés physic-mécanique et influence des types d’argiles. Revue La Technique Moderne,Paris, 1997, N°1-2, 21-26.
[Jayasinghe 2007] Jayasinghe, C.; Kamaladasa, N.; Compressive strength characteristics of cement stabilized rammed earth walls. Construction and Building Materials, 2007, 21, 1971–1976.
[Jiménez Delagado 2007] Jiménez Delagado, M.C.; Cañas Guerrero, I.; The selection of soils for unstabilised earth building: A normative review.
Construction and Building Materials, 2007, 21, 237-251.
[Kouakou 2009] Kouakou, C.H.; Morel, J.C.; Strength and elasto-plastic properties of non-industrial building materials manufactured with clay as a natural binder. Applied Clay Science, 2009, 44, 27-34.
[Houben 1994] Houben, H.; Guillaud, H.; Earth construction: a comprehensive Guide. London: Intermediate Technology Publications, 1994.
[Mesbah 1999] Mesbah, A.; Morel, J.C.; Olivier, A.; Comportement des sols fins argileux pendant un essai de compactage statique: détermination des paramètres pertinents. Materials and Structures/ Matériaux et Construction, 1999, 32, 687-694. [Mopt 1992] MOPT. Bases Para el Diseño y Construcción con Tapial. Madrid, Spain: Centro de Publicaciones, Secretaría General Técnica, Ministerio de Obras Públicas y Transportes, 1992. [Morel 2001] Morel, J.C.; Mesbah, A.; Oggero, M.; Walker, P.; Building houses local materials: means to drastically reduce the environmental impact of construction. Building and Environment, 2001, 36, 1119-1126.
[Morel 2007] Morel, J.C.; Pkla, A.; Walker, P.; Compressive strength testing of compressed earth blocks. Construction and Building Materials, 2007, 21, 303-309.
[Olivier 1986] Olivier, M.; Mesbah, A.; Le matériau terre: Essai de compactage statique pour la fabrication de briques de terre compressées. Bulletin de liaison du Laboratoire des Ponts et Chaussé, Paris, France, 1986, 146, 37-43
[Pacheco-Torgal 2012] Pacheco-Torgal, F.; Jalali, S.; Earth construction: Lessons from the past for future eco-efficient construction. Constructions and Building Materials, 2012, 29,512-519.
[Skempton 1953] Skempton, A.W. ; The colloidal “Activity” of clays. Proceedings of the 3rd International Conference of Soil Mechanics and Foundation Engineering, 1953, 1 57-60.
[Walker 2000] Walker, P.; Strength and durability testing of earth blocks. In: Proceedings of the 6th international seminar on structural masonry for developing countries, Bangalore, India, 2000, 111-118


![[i]Conidames[/i], a new oriental genus of Sycophaginae (Hymenoptera, Agaonidae) associated with [i]Ficus[/i] section Conosycea (Moraceae)](data:image/gif;base64,R0lGODlhAQABAIAAAP///wAAACH5BAEAAAAALAAAAAABAAEAAAICRAEAOw==)