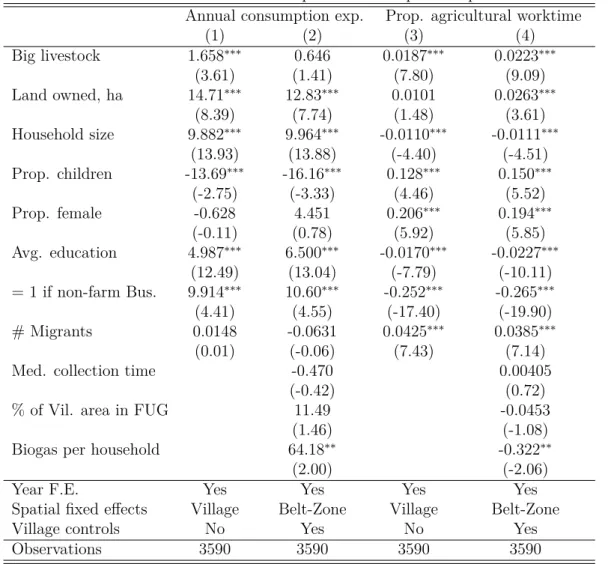
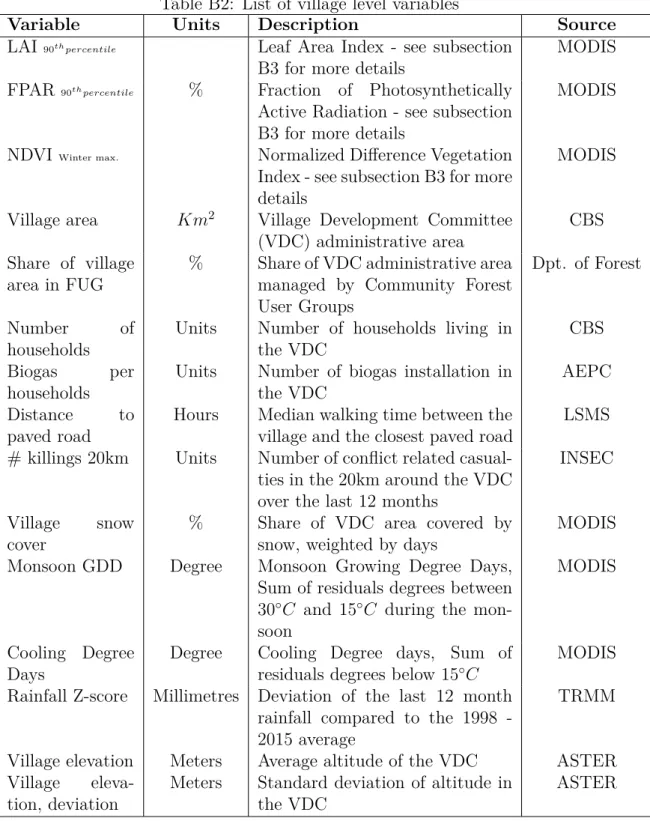
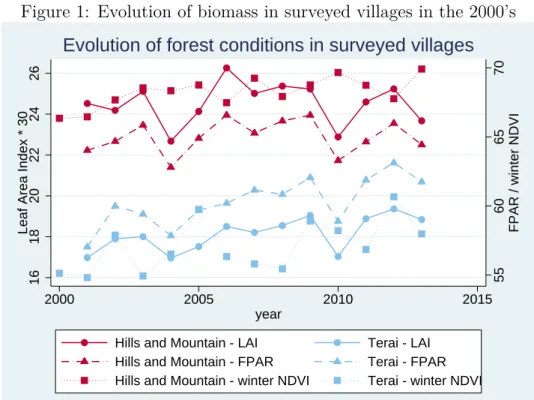
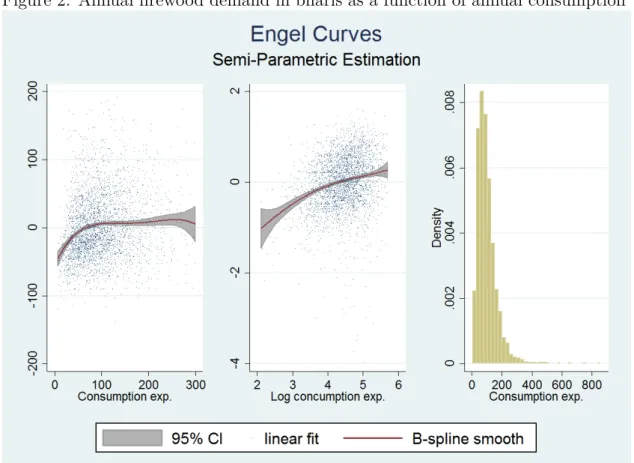
Forest Degradation and Economic Growth in Nepal, 2003–2010
Texte intégral
Figure

Documents relatifs
Moreover, in terms of statistical significance, the specified models (anchor-only and unrestricted) for Europe, Japan, and the UK perform worse than the US model, as
Stereotypes, therefore, represent biases toward and against others. In this pa- per, we formalise stereotypical bias within trust evaluations. Then, using the iterated
Finally, regarding the optimization of exact algorithms for U min ante and U ante max by Dynamic Programming, the results are quite similar to U ante + min and U ante −max :
a meeting that had been agreed to, for a long time between the president of the forest association and the representatives is «forgotten»; the fokontany president prefers to go to
In this shrinking neighborhood the criterion function will have a unique local maximum (namely b θ) and hence we can from now on consider θ b as the solution of the derivative of
De plus, ces injections de basalte, de par leur apport ponctuel de chaleur, peuvent aussi expliquer la présence des variations très brutales de la composition des
Participants seem to doubt their in- correct bat-and-ball responses as reflected in lower response confidence and longer reaction times when responding to standard vs
[1], a penalized projection density estimator is proposed. The main differences between these two estimators are discussed in Remark 3.2 of Brunel et al. We estimate the unknown
