HAL Id: hal-02791082
https://hal.inrae.fr/hal-02791082
Preprint submitted on 5 Jun 2020HAL is a multi-disciplinary open access
archive for the deposit and dissemination of sci-entific research documents, whether they are pub-lished or not. The documents may come from teaching and research institutions in France or abroad, or from public or private research centers.
L’archive ouverte pluridisciplinaire HAL, est destinée au dépôt et à la diffusion de documents scientifiques de niveau recherche, publiés ou non, émanant des établissements d’enseignement et de recherche français ou étrangers, des laboratoires publics ou privés.
Distributed under a Creative Commons Attribution - NonCommercial - NoDerivatives| 4.0 International License
Mathieu Gautier, Junichi Yamaguchi, Julien Foucaud, Anne Loiseau, Aurélien
Ausset, Benoit Facon, Bernhard Gschloessl, Jacques Lagnel, Etienne Loire,
Hugues Parrinello, et al.
To cite this version:
Mathieu Gautier, Junichi Yamaguchi, Julien Foucaud, Anne Loiseau, Aurélien Ausset, et al.. The genomic basis of colour pattern polymorphism in the harlequin ladybird. 2020. �hal-02791082�
Preprint · June 2018 DOI: 10.1101/345942 CITATIONS 0 READS 171 21 authors, including:
Some of the authors of this publication are also working on these related projects:
Pheno-genomics in invasive species View project
Sex allocation and sexual conflicts in a haplodiploid spider mite View project Julien Foucaud
French National Institute for Agricultural Research
277PUBLICATIONS 1,106CITATIONS
SEE PROFILE
Benoit Facon
French National Institute for Agricultural Research
124PUBLICATIONS 2,103CITATIONS
SEE PROFILE
Bernhard Gschloessl
French National Institute for Agricultural Research
29PUBLICATIONS 719CITATIONS
SEE PROFILE
Jacques Lagnel
INRA French National Institute for Agricultural Research
55PUBLICATIONS 1,570CITATIONS
SEE PROFILE
All content following this page was uploaded by Arnaud Estoup on 18 June 2018.
1
The genomic basis of colour pattern polymorphism in the harlequin ladybird
Mathieu Gautier *1, Junichi Yamaguchi *2, Julien Foucaud 1, Anne Loiseau 1, Aurélien Ausset
1, Benoit Facon 1,3, Bernhard Gschloessl 1, Jacques Lagnel 1,4, Etienne Loire 1,5,6, Hugues
Parrinello 7, Dany Severac 7, Celine Lopez-Roques 8, Cecile Donnadieu 8, Maxime Manno 8, Helene Berges 9, Karim Gharbi 10,11, Lori Lawson-Handley 12, Lian-Sheng Zang 13, Heiko Vogel 14, Arnaud Estoup , Benjamin Prud'homme 
1 CBGP, INRA, CIRAD, IRD, Montpellier SupAgro, Univ Montpellier, Montpellier, France 2 Aix-Marseille Univ, CNRS, IBDM, Marseille, France
3 Present address: UMR Peuplements Végétaux et Bioagresseurs en Milieu Tropical, INRA,
Saint-Pierre, Réunion, France
4 Present address: INRA, UR1052, Génétique et Amélioration des Fruits et Légumes (GAFL),
Domaine St Maurice - 67 Allée des Chênes - CS 60094, 84143, Montfavet Cedex, France
5 Present address: CIRAD, UMR ASTRE, F-34398 Montpellier, France.
6 Present address: ASTRE, Univ Montpellier, CIRAD, INRA, Montpellier, France.
7 MGX, Biocampus Montpellier, CNRS, INSERM, Univ Montpellier, Montpellier, France 8 INRA, US 1426, GeT-PlaGe, Genotoul, Castanet-Tolosan, France
9 INRA, Centre National de Ressources Génomiques Végétales, F-31326 Castanet-Tolosan,
France.
10 Edinburgh Genomics, University of Edinburgh, Edinburgh, UK
11 Present address: The Earlham Institute, Norwich Research Park, Norwich, UK
12 Evolutionary and Environmental Genomics Group, School of Environmental Sciences,
University of Hull, Hull, HU6 7RX, UK.
13 Institute of Biological Control, Jilin Agricultural University, Changchun, China.
14 Department of Entomology, Max Planck Institute for Chemical Ecology, D-07745 Jena,
Germany.
* These authors contributed equally to this work
& These authors supervised this work equally # Co-corresponding authors
2
Many animal species are comprised of discrete phenotypic forms. Understanding the genetic mechanisms generating and maintaining such phenotypic variation within species is essential to comprehending morphological diversity. A common and
conspicuous example of discrete phenotypic variation in natural populations of insects is the occurrence of different colour patterns, which has motivated a rich body of
ecological and genetic research1–6. The occurrence of dark, i.e. melanic, forms,
displaying discrete colour patterns, is found across multiple taxa, but the underlying genomic basis remains poorly characterized. In numerous ladybird species
(Coccinellidae), the spatial arrangement of black and orange patches on adult elytra
varies wildly within species, forming strikingly different complex colour patterns7,8. In
the harlequin ladybird Harmonia axyridis, more than 200 distinct colour forms have been described, which classic genetic studies suggest result from allelic variation at a
single, unknown, locus9,10. Here, we combined whole-genome sequencing, population
genomics, gene expression and functional analyses, to establish that the gene pannier controls melanic pattern polymorphism in H. axyridis. We show that pannier, which encodes an evolutionary conserved transcription factor, is necessary for the formation of melanic elements on the elytra. Allelic variation in pannier leads to protein expression in distinct domains on the elytra, and thus determines the distinct colour patterns in H.
axyridis. Recombination between pannier alleles may be reduced by a highly divergent
sequence of ca. 170 kb in the cis-regulatory regions of pannier with a 50 kb inversion between colour forms. This likely helps maintaining the distinct alleles found in natural populations. Thus we propose that highly variable discrete colour forms can arise in natural populations through cis-regulatory allelic variation of a single gene.
Ladybird species have long been studied by geneticists and evolutionary biologists to investigate the origin and maintenance of discrete colour pattern forms in natural
populations7. In particular, the harlequin ladybird H. axyridis is an emblematic species of elytral colour pattern polymorphism, with more than 200 colour pattern forms described from different localities11,12. However, four forms dominate natural populations with high
frequencies (Fig. 1a)13: three distinct melanic forms harbouring different patterns (from darkest to lightest, form conspicua, f. spectabilis, and f. axyridis, and hereafter called Black-2Spots, Black-4Spots and Black-nSpots, respectively), and a non-melanic form (f. succinea, called Red-nSpots). The striking array of colour patterns documented in H. axyridis in the
3
wild has been attributed to a combination of allelic diversity, interactions between allelic forms, and plastic response to environmental factors12,13. Genetic crosses have demonstrated that the majority of H. axyridis melanic forms result from variation of multiple alleles
segregating at a single, uncharacterised, autosomal locus9,10, hereafter referred to as the colour pattern locus.
To identify this colour pattern locus, and the mechanisms underlying discrete colour pattern variation, we used a population genomics approach, taking advantage of the co-occurrence of multiple colour pattern forms in natural populations. To that end, we first performed a de novo genome assembly of the H. axyridis Red-nSpots form (HaxR) using long reads produced by a MinION sequencer (Oxford Nanopore) (see Extended Data Table 1). Then, to fine map the colour pattern locus on this assembly, DNA from 14 pools of individuals (from n=40 to n=100 individuals per pool) representative of the world-wide genetic diversity and the four main colour pattern forms of H. axyridis was sequenced on a HiSeq 2500 (Illumina, Inc.) (Extended Data Table 2). Our aim was to characterize genetic variation associated with phenotypic differences across pool samples, using the proportion of individuals of a given colour form in each pool as a covariate. To do so, we called 18,425,210 autosomal SNPs, and we performed a population-based genome-wide association study accounting for the covariance of allele frequencies across pools14. Given the dominance
hierarchy of colour morph alleles with Black-2Spots > Black-4Spots > Black-nSpots > Red-nSpots9,12,13, we first performed the association study using the proportion of Red-nSpots individuals, carrying two copies of the most recessive allele, in each DNA pool as a covariate. We found 710 SNPs strongly associated with the proportion of the Red-nSpots form (Bayes factor > 30 db), the vast majority (86%) of which are located within a single 1.3 Mb contig, utg676 (Fig 1b). The 56 SNPs with the strongest association signals (Bayes factor > 100 db) delineate a ca. 170 kb region on HaxR, representing the strongest candidate region for the colour pattern locus. Importantly, additional genome-wide association studies using the proportions of Black-4Spots, Black-2Spots or Black-nSpots individuals in the pools as covariates pointed to the same region (Extended Data Fig. 1 and 2), although these analyses were less powerful.
The candidate colour pattern locus extends from the first coding exon of the ortholog of the Drosophila gene pannier, including its first intron and first non-coding exon, to the end of the neighbouring 5’ gene, the GATAe ortholog (Fig 1d). To test a possible role of pannier or GATAe in adult colour pattern formation, we used RNA interference15. Because adult pigmentation patterns are specified during pupal development in insects, we injected larvae of
4
the different H. axyridis forms, just before pupation, with double-stranded RNA (dsRNA) targeting the coding sequences of pannier or GATAe. We also targeted eGFP as a negative control. Targeting GATAe or eGFP had no effect on pigmentation, both in the Red-nSpots and the Black-4Spots forms, suggesting that GATAe does not play any role in elytral pigmentation (Extended Data Fig. 3). In contrast, knocking-down pannier dramatically reduced the
formation of black pigment in all different forms, resulting in adults with almost
homogeneous red/orange elytra (Fig. 2). Dark pigment formation is not only strongly reduced in the elytra but also in the head and the rest of the body (Extended Data Fig. 4). Using a different, non-overlapping dsRNA fragment of pannier produced similar results, ruling out RNAi off-target effects (Extended Data Fig. 5). These results show that pannier is necessary for the formation of black pigment in H. axyridis adults. Furthermore, combined with our genome-wide association study, our data indicate that pannier is the main gene responsible for colour pattern polymorphism in H. axyridis, and that different pannier alleles determine the colour pattern in the different forms.
To understand how pannier contributes to the formation of different colour patterns we compared its coding sequences between the Red-nSpots and Black-4Spots forms. We did not find any non-synonymous mutation (Extended Data Fig. 5), thus ruling out changes in Pannier protein composition. We next hypothesised that pannier might have evolved divergent expression patterns during the development of the elytra resulting in different colour pattern forms. We therefore compared pannier expression level by RT-qPCR in late developing pupal elytra between Red-nSpots and Black-4Spots forms. We found that pannier is expressed at a higher level in the elytra of the Black-4Spots form compared to the Red-nSpots form (Fig. 3a). In order to determine how this difference reflected in Pannier spatial expression pattern, we compared the relative pannier expression levels in different parts of a Black-4Spots elytron. We found that pannier is expressed at a higher level in a presumptive black area, in the middle of the elytron, compared to the red presumptive areas (Fig. 3b). In order to map these differences onto spatial expression patterns, we stained late pupal elytra with an antibody raised against H. axyridis Pannier. We found that Pannier spatial distribution on the elytra is different between colour pattern forms (Fig. 3c-f, Extended Data Fig. 6). Strikingly, in all forms, areas with the strongest Pannier expression levels prefigure the adult elytral pattern of melanic elements. This tight spatial correlation, coupled with our genomic association study and the essential role of pannier in governing melanic patterns, provide strong evidence that cis-regulatory changes at the pannier locus drive divergent pannier expression patterns and, in turn, the polymorphic melanic patterns of H. axyridis.
5
In addition to allelic variation, colour pattern diversity in H. axyridis is shaped by the dominance relationships among colour form alleles12. Indeed, similarly to other species (e.g.,16), heterozygous individuals resulting from the cross of distinct homozygous H. axyridis forms produce black pigmentation in any part of the elytra that is black in either parental form12. Our results help to understand this phenomenon known as mosaic dominance at the molecular level. Since elytral Pannier expression patterns mimics adult black pigmentation patterns, and since each pannier allele carries its own cis-regulatory determinant to drive specific expression pattern, the expression pattern of pannier in heterozygotes will reflect the sum of individual form patterns. In other words, the mosaic expression of pannier during development, driven by the heterozygous alleles, produces a mosaic pigmentation pattern in adults (Fig. 4). This phenomenon compounds the effect of pannier allelic variation, increasing the complexity of colour patterns polymorphism in H. axyridis.
Finally, in order to precisely compare the sequences of pannier alleles between the Red-nSpots and another form, we sequenced the Black-4Spots form de novo. We chose the Black-4Spots form because it seemed the most divergent when compared to the Red-nSpots, based on genome-wide association results (Extended Data Fig. 1 and 2) and careful inspection of read coverage of the pools representative of colour forms (Supplementary Information). We generated the Black-4Spots draft assembly (HaxB4) from Illumina sequencing reads (Extended Data Table 1) and supplemented it by targeted BAC sequencing to derive a high quality 2.87 Mb sequence (% N = 0.96) spanning pannier and adjacent genomic regions. Strikingly, we found that the Red-nSpots and Black-4Spots sequences of the 5’ non-coding DNA and the first intron of pannier align poorly, in contrast to adjacent regions (Extended Data Fig. 7). Furthermore, we detected the footprint of a ca 50 kb long inversion within the first intron of pannier (Fig. 1d). This comparison indicates that the sequences of the non-coding DNA of pannier have diverged extensively between these forms.
Altogether, our results conclusively show that pannier plays a key role in the
specification and the diversification of the main colour pattern forms in H. axyridis. pannier has never been reported to play a role in pigmentation in insects. It has therefore been co-opted for this function in the lineage leading to H. axyridis, presumably through the evolution of new regulatory connections with downstream effector genes directly involved in black pigment production17. This contrasts with other insect groups, including butterflies and fruitflies, in which different regulatory genes have been co-opted to generate wing colour patterns3,6,17,18. Furthermore, we showed that polymorphic colour patterns in H. axyridis arise from differential regulation of pannier spatial expression. The divergent non-coding
6
sequences we have identified in the H. axyridis colour pattern forms are quite large (ca. 170 kb) and may host multiple discrete cis-regulatory elements. We propose that these
cis-regulatory elements produce different pannier expression patterns and, ultimately, discrete
melanic patterns, by interpreting differently a regulatory blueprint that is common to all H.
axyridis colour pattern forms. This model is reminiscent of the mechanisms underlying
thoracic bristles or wing pigmentation patterns diversity in Drosophila species17,19,20, and that has been proposed to explain wing colour pattern evolution in butterflies6.
We have demonstrated that the cis-regulatory region of pannier is highly divergent between the Red-nSpots and Black-4Spots alleles and that it includes a ca. 50 kb inversion. Furthermore, our data provides evidence of large-scale sequence variation among all four alleles of the main colour pattern forms in natural populations (Supplementary Information). We hypothesize that the numerous, rare colour pattern forms that have been described in H.
axyridis12, are also determined by pannier cis-regulatory variation, and that they might result
from rare mutational events, including rare recombination between the alleles of the main forms.
The striking sequence divergence among the pannier alleles of the main colour forms brings into question their evolutionary origin. Possibilities include ancient mutational events or even across species introgression events10,21. Thorough characterization of the pannier genomic region from different colour pattern forms both within H. axyridis and across
coccinelid species (especially those harboring colour pattern polymorphisms7) will illuminate the evolutionary origin of the genomic determinants of colour pattern forms in H. axyridis and other ladybird species.
Finally, if sequence divergence likely helps preserving distinct pannier alleles by reducing recombination among them, selective mechanisms are also suspected to maintain different colour forms in natural populations of H. axyridis and affect their frequencies. Both local adaptation to climatic factors and seasonal variations in temperature have been
suggested to affect colour forms proportions in space and time, possibly mediated by mate choice10,11,22. The identification of the genomic basis of colour pattern polymorphism will help to better characterize the evolutionary mechanisms that shape the striking colour pattern diversity in natural populations of H. axyridis, and to reveal potential pleitotropic effects of
pannier alleles on traits involved in survival and reproduction22,23.
7
Acknowledgments: We thank G. Beydon for constructing and screening the BAC library, L.
Sauné and M. Galan for assistance in MISEQ sequencing, E. Lombaert, I. Goryacheva, Robert Koch, Jonathan Lundgren and C.E. Thomas for help in sampling wild H. axyridis populations, Ashraf Tayeh for assistance in lab-rearing of H. axyridis and Anthony Bretaudeau for making the H. axyridis genome assemblies publicly accessible. We are grateful to Nicolas Gompel, Nicolas Rode, Ruth Hufbauer and Renaud Vitalis for comments on the manuscript. A.E., B.F., J.F. and M.G. acknowledge financial support from the national funding agency ANR (France) through the European Union program ERA-Net BiodivERsA (project EXOTIC), and the GenoToul bioinformatics platform Toulouse Midi–Pyrenees for providing computing resources; B.P. and J.Y. acknowledge financial support from the CNRS, the European Research Council under the European Union's Seventh Framework Programme (FP/2007-2013) / ERC Grant Agreement n° 615789, and the France-BioImaging
infrastructure supported by the Agence Nationale de la Recherche (ANR-10-INSB-04-01, call "Investissements d'Avenir"), and the support of the NIG supercomputer at ROIS National Institute of Genetics (Japan); C.L.P., C.D. and M.M. acknowledge financial support from France Génomique National infrastructure, funded as part of “Investissement d’avenir” program managed by Agence Nationale pour la Recherche (contract ANR-10-INBS-09).
Author contribution: M.G. conceived the project, designed the study, carried out
bioinformatics and statistical treatments for genome-wide association studies and the
identification of HaxR autosomal contigs, performed or supervised bioinformatic analyses and BAC contig construction, and wrote the manuscript; J.Y. carried out larval RNAi, cDNA sequencing, qPCR, immunohistochemistry and imaging studies, processed various bioinformatics treatments and wrote the manuscript; J.F. helped design the study and contributed to obtaining and maintaining various H. axyridis populations in the lab; A.L. processed molecular work for the de novo assembly, genome-wide association studies and BAC library PCR screening; A.A. contributed to obtaining and maintaining various H.
axyridis populations in the lab; B.F. helped design the study and obtained funding; B.G.
analysed the quality of the de novo genome assemblies and annotated the coding genes ; J.L. designed the MinION study and processed associated bioinformatics treatments leading to the
HaxR de novo assembly; E.L. processed bioinformatics treatments for the HaxB4 de novo
assembly; H.P. and D.S. produced pool-seq and individual NGS data; C.L.R., C.D. and M.M. helped designed the MinION study, produced the MinION data and processed upstream bioinformatics treatments; H.B. developed and helped screening the Black-4Spots BAC library; K.G. helped design the study and produced some NGS data to construct the HaxB4 de
novo assembly; L.L.H. provided H. axyridis individuals from Japan and contributed to
drafting the manuscript; L.S.Z. provided H. axyridis individuals from China; H.V. helped design the study, obtained funding, produced RNA-seq data and genomic resources for the
HaxB4 de novo assembly; B.P. and A.E. designed and directed the project, obtained funding,
8
1. Hof, A. E. van’t et al. The industrial melanism mutation in British peppered moths is a transposable element. Nature 534, 102–105 (2016).
2. Nadeau, N. J. et al. The gene cortex controls mimicry and crypsis in butterflies and moths. Nature 534, 106–110 (2016).
3. Kunte, K. et al. doublesex is a mimicry supergene. Nature 507, 229–232 (2014). 4. Joron, M. et al. Chromosomal rearrangements maintain a polymorphic supergene
controlling butterfly mimicry. Nature 477, 203–206 (2011).
5. Yassin, A. et al. The pdm3 Locus Is a Hotspot for Recurrent Evolution of Female-Limited Color Dimorphism in Drosophila. Curr. Biol. CB 26, 2412–2422 (2016). 6. Reed, R. D. et al. optix Drives the Repeated Convergent Evolution of Butterfly Wing
Pattern Mimicry. Science 333, 1137–1141 (2011).
7. Majerus, M. E. N. Ladybirds. (Collins New Naturalist, 1994). 8. Majerus, M. E. N. Melanism: Evolution in action. (1998).
9. Tan, C. & Li, J. Inheritance of the elytral color patterns of the lady-bird beetle, Harmonia axyridis Pallas. Am. Nat. 68, 252–265 (1934).
10. Komai, T. Genetics of ladybirds. Adv. Genet. 8, 155–188
11. Dobzhansky, T. Geographical Variation in Ladybeetles. Am. Nat. 67,
12. Tan, C. Mosaic dominance in the inheritance of color patterns in the lady-bird beetle, Harmonia axyridi. Genetics 31, 195–210 (1946).
13. Michie, L. J., Mallard, F., Majerus, M. E. N. & Jiggins, F. M. Melanic through nature or nurture: genetic polymorphism and phenotypic plasticity in Harmonia axyridis: Melanic through nature or nurture. J. Evol. Biol. 23, 1699–1707 (2010). 14. Gautier, M. Genome-Wide Scan for Adaptive Divergence and Association with
9
15. Niimi, T., Kuwayama, H. & Yaginuma, T. Larval RNAi Applied to the Analysis of Postembryonic Development in the Ladybird Beetle, Harmonia axyridis. J. Insect
Biotechnol. Sericology 74, 95–102 (2005).
16. Le Poul, Y. et al. Evolution of dominance mechanisms at a butterfly mimicry supergene. Nat. Commun. 5, (2014).
17. Arnoult, L. et al. Emergence and diversification of fly pigmentation through evolution of a gene regulatory module. Science 339, 1423–1426 (2013).
18. Gompel, N., Prud’homme, B., Wittkopp, P. J., Kassner, V. A. & Carroll, S. B. Chance caught on the wing: cis-regulatory evolution and the origin of pigment patterns in Drosophila. Nature 433, 481–487 (2005).
19. Marcellini, S. & Simpson, P. Two or four bristles: functional evolution of an enhancer of scute in Drosophilidae. PLoS Biol. 4, e386 (2006).
20. Stern, D. L. & Orgogozo, V. The loci of evolution: how predictable is genetic evolution? Evol. Int. J. Org. Evol. 62, 2155–2177 (2008).
21. Heliconius Genome Consortium. Butterfly genome reveals promiscuous exchange of mimicry adaptations among species. Nature 487, 94–98 (2012).
22. Wang, S., Michaud, J. P. & Zhang, R. Z. Seasonal cycles of assortative mating and reproductive behaviour in polymorphic populations of Harmonia axyridis in China.
Ecol. Entomol. 34, 483–494
23. True, J. R. Insect melanism: the molecules matter. Trends Ecol. Evol. 18, 640–647 (2003).
24. Carver, T. J. et al. ACT: the Artemis Comparison Tool. Bioinforma. Oxf. Engl. 21, 3422–3423 (2005).
10
Methods
Description and naming of the four colour pattern forms that predominate in frequency in natural H. axyridis populations.
(i) form conspicua (hereafter named “Black-2Spots” for clarity) has black background colour of elytra with two orange spots on each elytron and the top one larger than the bottom one. (ii) f. spectabilis (hereafter “Black-4Spots”) has black background of elytra with one large orange spot in the top-centre of each elytron, (iii) f. axyridis (hereafter “Black-nSpots”) has black background colour of elytra with many orange spots, and (iv) f. succinea (hereafter “Red-nSpots”) has orange to red background colour of elytra with the number of black spots ranging from 0 to 19. See Fig. 1a of main text for illustrations.
De novo assembly of the Harmonia axyridis genome from individuals of the colour pattern form Red-nSpots.
Four Oxford Nanopore Technologies (ONT) libraries were prepared using the Ligation Sequencing Kit 1D (SQK-LSK108 ONT), according to the manufacturer’s protocol 1D Genomic DNA by ligation (SQK-LSK108). Briefly, 60 µg of genomic DNA was extracted using the Genomic-tip 500/G kit (Qiagen) from a pool of thorax tissue belonging to 12 Red-nSpots males from a lab-reared population founded by Red-Red-nSpots individuals originating from the biocontrol population BIOTOP (France). The DNA sample was divided into four aliquots and sheared into 25 kb (n=3) or 30 kb (n=1) fragments using the Megaruptor system (Diagenode). One of the 25 kb sheared DNA sample was additionally size-selected prior to library preparation using the BluePippin system (Sage Science, Beverly, USA) to remove fragments smaller than 10 kb. A DNA Repair (NEBNext FFPE Repair Mix M6630) step as well as an End-repair and dA-tail step (NEBNext End repair / dA-tailing Module E7546) were then processed on 0.34 pmols of the sheared DNA sample, followed by ligation of sequencing adapters. Then 0.07 pmols of library were loaded onto an R9.5 flow cell containing at least 800 active pores and run for 48 hrs, on a MinION sequencer (ONT) and sequenced by the Minknow ONT software (v1.7.10 or v1.7.14). Base calling was carried out using
Albacore (from ONT, v1.2.4 or 2.0.2) with default settings yielding 2.46x10⁶ reads (22.9 Gb)
(Supplementary Table 1) that were trimmed using Porechop 0.2.31 with default options.
11
(1.34x10⁶ reads; 17 Gb) were combined and further self-corrected using canu v.1.63 with default options. Genome assembly was then performed based on the corrected long reads using SMARTdenovo v.1.0.0 run with default settings. A last polishing step with Pilon v1.224 was carried out using paired-end (PE) Illumina sequencing reads (ca. 100X coverage) available for two pools of Red-nSpots individuals (see below). The resulting assembly, denoted HaxR, consisted of 1,071 contigs spanning 429 Mb (N50 = 1,434 Mb) encompassing 97.2% of the BUSCO (Benchmarking Universal Single-Copy Orthologs5) highly conserved arthropod gene set. See Extended Data Table 1 for additional HaxR statistics. The HaxR assembly is publicly available at http://bipaa.genouest.org/sp/harmonia_axyridis.
Identification of HaxR autosomal contigs using a female to male read mapping coverage ratio. Barcoded DNA PE libraries with an insert size of ca. 550 bp were prepared using the
Illumina TruSeq Nano DNA Library Preparation Kit following the manufacturer’s protocols using six DNA samples extracted from three Red-nSpots males and three Red-nSpots females originating from a wild H. axyridis population from Mississippi (USA). Libraries were then validated on a DNA1000 chip on a Bioanalyzer (Agilent) to determine size and quantified by qPCR using the Kapa library quantification kit to determine concentration. The cluster generation process was performed on cBot (Illumina Inc.) using the Paired-End Clustering kit (Illumina Inc.). Each individual library was further paired-end sequenced on a HiSeq 2500 or 2000 (Illumina, Inc.) using the Sequence by Synthesis technique (providing 2x125 or 2x100 bp reads, respectively) with base calling achieved by the RTA software (Illumina Inc.). After removal of sequencing adapters, reads were mapped onto the HaxR assembly using default options of the mem program from the bwa 0.7.12 software package6. Read alignments with a
mapping quality Phred-score <20 and PCR duplicates were further removed using the view (option -q 20) and rmdup programs from the samtools 1.3.1 software7, respectively. Read coverage at each contig position for each individual sequences was then computed jointly using the default options of the samtools 1.3.1 depth program. To limit redundancy, only one count every 100 successive positions was retained for further analysis and highly covered positions (>99.9th percentile of individual coverage) were discarded. The estimated individual median overall coverage ranged from 6 to 21 (see Supplementary Table 2 for details).
To identify autosomal contigs, we used the ratio ρ of the relative (average) read coverage of contigs between all females and all males (weighted by the corresponding overall genome coverage) expected to equal 1 for autosomal contigs and 2 for X-linked contigs8. Contigs smaller than 100 kb were discarded from further analyses because they displayed a
12
high coverage dispersion of their coverages (Supplementary Table 3) together with 12 of the remaining contigs with extreme values of ρ (ρ < 05 or ρ > 2.5). We further fitted the ρ distribution of the 492 remaining contigs (398 Mb in total) as a Gaussian mixture model with two classes of unknown means and the same unknown variance. The latter parameters were estimated using an Expectation-Maximization algorithm as implemented in the mixtools R package9. As expected the estimated mean of the two classes µ1=0.96 and µ2=1.90 were only
slightly lower (see Supplementary Table 3 for further details) to that expected for autosomal and X-linked sequences allowing to classify the different contigs. We could hence therefore assign classify with a high confidence (p-value < 0.01) 457 contigs as autosomal (377.5 Mb in total) and 18 contigs as X-linked (16.85 Mb in total) with high confidence.
Genome-wide scan for association with the proportion of Red-nSpots individuals using Pool-Seq data on 14 population samples.
Barcoded DNA PE libraries with insert size of ca. 450 bp were prepared using either the Illumina Truseq DNA sample prep kit (n=2) or the Nextera DNA Library Preparation kit (n=12) following manufacturer protocols using 14 DNA pools (each pool including the head - or the leg for some pools - from n = 40 to n = 100 individuals) collected in eight populations representative of the world-wide genetic diversity10 and the four main colour pattern forms of
the species (Extended Data Table 2). Illumina sequencing, processing and mapping of reads to the HaxR assembly was performed as described above for individual data (see Supplementary Table 4 for further details). The 14 Pool-Seq BAM files were processed using the mpileup program from the samtools v1.3.1 software7 with default options and -d 5000 and -q 20. Variant calling was then performed on the resulting mpileup file using VarScan mpileup2cns v2.3.411 (options min-coverage 50 min-avg-qual 20 min-var-freq 0.001 variants --output-vcf 1). The resulting VCF file was processed with the vcf2pooldata function from the R package poolfstats v0.112 retaining only bi-allelic SNPs covered by > 4 reads, < 99.9th overall coverage percentile in each pool and with an overall MAF > 0.01 (computed from read counts). In total, 18,425,210 SNPs mapping to the 457 autosomal contigs were used for genome-wide association analysis with a median coverage ranging from 18 to 45X per pool (Supplementary Table 4).
Genome-wide scans for association with the proportion of individuals of a given colour pattern form in each pool were performed using the program BayPass 2.113.
Capitalizing on the large number of available SNPs, we sub-sampled by taking one SNP every 200 SNPs along the genome, dividing the full dataset into 200 sub-datasets (each one
13
including ca. 92,500 SNPs). These sub-datasets were further analysed in parallel under the BayPass core model using default options for the Markov Chain Monte Carlo (MCMC) algorithm (except -npilot 15 -pilotlength 500 -burnin 2500). Three independent runs (using the option -seed) were performed for each dataset. The estimated model hyper-parameters were highly consistent across both runs and datasets. Support for association of each SNP with the corresponding prevalence covariate was then evaluated using the median Bayes Factor (BF) computed over the three independent runs. BFs were reported in deciban units (db) with 20 db corresponding to 100:1 odds, 30 db to 1000:1 odds, and so on14.
de novo sequencing of the Black-4Spots colour pattern allele. Starting from Black-4Spots individuals from the low diversity BIOTOP biocontrol population (France), we carried out four generations of full-sib crossings to produce a Black-4Spots inbred line, hereafter referred to as B4sIL. This aimed to improving further assembly steps by reducing the overall genetic variability. Four DNA PE libraries with insert sizes of ca. 250 bp (n=2), 400 bp (n=1) and 600 bp (n=1) and two DNA Mate Pairs (MP) libraries with insert sizes of ca. 3 kb and 8 kb were constructed from B4sIL DNA (3-4 individuals per library) using standard Illumina (Inc.) kits; and 2 Long Jumping Distance libraries (Eurofins MWG Operon) with insert sizes of ca. 3 kb and 8 kb. All these libraries were sequenced on a HiSeq2500 sequencer with either 2x100 bp or 2x150 bp reads (Supplementary Table 6). Raw reads were filtered for bacterial and human sequence contaminants using deconseq15 and trimmed using Trimmomatic v0.2216. Genome
assembly was then performed using AllPath-LG17 with default options except
Haploidify=True to account for residual polymorphism in the sequenced individuals. This led to a first assembly consisting of 6,883 scaffolds (N50 = 921 kb) totaling 378 Mb (%N = 14.8). To further improve the assembly, we generated long reads using the Pacific Biosciences RS II platform. To that end seven SMRT bell libraries were prepared using size fractionated (shearing size of 25 kb and size selection cut-off of 10 kb) high molecular weight DNA prepared from B4sIL individuals and loaded into SMRT Cell 8Pac v3 for sequencing on Pacific Biosciences RS II system with P6C4 chemistry by Treecode (Malaysia). The seven resulting sequence movie files were processed and analysed using Pacific Biosciences SMRT Analysis Server v2.3.0 with default settings. After the filtering step, a total of 422,222 reads (N50 = 21,521 kb) were used to carry out gap filling and scaffolding using PBJelly v1.3.118. The final Black-4Spots assembly, referred to as HaxB4, consisted of 6,586 scaffolds (N50=978.4 kb) totaling 393 Mb (%N=5.84). Both genome-wide association studies conducted as described above but with HaxB4 as a reference (Supplementary Fig. 1 and 2)
14
and sequence alignment of the utg686 contig of the HaxR assembly using Mummer19 (and
BLAST+20) tools allowed unambiguous identification of a 5.96 Mb HaxB4 scaffold that
included the colour pattern locus and adjacent genomic regions.
Because the HaxB4 assembly remained less contiguous and accurate than the HaxR assembly (see Extended Data Table 1 for a comparison), we performed a finishing step relying on a newly developed BAC (Bacterial Artificial Chromosomes) physical map covering the Black-4Spots allele of the colour pattern locus. To that end, a BAC library of 13,824 BACs (141+/-41 kb insert size after sizing of 48 BACs) with ca. five genome equivalent coverage was constructed in the vector pIndigoBAC-5 using high molecular weight DNA extracted from 300 B4sIL larvae (of developmental stage L1), as described in21. The BAC library, deposited at the CNRGV (INRA, Toulouse, France. https://cnrgv.toulouse.inra.fr/Library/Asian-ladybird), was organized in 2-dimension pools for PCR screening. A total of 98 PCR primers pairs designed against the HaxB4 assembly or newly generated BAC-end sequences were screened on the library. This allowed defining a Minimum Tiling Path of 14 BACs covering 1.9 Mb for local correction of scaffold mis-assembly (Supplementary Fig. 2). Shotgun sequencing was carried out using the Pacific Biosciences RS II system and Illumina MiSeq sequencer for 3 and 10 BACs, respectively21. Finally, we manually edited the HaxB4 assembly using the BAC sequences to derive a high quality 2.87 Mb sequence (% N = 0.96) including the candidate region of the Black-4Spots allele of the colour pattern locus as well as adjacent regions (Supplementary Data 1). Alignment of the later sequence to the HaxR assembly (i.e. Red-nSpot allele) using nucmer from the package Mummer19 allowed the scaffolding of the five neighboring HaxR contigs (Supplementary Fig. 4) represented in Fig. 1c.
Larval RNAi
We synthesized double-stranded RNAs (dsRNA) with T7 polymerase as described previously22. DNA fragments for the transcription were amplified by PCR using primers containing T7 polymerase promoter sequences at their 5’ends (see Supp Data Table6 for primer sequences). We used cDNA from Black-4Spots or Red-nSpots forms. Sense and antisense transcripts were simultaneously synthesized using RiboMax express RNAi System (Promega), annealed, treated with RQ1 DNase (Promega), and precipitated with ethanol. The quality of dsRNA was examined by agarose gel electrophoresis, and the concentration was roughly measured by spectrophotometer ND-1000 (NanoDrop Technologies), and 2 µg/ul in nuclease free water were used for injection. Larvae were anesthetized just before pupation on
15
a CO2 pad, and 400-600 nl of dsRNA was injected into hemolymph using Nanoject
(Drummond Scientific).
cDNA sequencing.
Fragments of pannier for Black-4Spots and Red-nSpots forms were amplified separately by PCR from cDNA of elytra of Black-4Spots or in Red-nSpots forms. Total RNA was extracted using TRI reagent (Invitrogen), followed by DNase I treatment. cDNA was generated using First Strand cDNA Synthesis Kit (New England BioLabs). Resulting PCR fragments were approximately 1.8 kbp in length for both melanic forms when using the primer set (Ha_pnr-F1; CGGTACGAGATAAGCGAATAAGG, Ha_pnr-R1;
TTACCATTTACAAATATATTTACATGGTTGTTG). Each PCR product was inserted into cloning vector pGEM-T Easy (Promega) for Sanger sequencing.
Quantitative PCR (qPCR).
Total RNA was extracted from whole elytron of homozygous Black-4Spots (n=7) or Red-nSpots (n=6), or dissected elytron of homozygous Black-4Spots (n=5) at late pupal stage (96 hr after pupation) with TRI reagent (Invitrogen). RNA samples were reverse transcribed using First Strand cDNA Synthesis Kit (New England BioLabs). We omitted DNase I treatment, because all pairs of forward and reverse primer for qPCR were designed in different exons of each gene, which are separated by long introns. Furthermore, for accurate comparison, we confirmed the absence of nucleotide substitutions in the primer sequences in the different colour pattern forms. qPCR and data analysis were performed on StepOne Real-Time PCR System (Applied Biosystems) with Power SYBR Green Master Mix (Applied Biosystems). The data was normalized using eukaryotic initiation factor 4A (eIF4A) and 5A (eIF5A), and statistical significance of expression differences was established using two-tailed-t-test. All primer sets and each R2 value of standard curves are listed in Supp. Table 6.
Immunohistochemistry.
An antibody against H. axyridis Pannier (Ha_Pannier) was raised by Genscript, using as an antigen the first 384 amino acids of the protein. To test that this antibody recognizes
Ha_Pannier we ectopically expressed Ha_Pannier using the Gal4/UAS system in Drosophila
melanogaster. Specifically, we stained engrailed-Gal4, UAS-GFP; UAS-Ha_Pannier larval
16
co-localization of the signal in the posterior compartement of the disk, as expected, showing that the Ha_Pannier antibody recognizes Ha_Pannier in vivo.
Late pupal H. axyridis elytra are covered with a cuticle layer that is impenetrable for antibodies. Therefore, before staining, we split each elytron into two halves, separating the dorsal and ventral halves. For this we followed the protocol that has been developed for
Drosophila wings23 with some modifications. Elytra were dissected from pupae at late stage
(around 96 hr after pupation) in PBS, and fixed in 4% paraformaldehyde (5-10min at room temperature). The edges of the elytra were trimmed off with a razor blade before transferring the elytra on a piece of adhesive tape (Tesa). Another piece of adhesive tape was positioned on top of the immobilized elytra, and then gently removed to separate the two faces of the elytra. The two pieces of tape with split elytra (one is dorsal, the other is ventral side of the elytra) were fixed 4% paraformaldehyde again (1-5min at room temperature) and stained (overnight at 4°C) with anti-Ha_Pannier antibody at 1:70 dilution in 1% bovine serum albumin (BSA), followed by visualization with Alexa-dye-conjugated secondary antibodies (Invitrogen) at 1:100 dilution in 1% BSA (1h at room temperature). Cell nuclei were stained with DAPI. The pieces of tapes with stained elytra were mounted on microscope slides with VECTASHIELD (VECTOR).
Imaging
Anti-Pannier stainings were imaged under LSM510 confocal microscope (Zeiss) with
identical settings (e.g., objective lens, pinhole size, laser power, number of stacks, etc) for all samples. All raw confocal images were processed identically in ImageJ 1.51, and then enhanced separately with (Adobe Photoshop). Mean intensities of anti-Pannier signal were measured in rectangular sections using the Plot Profile command of ImageJ 1.51.
Adult H. axyridis (2 days post eclosion) were imaged on a Leica Z6Apo macroscope equipped with a ProgRes C5 ccd camera (Jenoptik). Several images were taken at different Z positions, and stacked together using HeliconFocus. Images were enhanced using Adobe Photoshop.
Genomic sequence divergence and gene structure at the colour pattern locus
Genomic sequences of Red-nSpots (utg676) and Black-4Spots (HaxB4) contigs including
pannier were visualized with dot plot using GenomeMatcher24. Conserved sequence blocks
were further detected and visualized with Artemis Comparison Tool (ATC)25 for figure 1d. To identify reliable orthologous positions between the two contigs we first extracted long
17
homologous blocks using blast2seq under high stringency parameters (blastn, e-value<0.01, alignment length≥2 kbp), and plotted them on the dot plot. The linear approximation was y=x+357764 (R2=0.973, y-axis; utg676, x-axis; HaxB4). There was blank region (where there are no plots) in the middle of this linear approximation, which corresponds to a highly
diverged region (202 kb and 234 kb in utg676 and HaxB4, respectively). We subsequently checked shorter homology blocks (≥1000 bp) around the breakpoints toward the center of the blank region to determine the borders more precisely. We considered continuous two or more conserved blocks (≥1000 bp) within 20 x 20 kb sliding window along the line approximation. Thus, we defined two breakpoints for the boundary between continuous conservation and divergent regions, the latter one spanning 173,272 bp on utg676 (554,399 - 727,671), in line with the ca. 170 kb region delimited by our genome-wide association study, and 209,085 bp on HaxB4 (913,592 - 1,112,677).
To identify gene structures around the divergent genomic region (173 kb on utg676), we mapped RNA-seq reads PRJEB1302326 (100bp paired-end, adult and larva Harmonia transcripts) deposited in Sequence Read Archive (SRA) to repeat-masked genome contigs using Tophat 2.1.027, followed by assembling transcripts by Cufflinks v2.2.128 using default parameters on the NIG supercomputer at ROIS National Institute of Genetics. Resulting genes were named after sequence homology to protein database of Drosophila marlanogaster (dmel-all-translation-r6.07) and Tribolium_castaneum (GCF_000002335.3_Tcas5.2). For the Black-4Spots sequence, since the number of mapped reads on exon-1 of pannier isoform-1 was low, we validated this gene structure using additional RNA-seq reads (Heiko V., unpublished). The mapped reads were further confirmed by eye on Integrative Genomics Viewer (IGV)29 to determine the gene structures.
References
1. Wick, R. R., Judd, L. M., Gorrie, C. L. & Holt, K. E. Unicycler: Resolving bacterial genome assemblies from short and long sequencing reads. PLoS Comput. Biol. 13, e1005595 (2017).
2. De Coster, W., D’Hert, S., Schultz, D. T., Cruts, M. & Van Broeckhoven, C. NanoPack: visualizing and processing long read sequencing data. Bioinforma. Oxf. Engl. (2018). doi:10.1093/bioinformatics/bty149
3. Koren, S. et al. Canu: scalable and accurate long-read assembly via adaptive k-mer weighting and repeat separation. Genome Res. 27, 722–736 (2017).
4. Walker, B. J. et al. Pilon: an integrated tool for comprehensive microbial variant detection and genome assembly improvement. PloS One 9, e112963 (2014).
5. Simão, F. A., Waterhouse, R. M., Ioannidis, P., Kriventseva, E. V. & Zdobnov, E. M. BUSCO: assessing genome assembly and annotation completeness with single-copy
18
orthologs. Bioinforma. Oxf. Engl. 31, 3210–3212 (2015).
6. Li, H. & Durbin, R. Fast and accurate short read alignment with Burrows-Wheeler transform. Bioinforma. Oxf. Engl. 25, 1754–1760 (2009).
7. Li, H. et al. The Sequence Alignment/Map format and SAMtools. Bioinforma. Oxf.
Engl. 25, 2078–2079 (2009).
8. Bidon, T., Schreck, N., Hailer, F., Nilsson, M. A. & Janke, A. Genome-Wide Search Identifies 1.9 Mb from the Polar Bear Y Chromosome for Evolutionary Analyses. Genome
Biol. Evol. 7, 2010–2022 (2015).
9. Benaglia, T., Chauveau, D., Hunter, D. & Young, D. mixtools: An R Package for Analyzing Mixture Models. J. Stat. Softw. 32, (2009).
10. Lombaert, E. et al. Complementarity of statistical treatments to reconstruct worldwide routes of invasion: the case of the Asian ladybird Harmonia axyridis. Mol. Ecol. 23, 5979– 5997 (2014).
11. Koboldt, D. C. et al. VarScan 2: somatic mutation and copy number alteration discovery in cancer by exome sequencing. Genome Res. 22, 568–576 (2012).
12. Hivert, V., Leblois, R., Petit, E. J., Gautier, M. & Vitalis, R. Measuring genetic differentiation from Pool-seq data. bioRxiv (2018). doi:10.1101/282400
13. Gautier, M. Genome-Wide Scan for Adaptive Divergence and Association with Population-Specific Covariates. Genetics 201, 1555–1579 (2015).
14. Good, I. J. Weight of evidence: A brief survey. . 1985;2:249–270. Bayesian Stat 2, 249–270 (1985).
15. Schmieder, R. & Edwards, R. Fast identification and removal of sequence contamination from genomic and metagenomic datasets. PloS One 6, e17288 (2011).
16. Bolger, A. M., Lohse, M. & Usadel, B. Trimmomatic: a flexible trimmer for Illumina sequence data. Bioinforma. Oxf. Engl. 30, 2114–2120 (2014).
17. Ribeiro, F. J. et al. Finished bacterial genomes from shotgun sequence data. Genome
Res. 22, 2270–2277 (2012).
18. English, A. C. et al. Mind the gap: upgrading genomes with Pacific Biosciences RS long-read sequencing technology. PloS One 7, e47768 (2012).
19. Kurtz, S. et al. Versatile and open software for comparing large genomes. Genome
Biol. 5, R12 (2004).
20. Camacho, C. et al. BLAST+: architecture and applications. BMC Bioinformatics 10, 421 (2009).
21. Gschloessl, B. et al. Draft genome and reference transcriptomic resources for the urticating pine defoliator Thaumetopoea pityocampa (Lepidoptera: Notodontidae). Mol. Ecol.
Resour. 18, 602–619 (2018).
22. Niimi, T., Kuwayama, H. & Yaginuma, T. Larval RNAi Applied to the Analysis of Postembryonic Development in the Ladybird Beetle, Harmonia axyridis. J. Insect Biotechnol.
Sericology 74, 95–102 (2005).
23. Arnoult, L. et al. Emergence and diversification of fly pigmentation through evolution of a gene regulatory module. Science 339, 1423–1426 (2013).
24. Ohtsubo, Y., Ikeda-Ohtsubo, W., Nagata, Y. & Tsuda, M. GenomeMatcher: a graphical user interface for DNA sequence comparison. BMC Bioinformatics 9, 376 (2008). 25. Carver, T. J. et al. ACT: the Artemis Comparison Tool. Bioinforma. Oxf. Engl. 21, 3422–3423 (2005).
26. Havens, L. A. & MacManes, M. D. Characterizing the adult and larval transcriptome of the multicolored Asian lady beetle, Harmonia axyridis. PeerJ 4, e2098 (2016).
27. Trapnell, C., Pachter, L. & Salzberg, S. L. TopHat: discovering splice junctions with RNA-Seq. Bioinforma. Oxf. Engl. 25, 1105–1111 (2009).
Extended Data Fig. 1: Results of the genome-wide association study using the assembly HaxR
Extended Data Fig. 2: Results of the genome-wide association study focusing on the colour pattern genomic region of the assembly HaxR
RNAi-EGFP (3/3) (2/2) RNAi-G AT Ae (1/1) (3/3) RNAi-pnr1 (9/12) (4/4) RNAi-pnr2 (6/6) (4/4) a b c d
Extended Data Fig. 3 pannier, but not GATAe, is necessary for adult pigmentation patterns.
RNAi phenotypes after larval injection of dsRNA targeting eGFP (negative control) (a),
GATAe (b) or pannier (c, d) in Black-4Spots (left columns) or Red-nSpots (right columns) forms. pnr1 and pnr2 target different, non-overlapping regions of the pannier coding cDNA
(shown in Extended Data Fig. 5). Knock down of GATAe had a strong effect on survival, with only few injected individuals producing viable adults. Numbers in parentheses indicate
the proportion of eclosed adults with the representative pigmentation defect for each melanic form. Scale bar; 1mm
b a c dorsal ventral e T1 T2 T3 d f
Extended Data Fig. 4 Details of RNAi-pannier phenotypes.
Detailed pigmentation phenotypes between wild type and RNAi-pannier (right) in male Black-4Spots. Dorsal and ventral views of wild type elytra (a), or RNAi-pannier; (b). Head of wild type (c),
Black-pnr ATGTTCCACACCGGCGCCGGCGGCAACGGCTACGGCGACGGCAACGCGGGTTTCCACCAACACCTTCAGCAGTCCCCAGTCTACGTGCCGAGCAGCAGGGCCGTACCGCA 110 Red-pnr ATGTTCCACACCGGCGCCGGCGGCAACGGCTACGGCGACGGCAACGCGGGTTTCCACCAACACCTTCAGCAGTCCCCCGTCTACGTGCCGAGCAGCAGGGCCGTACCGCA 110 ************************************************************************************************************** Black-pnr CCAATATTCCCCGGCGGCAGGCACCCATTTCGGCGCCGCCGCCCACCAGGGAGGCTGGGCTCACGCCGGCGGTTCCTACGGCGACATGGCCTCGCAGGCGCACGGTCTTG 220 Red-pnr CCAATATTCCCCGGCGGCAGGCACCCATTTCGGCGCCGCCGCCCACCAGGGAGGCTGGGCTCACGCCGGCGGTTCCTACGGCGACATGGCCTCGCAGGCGCACGGTCTTG 220 **** ***************************** ******************************** ****************************************** Black-pnr GGGGCGCCGCTCACGCCTCTCCCCTCTCCGCCGGCCAGTTCTACACCCAGAACATGGTCATGTCCTCCTGGCGGGCCTACGACGGCTCTGGATTCCAACGGACGTCACCT 330 Red-pnr GGGGAGCCGCTCACGCCTCTCCCCTCTCCGCCGGTCAGTTCTACACCCAGAACATGGTCATGTCCTCTTGGCGGGCCTACGACGGCTCTGGATTCCAACGGACGTCACCT 330 ***************************************************************** ******************************************** Black-pnr TATGAGAGTGCCATGGAGTTCCAGTTCGGAGAGGGCAGGGAGTGCGTCAATTGTGGGGCCATTTCTACCCCTCTGTGGAGGAGAGATGGTACAGGGCACTACTTGTGTAA 440 Red-pnr TATGAGAGTGCCATGGAGTTCCAGTTCGGAGAGGGCAGGGAGTGCGTCAATTGTGGGGCCATTTCCACCCCTCTGTGGAGGAGAGATGGTACAGGGCACTACTTGTGTAA 440 ************************************************************************************************************** Black-pnr CGCTTGTGGTTTGTACCACAAGATGAATGGGATGAACAGACCCTTAATCAAACCATCCAAAAGACTGACCGCAACCAGACGCTTGGGACTGTGCTGCACGAACTGCGGCA 550 Red-pnr CGCTTGTGGTTTGTACCACAAGATGAATGGGATGAACAGACCCTTAATCAAACCATCCAAAAGACTGACCGCAACCAGACGCTTGGGACTGTGCTGCACGAACTGCGGCA 550 **************************** ************** ****************************************************************** Black-pnr CCAGGACGACGACGCTGTGGCGTCGTAATAACGACGGCGAACCGGTGTGCAACGCCTGCGGCCTATATTTCAAGTTGCACGGAGTGAATAGGCCCCTGGCCATGCGCAAG 660 Red-pnr CCAGGACGACGACGCTGTGGCGTCGTAACAACGACGGCGAACCAGTGTGCAACGCCTGCGGCCTATATTTCAAGTTGCACGGAGTGAATAGGCCCCTGGCCATGCGCAAG 660 ************************************************************************************************************** Black-pnr GACGGCATCCAGACCCGTAAGAGGAAGCCGAAAAAACAAGGTGGTGGTAGTGGGGAGCGAGACGACAGTAGCTCCACCTCCGTAGAAGACGGCAAGACACCAGTAAGCAT 770 Red-pnr GACGGCATCCAGACCCGTAAGAGGAAGCCGAAAAAACAAGGTGGTGGTAGTGGGGAGCGAGACGACAGTAGCTCCACCTCCGTAGAAGACGGCAAGACACCAGTAAGCAT 770 ************************************************************************************************************** Black-pnr ATCAAACCAACAGCAACACTCAAACCAACAAGTACCTTCGTCATCTCAAAACCATCCCAATCATCAACATTCACCAGATAACAAAGTTACCCAGACCTTGGAACGACCTT 880 Red-pnr ATCAAACCAACAGCAACACTCAAACCAACAAGTACCTTCGTCATCTCAAAACCATCCCAATCATCAACATTCACCAGATAACAAAGTTACCCAGACCTTGGAACGACCTT 880 ********************************************************** *************************************************** Black-pnr ATCTAAGTCCAGCGTCACTGTTACCATCTTCATCGAGCCTGGTGAAGAGCGAACCGGGTTACGATTACAGCTGCCTGCAGAACCAAGGATACCCTTACCAGCAAATCTTC 990 Red-pnr ATCTAAGTCCAGCGTCACTGTTACCATCTTCATCGAGCCTGGTGAAGAGCGAACCGGGATACGATTACAGCTGCCTGCAGAACCAAGGATACCCTTACCAGCAAATCTTC 990 *********************************************************************************************
Black-pnr GGGTTCCCAGGTGCTGGACCGACAAACCCAGAATTAGCGTATCATCACCAACATCACGTAACAGCTTCTGCCAAACTGATGGCTACGACATAA 1083 Red-pnr GGGTTCCCAGGTGCTGGACCGACAAACCCAGAATTAGCGTATCATCACCAACATCACGTAACAGCTTCTGCCAAACTGATGGCTACGACATAA 1083
Black Red Black Red Black Red Black Red Black Red Black Red Black Red Black Red Black Red Black Red ds pnr1 ds pnr1 ds pnr2 Translation stop +128 bp ds pnr2 ds pnr2 ds pnr2 ds pnr2 b ************************************************************************************************************** Black-pnr MFHTGAGGNGYGDGNAGFHQHLQQSPVYVPSSRAVPHQYSPAAGTHFGAAAHQGGWAHAGGSYGDMASQAHGLGGAAHASPLSAGQFYTQNMVMSSWRAYDGSGFQRTSP 110 Red-pnr MFHTGAGGNGYGDGNAGFHQHLQQSPVYVPSSRAVPHQYSPAAGTHFGAAAHQGGWAHAGGSYGDMASQAHGLGGAAHASPLSAGQFYTQNMVMSSWRAYDGSGFQRTSP 110 ************************************************************************************************************** Black-pnr YESAMEFQFGEGRECVNCGAISTPLWRRDGTGHYLCNACGLYHKMNGMNRPLIKPSKRLTATRRLGLCCTNCGTRTTTLWRRNNDGEPVCNACGLYFKLHGVNRPLAMRK 220 Red-pnr YESAMEFQFGEGRECVNCGAISTPLWRRDGTGHYLCNACGLYHKMNGMNRPLIKPSKRLTATRRLGLCCTNCGTRTTTLWRRNNDGEPVCNACGLYFKLHGVNRPLAMRK 220 ************************************************************************************************************** Black-pnr DGIQTRKRKPKKQGGGSGERDDSSSTSVEDGKTPVSISNQQQHSNQQVPSSSQNHPNHQHSPDNKVTQTLERPYLSPASLLPSSSSLVKSEPGYDYSCLQNQGYPYQQIF 330 Red-pnr DGIQTRKRKPKKQGGGSGERDDSSSTSVEDGKTPVSISNQQQHSNQQVPSSSQNHPNHQHSPDNKVTQTLERPYLSPASLLPSSSSLVKSEPGYDYSCLQNQGYPYQQIF 330 ****************************** Black-pnr GFPGAGPTNPELAYHHQHHVTASAKLMATT 360 Red-pnr GFPGAGPTNPELAYHHQHHVTASAKLMATT 360 Black Red Black Red Black Red Black Red
Extended Data Fig. 5 Alignment of pannier coding sequence from Black-4Spots and Red-nSpots forms.
a, Nucleotide alignment of pannier coding sequences from two forms.
Grey background indicates conserved sequences. The two DNA fragments amplified for dsRNAs synthesis are shown in pink. b, Protein sequences alignment. Note the absence of non-synonymous substitutions between Black-4Spots and Red-nSpots sequences.
anti-Pannier (Non-primary antibody)Negative Control Postion (pixel) DAPI Pnr Mean intensity (Pnr -DAPI, a.u.) !"#$ !%#$ #$ %#$ "#$ &#$ '#$ #$ %##$ "##$ &##$ '##$ (##$ )##$ *##$ +##$ ,##$ %###$ 10 -10 30 0 200 400 600 800 b c d e anti-Pannier anti-GFP
Extended Data Fig. 6 Details of immunohistochemistry with anti-pannier antibody.
a, anti-Ha_Pannier and anti-GFP double staining on wing imaginal disk of D. melanogaster engrailed-Gal4,
UAS-GFP; UAS-Ha_Pannier. The signals overlap in the posterior compartment of the disk, showing that the anti-Ha_Pannier recognizes Pannier protein in vivo. b, H. axyridis Red-nSpots elytron (left panel) and fluorescent image of immunohistochemistry with anti-Ha_Pannier antibody (central panel), or secondary antibody only (right panel). c, Enlargement of the region boxed in (b). d, Enlargement of the region boxed in (c) with DAPI staining. Scale bars, a: 100µm; b:1 mm, b,c; 100µm. Note that “jaggy lines” are observed on both DAPI and Ha_Pannier images, which may be due to folded structure of pupal elytra. e, Normalized mean intensities (intensity in anti-pannier staining (lower) - intensity in DAPI staining (upper) ) at each position along x-axis and its polynomial fitting curve. In order to compensate for the tissue heterogeneity, we subtracted for each pixel the DAPI staining intensity from the anti-Pannier staining intensity.
% similarity utg676 (1.3 Mbp) (2.9 Mbp) 1,000 2,000 0 1,000 0 GATAe pnr 12 utg676 pnr G AT Ae 1 2 HaxB4
b
a
900 1,000 1,100 1,200 600 700 500 800 HaxB4Extended Data Fig. 7 Comparison of utg676 and HaxB4 sequences
a, Dot-plot between genomic scaffolds from the Black-4Spots (HaxB4) and Red-nSpots (utg676) forms.
The most divergent sequence (white dashed box in a) in shown at a higher magnification in b).
Extended Data | Table 1: Statistics characterizing the assembly HaxR obtained from
Red-nSpots individuals and the assembly HaxB4 obtained from Black-4Spots individuals.
Assembly HaxR Assembly HaxB4
Data MinION long reads (65X)
Illumina PE reads (100X)
Illumina PE reads (65X) Illumina MP reads (24X)
Assembler SMARTdenovo ALLPATH-LG
Nb. of sequences 1,071 contigs 6,586 scaffolds
Total length (Mbp) 429 393.1 Average length (Kbp) 400.9 59.7 Max size (Kbp) 7,499 5,635 Total Ns (bp) 22 22,814,986 N50 (Kbp) 1,434 978.4 BUSCO (complete) 97.2 % 86.0 % BUSCO (fragmented) 1.3 % 8.7 % BUSCO (missing) 1.5 % 5.3 %
Extended Data Table 2 | Sequenced pools of individuals representative of the world-wide genetic diversity and the four main colour pattern forms of H. axyridis
Pooled-sequencing sample code
Population sampling site Sampling
year Colour form in the pool No. of sequenced individuals Country Region or city
CH1-R
China Jilin 2013 Red-nSpots only 100
CH1-B 30 Black-4Spots 28 Black-2Spots 58 CH2-R China Changchun 2015 Red-nSpots only 100 CH2-B4 Black-4Spots only 67 CH2-B2 Black-2Spots only 73 JP-R Japan Kyoto
and other cities
2009 Red-nSpots only 57
JP-B4 Black-4Spots
only 58
NOV-Bn Russia Novosibirsk 2007 Black-nSpots only 44 BRG-R France Bourgogne 2013 Red-nSpots only 50 BRG-B4 Black-4Spots only 50
ENA-R USA Georgia 2007 Red-nSpots
only
45
WAS-R USA Washington 2007 Red-nSpots
only 40 BIO-R France Biological control population (BIOTOP) 2012 Red-nSpots only 100 BIO-B4 Black-4Spots only 100
Note: The colour pattern forms Red-nSpot, Black-nSpots, Black-4Spots and Black-2Spots correspond to the forms f. succinea, f. axyridis, f. conspicua, and f. spectabilis, respectively. Because of the hierarchical dominance between color form alleles (i.e. 2Spots > Black-4Spots > Black-nSpots > Red-nspot; Michie et al. 2010; Tan 1946), a population pool sample including individuals of a single colour pattern form is characterized by a high proportion of the allele associated to that form but also contains alleles associated to other more recessive forms if present in the population. Only population pool samples with Red-nSpots individuals contain 100% of Red-nSpots alleles.
BF 150 100 50 0 BF
All genomic contigs
50 kbp
d
GATAe pnr pnr GATAe 1 2 1 2 934,400 1051,200 1168,000 584,000 700,800 HaxB4 utg676 150 100 50 0 utg3382utg706 utg676 utg195 utg178
100 kbp
contigs
c
b
Figure 1 | Genome-wide association study identifies the main colour pattern locus in H. axyridis.
a, The four most frequent colour pattern forms of H. axyridis. From left to right: the form Black-2Spots (f. conspicua), Black-4Spots (f. spectabilis), Black-nSpots (f. axyridis), and Red-nSpots (f. succinea). b, Manhattan plots of genome-wide association for the proportion of Red-nSpots individuals in 14 DNA pooled samples of wild H. axyridis populations,
with Bayes Factor (BF) for individual SNPs .The horizontal dashed line indicates the 30 db threshold. SNPs above this threshold are highlighted and those assigned to contig utg676 (red arrow, containing the colour pattern locus) in the HaxR assembly and four neighbouring contigs are shown in red. Contigs are ordered by length. c, Same as Fig 1b with a focus on SNPs belonging to the five neighboring contigs including and surrounding the colour pattern locus of the HaxR assembly (in red in Fig 1b.). The relative ordering of these contigs was derived from the de novo sequencing of the Black-4Spots allele extended region (Methods). d, The gene content at the identified colour pattern locus. Fifty-six SNPs with the strongest association signal delimits a candidate colour pattern locus region of ca. 170 kb. (yellow boxes) that extends from the first coding exon of pannier to the 5’ upstream gene GATAe. Red and blue lines show conserved sequence blocks in forward or reverse direction, respectively, detected by24. The first intron of pannier contains the footprint of a ca 50 kb inversion (shaded boxes).
(7/7) (6/6) (3/3) (4/6)
a b c d
e f g h
Figure 2 | pannier is necessary for black pigment production in H. axyridis.
Wild type colour pattern forms (upper panels) and representative phenotypes for each form when knocking down pannier by larval RNAi (lower panels).
a, e, Black-2Spots; b, f, Black-4Spots; c, g, Black-nSpots; d, h, Red-nSpots.
Numbers indicate the fraction of eclosed adults with the representative phenotype for each form. Scale bar, 1mm.
a
e
1b
1.0 0 10 0 5 15 P M D Relative pnr mRNA levele
2e
3f
1f
2f
3d
1d
2d
3 pnr mRNA levelc
1c
2c
3 40 50 60 70 80 pixel intensity 80 90 100 110 120130140150 pixel intensityFigure 3 | pannier expression pattern determines melanic colour pattern in each H. axyridis form. a, Quantitative PCR of pannier mRNA from whole elytra reveals difference between Black-4Spots and
Red-nSpots forms (two-tailed-t-test; n≥6; p=0.0005).
b, pannier is expressed at different levels in the presumptive red or black elytral areas in the Black-4Spots
form (P, proximal, M, medial, D, distal), (n=5; two-tailed paired-t-test, p=0.02 (P vs. M), p=0.005 (M vs. D)). c-f, Immunodetection of Pannier protein in each colour form (~96h after pupation);
(c1-f1) show adult elytron, (c2-f2) show anti-Pannier staining, (c3, f3) show pixel intensity along the PD axis of the elytron in the region delineated with a bracket in c2 and d2), (e3, f3) show higher magnification of the selected areas (e2, f2). Note the reduction of signal intensity in the presumptive red/orange areas in each form. Scale bar; 1mm; 100µm for insets
pnr pnr
pnr
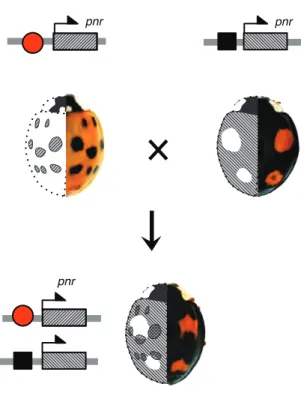
Figure 4 | Genetic basis of the mosaic dominance¶.
Each colour pattern form is determined by a particular cis-regulatory allele of pannier , symbolised with red square and black oval (top). In heterozygous individual (bottom), the mosaic colour pattern reflects pannier expression pattern, which is the sum of the two allelic forms. For each individual, the left elytron shows pannier expression pattern,
and the right elytron shows the corresponding adult pigmentation pattern.
View publication stats View publication stats