HAL Id: hal-03098041
https://hal.archives-ouvertes.fr/hal-03098041
Submitted on 5 Jan 2021HAL is a multi-disciplinary open access archive for the deposit and dissemination of sci-entific research documents, whether they are pub-lished or not. The documents may come from teaching and research institutions in France or abroad, or from public or private research centers.
L’archive ouverte pluridisciplinaire HAL, est destinée au dépôt et à la diffusion de documents scientifiques de niveau recherche, publiés ou non, émanant des établissements d’enseignement et de recherche français ou étrangers, des laboratoires publics ou privés.
E-DNA detection of rpoB gene resistance in
Mycobacterium tuberculosis in real samples using
Fe3O4/polypyrrole nanocomposite
Marwa Haddaoui, Christophe Sola, Noureddine Raouafi, Hafsa
Korri-Youssoufi
To cite this version:
Marwa Haddaoui, Christophe Sola, Noureddine Raouafi, Hafsa Korri-Youssoufi. E-DNA detection of rpoB gene resistance in Mycobacterium tuberculosis in real samples using Fe3O4/polypyrrole nanocomposite. Biosensors and Bioelectronics, Elsevier, 2019, 128, pp.76–82. �10.1016/j.bios.2018.11.045�. �hal-03098041�
1
E-DNA detection of rpoB gene resistance in Mycobacterium tuberculosis in
real samples using Fe
3O
4/polypyrrole nanocomposite
Marwa Haddaoui,1,2 Christophe Sola,3 Noureddine Raouafi*2 and Hafsa Korri-Youssoufi*1
1
Univ Paris Sud, Université Paris–Saclay, LCBB, Institut de Chimie Moléculaire et des Matériaux d'Orsay(UMR-CNRS 8182) , Bât 420, 2 Rue du Doyen Georges Poitou, 91400 Orsay, France
2
Université de Tunis El Manar, Faculté des Sciences, Laboratoire de Chimie Analytique et Electrochimie (LR99ES15), Campus universitaire de Tunis El Manar, 2092 Tunis El–Manar, Tunisie.
3
Institute of Integrative Cell Biology, Orsay, CEA-CNRS-Université Paris–SaclayUMR9198, Bâtiment 400, 91405 Orsay, France.
Corresponding authors: Noureddine Raouafi, Tel.: +21671872600 Ext 235, Fax: +21671883424, Email: noureddine.raouafi@fst.utm.tn and Hafsa Korri-Youssoufi, Tel.: +3369157440, Fax: +33169157281, Email: hafsa.korri-youssoufi@u-psud.fr.
Abstract
In this work, we achieved the selective detection of wild and mutated rpoB gene in M.
tuberculosis using an electrochemical DNA (E-DNA) sensor based on polypyrrole/Fe3O4
nanocomposite bearing redox naphthoquinone tag on PAMAM (spaNQ/PAMAM/PPy/Fe3O4). The hybridization between a given probe and the
complementary DNA target induced a large decrease in the naphthoquinone redox signal as measured by SWV and no cross-hybridization with single nucleotide mismatch DNA target occurred. Thanks to the catalytic properties of iron oxide nanoparticles combined with conducting properties of polypyrrole platform, we demonstrated that the transducing system allowed the detection of 1 fM of DNA target in a 50–µL drop corresponding to 3 × 10⁴ copies
2
of DNA. The sensor was able to detect the rpoB gene in PCR-amplified samples of genomic DNA and could also discriminate between the wild type rpoB gene and a single nucleotide mutated rpoB gene that provides resistant to rifampicin. Furthermore, the sensor could selectively detect the wild and mutant DNA in genomic samples without PCR amplification.
Keywords: Fe3O4; Polypyrrole; E-DNA sensor; PAMAM; Mycobacterium tuberculosis;
3
1. Introduction
Despite the recent medical advances, Tuberculosis i.e. a bacterial disease caused by
Mycobacterium tuberculosis, remains a major health problem worldwide (Reed et al., 2003;
Russel, 2001). Antibiotics have widely reduced the disease–related mortality, but antibiotic–
resistant strains of the bacteria have now emerged with multi–resistant strains raising therapeutic challenges (Thanyani et al., 2008). Obtaining sequence–specific genetic information about infectious pathogens and their resistance are paramount for diagnostic purposes and to devise the most adequate therapeutic strategy (Good et al., 2004). Thus the detection of the specific genes of M. tuberculosis and the identification of the mutated strands remain the most appropriate approaches for efficient diagnosis and the following therapy. Developing analytical systems for the detection and identification of pathogenic agents DNA are of great importance in medical diagnosis and others application such as food safety, environmental monitoring, control of military biological warfare agents, etc. Conventional detection tools for DNA are often bulky, expensive, and mostly require a long analysis time and are not adaptable to point–of–care analysis (Gerion et al., 2003; Rosi et al., 2005). Several inorganic nanomaterials are involved in the design of many attractive platforms for DNA biosensing (Wang et al., 2013; Hu et al., 2012 ; Han et al., 2013). Particularly, several metal oxides have been successfully employed as platform for E-DNA sensing. For instance, Das et al. used ZnO/ITO for an electrochemical DNA biosensor to detect M. tuberculosis in the range of 1 × 10⁻⁶ to 1 × 10⁻¹² M with a detection limit of 1 pM (Das et al., 2010). E–DNA sensor using on Cu2O hallow microspheres were reported by Zhu et al. (Zhu et al., 2009),
where such nanomaterial helped tethering the DNA probes to the electrode. Magnetic nanoparticles have also proven to be useful in catalysis, biotechnology/biomedicine, magnetic resonance imaging, and environmental applications (Hyeon, 2003; Mornet et al., 2006; Li et
4
indirect band gap of 2.2 eV at ambient conditions offer interesting properties for their application in electrochemical sensing. Due to their electrical properties, magnetic nanoparticles have been used in enzymatic biosensors to improve the response of redox mediator in enzymatic reaction for glucose detection. The association of magnetic nanoparticles with organic materials allowed the improvement of the transducing platform for E-DNA biosensors. For example, associations of Fe2O3 with chitosan (Xu et al., 2015), or
chitosan–graphene (Tiwari et al., 2015), were employed as platforms for E-DNA sensing by measuring the DNA hybridization through the redox signal of external ferrocyanide markers. Combining magnetic nanoparticles with conducting polymers such as polyaniline and polypyrrole presents interest because the resulting nanocomposite exhibits both magnetic and electronic conducting properties (Xiaotun et al., 2003).
In an attempt to detect and identify DNA, several studies have reported the use a DNA sensor with electroactive groups to monitor DNA hybridization. Different research groups used ferrocene derivatives (Zribi et al., 2016; Yao et al., 2013). Besides, the quinone/hydroquinone (Q/H2Q) couple and their derivatives attracted much attention as
transducing systems in chemical sensing (Ge et al., 2000) and biosensing (Geng et al., 1996;
Bucur et al., 2006). They can act as redox mediator in some catalytic reactions by
transporting charges inside the film at the interface between the polymer and the solution
(Wei et al., 2014). Furthermore, they offer great advantages over ferrocene, as they can
exchange electrons at less anodic potentials, avoiding side oxidations. Zhang et al. reported a signal-on, label-free and reagentless E-DNA biosensor, based on a mixed self-assembled monolayer of thiolated hydroxynaphthoquinone and thiolated oligonucleotide (Zhang et al., 2012). The sensor can detect the DNA target with high sensitivity and excellent selectivity, as
5
In this paper, we report the use of a nanocomposite formed by polypyrrole–magnetic nanoparticles modified with dendrimers PAMAM as a scaffold to covalently tether the naphtoquinone (spaNQ) as redox center and the DNA probe. The hybridization is followed through the electrochemical signal response of the attached naphtoquinone. The biosensor was constructed on SPE and fully characterized using AFM, SEM, XPS and electrochemical measurement through cyclic voltammetry (CV) and electrochemical impedance spectroscopy (ESI). We demonstrate that the association of magnetic nanoparticles and polypyrrole allows a high electrochemical response of the redox marker and thus a highly sensitive response to DNA hybridization. The biosensors were applied to detect and discriminate wild type DNA from mutated DNA strands of M. tuberculosis, which differ by a single mutation and that in both PCR amplified samples and samples without PCR amplification. Therefore, the amplification procedure could be avoided with this biosensor which also offers the possibility of measurements using drop size samples opening the possibility to their use as point-of-care system for M. Tuberculosis detection and drug resistance discrimination. The principle of the biosensor design and the procedure for E-DNA detection are outlined in Figure 1.
6
Figure 1. Design method of DNA/spaNQ/PAMAM/PPy/Fe3O4 for ropB gene DNA sensing:
(a) electrochemical magneto-polymerization of Fe3O4 NPs/pyrrole, (b) electrochemical
grafting of PAMAM, (c) spaNQ coupling and (d) functionalization by the DNA probe.
2. Material and methods
The descriptions of materials and methods used are detailed in supplementary material.
Construction of the biosensors
Fe3O4 nanoparticles were prepared according to literature (Kim et al., 2001). X–Ray
diffractograms and TEM micrographs are given in Figure S1 and Figure S2. Firstly, Fe3O4
NPs were dispersed under sonication in 0.5 M LiClO4 aqueous solution then pyrrole was
added. The final concentrations were 10 mg·mL−1 of Fe3O4 and 0.1 M of pyrrole. To coat the
gold screen-printed electrode (AuSPE) with the PPy/Fe3O4 film, a permanent magnet was
used to adsorb the magnetic particles to the electrode surface and the potential was swept from −0.4 to +0.8 V vs. Ag/AgCl with scan rate of 50 mV s−1 for 10 cycles (see, SM 3.2,
Figure S3A). Then, the magnet was removed and the electrode was rinsed several times with
deionized water.
Association of PAMAM Dendrimers, spaNQ and DNA
The poly(amido amine) 4th generation dendrimers (PAMAM G4) were electrochemically deposited on the Fe3O4/PPy nanocomposite using CV. PAMAMs were
dispersed in an aqueous 0.5 M LiClO4 solution and the potential was scanned between 0.0
and +1.1 V for 3 cycles at a scan rate of 50 mV·s−1 to covalently immobilize the dendrimers on the polypyrrole layer (see SM 3.2, Figure S3B). The naphtoquinone–terminated thiopropanoic acid (spaNQ), (see the synthesis in SM1.2), was covalently linked to the terminal amines present onPAMAM/PPy/Fe3O4 using EDC (10 mM) in PBS for 1h at RT.
7
un–adsorbed spaNQ molecules and incubated in 1% glutaraldehyde aqueous solution for 10 min. Finally, 1 µM sDNA (and later the wDNA and mDNA) in the PBS solution was added on the biosensor surface and incubated for 1h at RT. The electrode was rinsed several times with water and phosphate buffer solution to remove any unbounded DNA probe. The biosensor was finally stored over night at 4 °C for stabilization.
DNA Hybridization
To hybridize the DNA target with its probe, the bioelectrode was immersed into 10 mM PBS solution containing different concentrations of target (complementary or non– complementary) for 30 min at 47 °C followed by rinsing with buffer solution to remove non-bounded DNA. The same conditions were also used for the detection of PCR-amplified DNA samples and non-amplified genomic DNA samples. Before hybridization, the DNA was denaturized by heating at 95 °C for 5 min and cooled down to RT to separate the double strands into single strands.
3. Results and discussion
3.1. Stepwise preparation of the E-DNA sensor
3.1.1. Biosensors formation and characterization
Pyrrole was electropolymerized on Fe3O4 NPs magnetically adsorbed on the surface of
a gold screen-printed electrode (AuSPE) by sweeping the potential between –0.4V and +0.8 V. A conducting polypyrrole film was formed on the surface as the current increase during polymerization process (see SM 2.2, Figure S3). The nanoparticles wrapped in polypyrrole formed a nanohybrid film. The stepwise modification was monitored by cyclic voltammetry (CV), square wave voltammetry (SWV) and electrochemical impedance spectroscopy (EIS)
8
using [Fe(CN)6]3/4− as a redox probe (Figure 2). As displayed in Figure 2A, after the electrode
surface modification by the PPy/Fe3O4 nanocomposite, the CV curves showed an increase in
the redox currents of the Fe(II)/Fe(III) redox signal due to larger specific surface area provided by conducting polypyrrole-coated Fe3O4 nanoparticles. EIS data fitted by Randel
circuit model showed a decrease in charge transfer resistance (Rct1) from 800 Ω for bare gold
SPE to 106 Ω after the deposit of the composite (see SM. 3.2, Table S2, Rct1), which
suggested that the composite helped increase the electron transfer ability. The capacitive properties calculated through CPE (see SM 3.2, Table S2, CPE1) showed an increase in the
case of composite due to the charge storage provided by the film of PPy and also a decrease of n factor related the polydispersity of the surface.
The introduction of functional groups on the surface were performed by modification with dendrimers PAMAM G4 following an electrochemical patterning approach through amine oxidation as demonstrated previously (Miodek et al., 2016). The PAMAM could be linked to polypyrrole by covalent bonding formed by the electro–oxidation of the terminal amines that yield radicals which reacted with the polypyrrole film. The PAMAM/PPy/Fe3O4
film provided functional amine groups on the surface for further immobilization of the redox markers and DNA probe. Covalent attachment of NQ bearing acid in a terminal position was performed following amid linking in the presence of EDC as coupling agent. The covalent attachment of spaNQ was followed by CV in PBS solution free of redox probe. The CV underwent a one-electron reversible peak corresponding to the formation of radical anion followed by protonation to form hydroquinone (see SM 3.2,Figure S4A). The oxidation and reduction peaks were at potential of –0.38 and –0.43 V vs. Ag/AgCl, respectively. The difference between the potentials of the anodic and cathodic peaks was 58 mV, which demonstrated the different redox environments of the NQ/H2NQ redox couple. The calculated
9
ion. To examine the electrochemical redox process, CVs were recorded at different scan rates
(Figure S4B). The anodic current varied linearly as a function of scan rate suggesting an
adsorption-controlled process (inset in Figure S4B).
The remaining steps of the electrode modification were monitored by square wave voltammetry (SWV) to follow the electron exchange from the immobilized spaNQ (Figure 2B). The introduction of the spaNQ exhibited a clear SWV signal located at –0.45 V vs. Ag/AgCl related to the reduction of the naphthoquinone moiety. Furthermore, the reaction of dendrimers with glutaraldehyde induced ca. a 50%–drop of the current due to the formation of an insulating layer to the electron transfer. Finally, DNA immobilization produced a slight decrease in the NQ redox signal.
Figures 2C and 2D display the stepwise modification of the electrode in the first steps of biosensor formation monitored by EIS using external redox probe[Fe(CN)6]3/4− in
PBS(Figure 2C) and free of redox probe after the spaNQ attachment (Figure 2D). The EIS data where fitted using the equivalent circuit model shown in Table S2. Formation of the PPy/Fe3O4 film induced a large drop of the charge-transfer resistance (RCT) from 0.83 to 0.11
kΩ thus evidencing an ET enhancement by the nanohybrid film. The RCT increased steadily
during the film modification by the PAMAM G4, reaching 2.78 kΩ due to the disruption of the electronic conductivity of the PPy layer resulting from the coupling reaction of such dendrimer on PPy/Fe3O4. The addition of glutaraldehyde and DNA led to an increase in the
RCT due to blocking effects from 1.05 to 2.1 kΩ and from 1.05 to 3.1 kΩ, respectively and in
10
Figure 2. (A) CVs in presence of 5mM [Fe(CN)6]3/4– after each step of E–DNA sensor
formation: bare electrode (i), after modification with PPy/Fe3O4 (ii), and PAMAM (iii); (B)
SWVs in 0.1 M PBS solution (pH = 7.4) obtained after each step of E–DNA sensor formation: spaNQ/PAMAM/PPy/Fe3O4 (i), GL/spaNQ/PAMAM/PPy/Fe3O4 (ii), and
ssDNA/GL/spaNQ/PAMAM/PPy/Fe3O4 (iii); (C) EIS curves in presence of 5 mM
[Fe(CN)6]3/4– after each step of E–DNA building: bare electrode (i), after modification with
PPy/Fe3O4 (ii), and PAMAM (iii) (Eapp= –150 mV) and (D) EIS curves in presence in 10 mM
PBS (pH = 7.4) of spaNQ/PAMAM/PPy/Fe3O4 (i), GL/spaNQ/PAMAM/PPy/Fe3O4(ii) and
sDNA/GL/spaNQ/PAMAM/PPy/Fe3O4 (iii). (Eapp= –450 mV).
3.1.2. Structural and morphological studies
The surface properties and morphologic characteristics of the PPy/Fe3O4 nanohybrid
film and its functionalization with the PAMAM were examined by AFM and SEM. AFM images showed a change in the surface morphology with an aggregation of globular cauliflower-shaped large nanoparticles (Figure S5A). The electrochemical grafting of PAMAM dendrimers decorated the film with a myriad of small bright nanometric dots
-0.4 -0.2 0.0 0.2 0.4 0.6 -300 -200 -100 0 100 200 300 I / µA E / V A i ii iii -0.8 -0.6 -0.4 -0.2 0 20 40 60 I / µA E /V B i ii iii 0 1000 2000 3000 4000 0 1000 2000 3000 4000 Z'' /ohm Z'/ohm D i ii iii 0 1000 2000 3000 4000 5000 6000 0 1000 2000 3000 4000 5000 6000 0 200 400 600 800 1000 0 200 400 600 800 1000 -Z' /o h m Z/ ohm i -Z / ohm Z' / ohm C i ii iii
11
(Figure S5B). Comparatively to the SEM images of PPy/Fe3O4–modified electrode, the
PAMAM/PPy/Fe3O4-modified electrode showed several supplementary brighter small dots,
which can be assigned to the PAMAM dendrimers (Figures S5C and S5D). Furthermore, EDX analysis confirms the presence of PPy/Fe3O4 on the modified electrode surface (Figure
S6). Essentially, it showed the presence of C, N, O, Fe and Cl atoms. The latter one was due the use of LiClO4 for the pyrrole electropolymerization process.
3.1.3. X-Ray photoelectron spectroscopy
The survey spectrum of PPy-coated Fe3O4 films is given in Figure S8. Mainly, it
showed the bonding energy peaks of C 1s, N 1s, O 1s and Fe 2p located respectively at ca. 285, 400, 540 and 710-730 eV. Chlorine was also observed, as it originates from the use of lithium perchlorate as a supporting electrolyte for the pyrrole electropolymerization, as mentioned earlier. In 710–743 eV region, we noticed two peaks located at 715 and 725 eV that could be assigned respectively to Fe 2p3/2 and Fe 2p1/2 photoelectrons of the iron oxide species (see inset Figure S8).
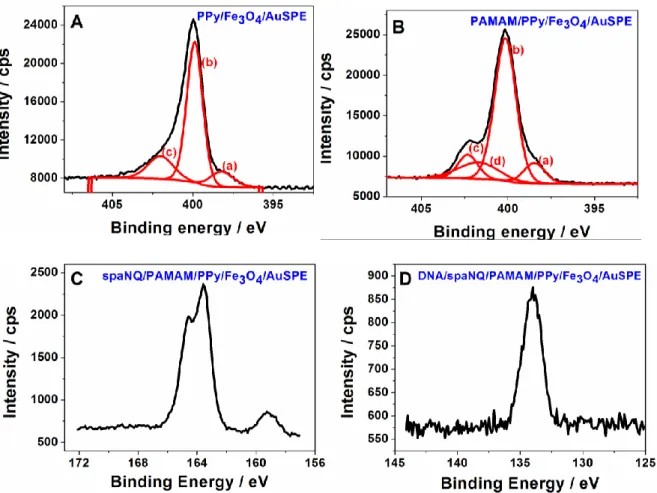
High–resolution N 1s spectra for PPy/Fe3O4 and PAMAM/PPy/Fe3O4 are displayed in Figure
3. The two signals are similar despite the introduction of PAMAM. The contribution from the peak (c) at 402.2 eV increased due to the presence of positively charged nitrogen species and amide groups into the dendrimers (Figures 3A and 3B). Furthermore, the functionalization of PAMAM/PPy/Fe3O4 with the spaNQ and the DNA probe were examined with XPS. The
spectrum after cross-linking of the spaNQ moiety showed a peak located at ca. 164 eV, which was assigned to the S 2p photoelectrons (Figure 3C). After DNA grafting, a new peak was observed at 134 eV, which was attributed to the P 2p photoelectrons (Figure 3D). These data are in favor of successful biomodification of the electrode.
12
Figure 3. High-resolution spectra of N 1s regions of PPy/Fe3O4 layer (A) after
electro-oxidation (B) G4 PAMAM dendrimers, (C) and (D) XPS spectra of the S 2p regions of spaNQ/PAMAM/PPy/Fe3O4 and P 2p regions of sDNA/spaNQ/PAMAM/PPy/Fe3O4.
3.2. Analytical performances of the E-DNA sensor
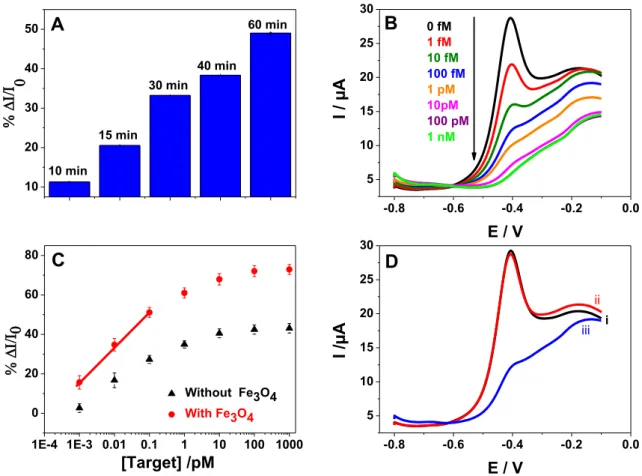
3.2.1. Optimization of the DNA hybridization time
Time of hybridization of the DNA probe with its target can markedly influence the detection ability of the E-DNA sensor. In the case of biosensor for point of care system a time of biological reaction is should be optimized to obtain short time with sensitive response. For this, we studied the hybridization of DNA at different times from 5mn to 120mn with fixed target concentration of 100 fM (Figure S9). The histogram in Figure 4A shows the relationship between the hybridization time and the percentage of current variation. Longer times provided the best results. For the forthcoming experiments, we choose to work at 30
13
min (> 40% current drop), since it represented a good compromise between short time experiments assay and an appreciable level of hybridization.
3.2.2. Dynamic range
Incubation of the electrode in solutions at different concentrations of the DNA target sequence showed that the redox current decreased steadily with the increase of the target DNA concentration as shown in Figure 4B. The current variation was proportional to the DNA concentration. The response was linearly dependent on the target concentration over a large range (from 1 fM to 0.1 pM) with a linear regression equation of % ∆I/I0 = 63.494
+17.74 log[target] /(pM) (R = 0.999). The current drop could be explained by the formation of the DNA duplex, which hindered the proton diffusion necessary to protonate the reduced form of naphthoquinone. Furthermore, the detection limit was calculated to be 4 fM by considering the criteria of 3.3 times of s/m ratio, where s stands for the standard deviation of five consecutive runs for the lowest concentration giving a measurable signal and m is the slope the linear part of the calibration curve. A good reproducibility was observed with a relative standard deviation (RSD) of 3.8%, which is less than what is conventional for SPEs
14
Figure 4. (A) Histograms giving the current percentage as function of the incubation time of
the bioelectrode into solution of 100 fM of the complementary DNA target, (B) SWV of E-DNA sensor after hybridization with complementary target at various concentrations (1 fM to 1 nM), (C) Calibration curve of biosensors displaying the relative changes of the current peak % ∆I/I0 at various concentrations of complementary DNA, where I0 and I are respectively the
peak currents before incubation and after incubation of the biosensor formed with DNA/spaNQ/PAMAM/PPy/Fe3O4 (red squares) and biosensor DNA/spaNQ/PAMAM/PPy
(black triangles) and (D) SWV curves showing the E-DNA response before (i) and after incubation in a solution of 100 fM of non-complementary DNA target (ii) and after incubation in 100 fM complementary of DNA target (iii).
A control experiment was run using a biosensor built without Fe3O4NPs to assess their
contribution in the E-DNA sensor design. Measurements were performed in the same conditions as before (Figure S10). The calibration curve is displayed in Figure 4C (black triangles). The redox peak currents were linearly proportional to the DNA concentration with a linear regression equation of %∆I/I0 = 40.2 +12.33 log[target] /(pM) (R = 0.986). Although,
10 20 30 40 50 10 min 15 min 30 min 40 min 60 min A -0.8 -0.6 -0.4 -0.2 0.0 5 10 15 20 25 30 I / µA E / V 0 fM 1 fM 10 fM 100 fM 1 pM 10pM 100 pM 1 nM B 1E-4 1E-3 0.01 0.1 1 10 100 1000 0 20 40 60 80 [Target] /pM Without Fe3O4 With Fe3O4 C -0.8 -0.6 -0.4 -0.2 0.0 5 10 15 20 25 30 I / µA E / V i ii iii D
15
the dynamic range is similar for the two biosensors, the sensitivity of the sensor without the Fe3O4NPs is 30% lower, which could affect the detection of low concentration and the limit
the detection. Accordingly, Fe3O4NPs helped shuttle electrons from the spaNQ redox marker
to the electrode through the polypyrrole film.
3.2.3. Selectivity
The response of the sensor to 100 fM of complementary and non-complementary DNA sequences was examined to prove its selectivity. The latter one differs with only one base mismatch from the complementary sequence. Figure 4D shows the SWV curves obtained after the sensor incubation in solutions of the two DNA sequences for the same durations. The probe sequence did not recognize the non-complementary sequence, while the incubation with target DNA caused a large current drop. The results suggested that the DNA/spaNQ/PAMAM/PPy/Fe3O4 bio-platform was endowed with a high selectivity to its
target analyte.
3.3. Detection of real DNA samples
To evaluate the practicality of the E-DNA sensor for ultrasensitive detection of nucleic acids in real samples, the device was used to detect rpoB gene DNA of M. tuberculosis in wild and mutated bacteria strains. One nucleotide polymorphism occurring in the codon 531 (TTG) of the gene gives resistance to rifampicin drugs, which are widely used to treat Tuberculosis. Since our sensor previously differentiates between two types of DNA with one base mismatch, we expect it to be able to do so with the genomic DNA. Two E-DNA sensors were prepared, the first one using a wild type DNA probe (E-wDNA) and the other one using the mutated DNA probe (E-mDNA). Before hybridization with the sensor, the PCR-amplified wild or mutated DNA samples were denaturized by heating at 95 °C for 5 min to obtain single stranded DNA.
16
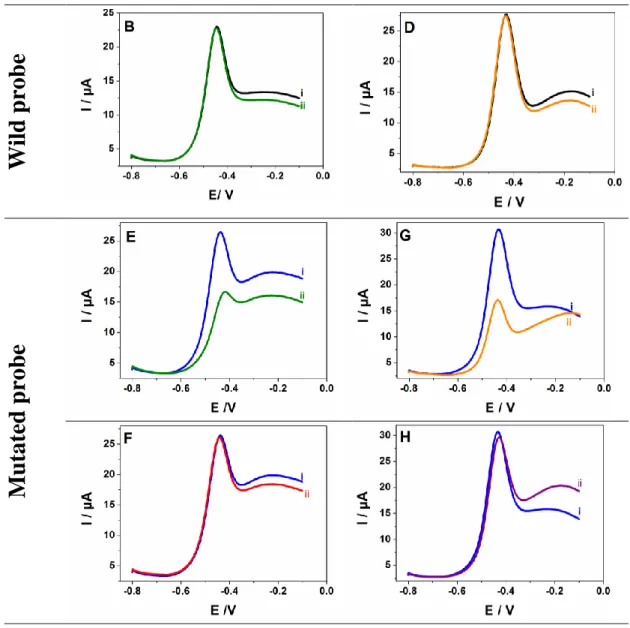
3.3.1. PCR-amplified genomic DNA from wild and mutant bacteria strains
In the first case, in presence of 100 fM of the PCR-amplified wild target DNA (PCR wDNA), we observed a sharp decrease of the naphthoquinone redox current (ca. 40%)
(Figure 5A). However, no variation occured with 100 fM of the mutated DNA target (PCR
mDNA) (Figure 5B). The experience was repeated with an immobilization of mutated DNA probe; similarly, the E-mDNA sensor detected only the mutated DNA target and was insensitive to the wild DNA target. An average drop of the naphthoquinone signal of ca. 38% was observed after the incubation with the mutated DNA (Figure 5E). A negligible variation was detected with the wDNA target (Figure 5F). These results show that our E-DNA sensor could detect selectively the DNA of rpoB gene in PCR-amplified genomic DNA samples. Furthermore, it does not allow cross hybridization between the two targets even if, the complementary and non–complementary DNA targets differs only by single nucleotide polymorphism. To confirm this high discrimination, we added simultaneously to E-wDNA sensor 100 fM of PCR wDNA and 10-fold of PCR mDNA (1000 fM). The response of the sensor was very similar to its response with the target wDNA alone. Furthermore, the mDNA did not yield any current change (Figure S11). The E-wDNA sensor showed a great specificity for the detection of PCR-amplified genomic DNA of M. tuberculosis in clinical isolates.
17
Figure 5. SWVs responses of various E-DNA biosensors(E-wDNA, E-mDNA) for detection
of wild type DNA (w-DNA) and mutated genomic matrix DNA (mDNA) after 35 cycles of PCR amplification (A, B, E, F) and non-amplified DNA samples (C; D, G, H); (A) E-wDNA biosensors before (i) after hybridization with PCR-wDNA (ii); (B) E-wDNA biosensor before (i) after hybridization with PCR-mDNA target (ii); (C) E-wDNA biosensors before (i), after hybridization with non-amplified wDNA (ii); (D) E-wDNA biosensor before (i) after hybridization with non-amplified mDNA (ii); (E) responses of E-mDNA biosensor, before (i) after hybridization with PCR-m DNA (ii); (F) responses of E-mDNA biosensor before (i) after hybridization with PCR-mDNA target (ii); (F) responses of E-mDNA biosensor, before (i) after hybridization with PCR-wDNA (ii); (G) responses of E-mDNA biosensor before (i) after hybridization with non-amplified mDNA (ii), (H) responses of E-mDNA biosensor, before (i), after hybridization with non-amplified wDNA samples
Wild prob
e
M
utated p
ro
be
18 3.3.2. Detection of non-amplified genomic DNA
The identification of genomic DNA without amplification is paramount in DNA sensing technology for diagnosis and detection of pathogens. In this step, DNA was isolated by extraction using phenol/chloroform and precipitated with ethanol according to DNA standard purification methods (Wilson, 2001). Figures 5C, D, G, H display a series of SWV curves obtained with E-wDNA recorded in the presence of wDNA and mDNA targets. Hybridization with the former target showed a strong decrease of redox current (Figure 5C) but no change was observed in presence of the mutated target (Figure 5D). However, if a mutated DNA probe was used, only the incubation of the electrode with mutated DNA target caused a significant decrease of the redox current (Figure 5G) and small variations were observed with non-mutated DNA (Figure 5H). Thus, confirming also that these two E-DNA sensors are sensitive enough to detect their complementary sequences in real samples even without PCR amplification and could distinguish a single nucleotide polymorphism occurring in the gene.
4. Conclusion
In this works, we described a novel platform for electrochemical DNA detection on SPE electrode and their successful application for sensing and discrimination of the rpob gene of genomic DNA of M. tuberculosis in its wild type and mutated forms with single nucleotide polymorphism in real sample without PCR amplification. This was achieved by using an electrochemical biosensor based on nanomaterials composed of polypyrrole-coated Fe3O4NPs functionalized with PAMAM dendrimers serving as scaffold for covalent bonding
a naphthoquinone redox group and DNA probes. We demonstrated that the association of magnetic nanoparticles and polypyrrole allowed high electrochemical response of redox markers and sensitive response to DNA hybridization thanks to the properties of Fe3O4NPs
19
which helped to shuttle electrons from the redox marker to the electrode through the polypyrrole film. The hybridization of the immobilized probe with its complementary sequence induced a large current drop of the redox marker allowing detection of 1 fM DNA in drop solution of 50µL corresponding to 3 × 10⁴ copies. The biosensor detected and discriminated successfully the mixture of genomic DNA from rpob gene of M. tuberculosis in wild and rifampicin-resistant mutated strands in both PCR samples and without amplification. The proposed biosensor was simple to design and could be used as a sensitive platform to detect various pathogenic DNA without amplification strategies. The strategy of the formation of biosensors through electrochemical deposition is well adapted for multiplexing array. It could be a powerful tool for point–of–care pathogen identification and drug screening.
Acknowledgments
The authors would like to thank the University of Tunis El Manar for the mobility grant “Bourse d’Alternance” awarded to MH. Tunisian Ministry of Higher Education and Scientific Research is acknowledged for financial support through PHC-Maghreb (grant# 39382RE) and PRF (grant# PFR2017-D4P1) projects.
References
Bucur, B., Mallat, E., Gurban, A.M., Gocheva, Y., Velasco, C., Marty, J.L., Noguer, T., 2006, Biosens. Bioelectron., 21, 2290–2297.
Das, M., Sumana, G., Nagarajan, R., Malhotra, B.D. ,2010, Thin Solid Films, 519, 1196– 1201.
Ge, Y., Smith, D.K., 2000, Anal. Chem., 72, 1860–1865.
Geng, L., Boguslavsky, L.I., Kovalev, I.P., Sahni, S.K., Kalash, H., Skotheim, T.A., 1996, Biosens. Bioelectron., 11, 1267–1275.
20
Gerion, D., Chen, F., Kannan, B., Fu, A., Parak, W.J., Chen, D.J., Majumdar, A., Alivisatos, A.P., 2003, Anal. Chem.,75, 4766–4772.
Good, M.C., Greenstein, A.E., Young, T.A., Ng, H.L., Alber, T., 2004, J. Mol. Biol, 339, 459–469.
Han, X., Fang, X., Shi, A., Wang, J., Zhang, Y., 2013, Anal. Biochem., 443, 117–123.
Hu, Y., Li, F., Han, D., Wu, T., Zhang, Q., Niu, L., Bao, Y., 2012, Anal. Chim. Acta,753, 82– 89.
Hyeon, T., 2003, Chem. Commun., 14, 927–934.
Kim, D.K., Zhang, Y., Rao, K.V., Muhammed, M., 2001, J. Magn. Magn. Mater, 225,30–6. Li, Z., Wei, L., Gao, M. Y., Lei, H., 2005, Adv. Mater., 17, 1001–1005.
Miodek, A., Mejri, N., Gomgnimbou, M., Sola, C., Korri-Youssoufi, H., 2015, Anal. Chem., 87, 9257–9264.
Miodek, A., Mejri-Omrani, N., Khoder, R., Korri-Youssoufi, H., 2016, Talanta,154, 446-454. Mornet, S., Vasseur, S., Grasset, F., Verveka, P., Goglio, G., Demourgues, A., Portier, J., Pollert, E., Duguet, E., 2006, Solid State Chem., 34, 237–247.
Nielsen, P.E., Sola, C., Pham, M.C., 2012, Biosens. Bioelectron., 32, 163– 168. Pham, M. C., Piro, B., Tran, L. D., 2003, Anal. Chem., 75, 6748-6752
Piro, B., Reisberg, S., Noel, V., Pham, M.C., 2007, Biosens. Bioelectron., 22, 3126–3131. Reed, S.G., Alderson, M.R., Dalemans, W., Lobet, Y., Skeiky, Y.A, 2003, Tuberculosis, 83, 213–219
Rosi, N.L., Mirkin, C.A., 2005, Chem. Rev., 105, 1547–1562. Ruan, C., Yang, L., Li, Y., 2002, Anal. Chem., 74, 4814-4820. Russell, D.G., 2001, Nature Rev. Mol. Cell. Biol, 2, 569–586.
Thanyani, S.T., Roberts, V., Gilbert, D., Siko, R., Vrey, P., Verschoor, J.A., 2008, J. Immun. Methods, ,332, 61–72.
21
Tiwari, I. , Singh M., Pandey, C. M., Sumana, G., 2015, Sens. Act. B. 206, 276–283
Wang, C., Yuan, X., Liu, X., Gao, Q., Qi ,H., Zhang, C., 2013, Anal. Chim. Acta,799, 36–43. Wei, M., Long, Y.T., 2014, Chem. Soc .Rev., 43, 30–51.
Wilson, K., 2001, Curr. Protoc. Mol. Biol., 2001, Vol 56, Chapter 2, 2.4.1- 2;4.5
Xiaotun Y., Lingge X.,, Choon N. S. , Hardy C. S.O., 2003, Nanotechnology, 14, 624-629 Xu, B., Zheng, D., Qiu, W., Gao, F., Jiang, S., Wang, Q.,2015, Biosens. Bioelectron. 72, 175–181
Yang, L., Li, Y., Erf, G.F., 2004, Anal. Chem., 76, 1107-1113.
Yao, W., Wang, L., Wang, H., Zhang, X., Li, L., Zhang, N., Pan, L., Xing, N., 2013, Biosens. Bioelectron., 40, 356–361.
Zhang, Q.D., March, G., Noel, V., Piro, B., Reisberg, S. , Tran, L.D. , Hai, L.V. ,Abadia ,E., Nielsen, PE., Sola, C, Pham, MC. 2012, Biosens. Bioelectron. 32, 163-168
Zribi, B., Roy, E., Pallandre, A., Chebil, S., Koubaa, M., Mejri, N., Magdiner Gomez, H., Sola, C., Korri-Youssoufi, H., Haghiri-Gosnet, A.M., 2016, Biomicrofluidics,10, 014115.