Structural characterization of suppressor lipids by high-resolution
mass spectrometry
Mary Joy Rovillos
1, Josch Konstantin Pauling
1, Hans Kristian Hannibal-Bach
1,
Christine Vionnet
2, Andreas Conzelmann
2and Christer S. Ejsing
1*
1
Department of Biochemistry and Molecular Biology, VILLUM Center for Bioanalytical Sciences, University of Southern Denmark, Odense, Denmark
2
Division of Biochemistry, Department of Biology, University of Fribourg, Fribourg, Switzerland
RATIONALE:Suppressor lipids were originally identified in 1993 and reported to encompass six lipid classes that enable
Saccharomyces cerevisiae to live without sphingolipids. Structural characterization, using non-mass spectrometric approaches, revealed that these suppressor lipids are very long chain fatty acid (VLCFA)-containing glycerophospholipids with polar head groups that are typically incorporated into sphingolipids. Here we report, for the first time, the structural characterization of the yeast suppressor lipids using high-resolution mass spectrometry.
METHODS: Suppressor lipids were isolated by preparative chromatography and subjected to structural characterization
using hybrid quadrupole time-of-flight and ion trap-orbitrap mass spectrometry.
RESULTS:Our investigation recapitulates the overall structural features of the suppressor lipids and provides an in-depth
characterization of their fragmentation pathways. Tandem mass analysis identified the positionally defined molecular lipid species phosphatidylinositol (PI) 26:0/16:1, PI mannoside (PIM) 16:0/26:0 and PIM inositol-phosphate (PIMIP) 16:0/26:0 as abundant suppressor lipids. This finding differs from the original study that only inferred the positional isomer PI 16:0/26:0 and prompts new insight into the biosynthesis of suppressor lipids. Moreover, we also report the identification of a novel suppressor lipid featuring an amino sugar residue linked to a VLCFA-containing PI molecule.
CONCLUSIONS: Fragmentation pathways of yeast suppressor lipids have been delineated. In addition, the
fragmentation information has been added to our open source ALEX lipid database to support automated identification and quantitative monitoring of suppressor lipids in yeast and bacteria that produce similar lipid molecules.
The yeast Saccharomyces cerevisiae has been essential for our understanding of eukaryotic lipid metabolism and membrane biology. For example, the molecular machinery responsible for
the first and rate-limiting step in sphingolipid biosynthesis,
the serine palmitoyltransferase complex, wasfirst identified
through genetic and biochemical studies in S. cerevisiae.[1,2]
The cloning of the yeast genes LCB1 and LCB2,[3,4]encoding
two subunits of the serine palmitoyltransferase, prompted the subsequent identification and cloning of orthologous
genes in higher eukaryotes, including humans.[5,6] These
achievements have over the years powered groundbreaking insights into the molecular functions of sphingolipids in
human development, health and disease.[7,8]
The early studies carried out in the 1990s also led to the isolation of unique S. cerevisiae strains that can live without
sphingolipids.[9,10]These so-called sphingolipid compensation
(SLC) strains feature a deletion of the essential LCB1 gene and
a suppressing gain-of-function mutation in the gene SLC1.[11]
A meticulous effort to characterize the lipid molecules synthesized by SLC strains, using non-mass spectrometric approaches, resulted in the identification of six classes of suppressor lipids that supposedly keep these yeast strains
alive.[12] These suppressor lipids were discovered to be
very long chain fatty acid (VLCFA)-containing
phosphatidylinositol (PI), lyso-PI (LPI), PI mannoside (PIM), PIM (LPIM), PIM-phosphoinositol (PIMIP) and lyso-PIMIP (Llyso-PIMIP) species (Fig. 1). Notably, the PI and LPI lipids have a polar head group identical to that of the yeast sphingolipid class inositolphosphoceramide (IPC), the PIM and LPIM lipids feature a head group identical to that of the mannosyl-inositolphosphoceramide (MIPC), and the PIMIP and LPIMIP lipids comprise a head group identical to that
of mannosyl-diinositolphosphoceramide (M(IP)2C).[1,2,12,13]
Despite these structural resemblances it is today still unclear how suppressor lipids are exactly synthesized and what essential molecular function of sphingolipids can be taken over by the suppressor lipids. Functional insights into this can be facilitated by mass spectrometry (MS)-based lipidomics
technology[14,15]provided lipid databases used for processing
of mass spectral data contain information on the ionization properties and fragmentation pathways of the suppressor lipids.
* Correspondence to: C. S. Ejsing, Department of Biochemistry and Molecular Biology, University of Southern Denmark, Campusvej 55, DK-5230 Odense, Denmark.
E-mail: [email protected]
http://doc.rero.ch
Published in "Rapid Communications in Mass Spectrometry 30(20): 2215–2227, 2016"
which should be cited to refer to this work.
Based on the structures of the suppressor lipids it has been
suggested that their biosynthesis requires enzymes
responsible for the production of sphingolipids as well as enzymes used for incorporation of fatty acid (FA) moieties into
glycerophospholipids.[11,12,16,17] The synthesis of
VLCFA-containing PI in SLC strains involves the mutated allele SLC1–1, encoding a sn2-acylglyceride acyltransferase with an altered substrate specificity that enables it to use VLCFAs instead of a long chain FAs (LCFAs) to acylate the sn-2 position of 1-acyl-2-hydroxy-sn-glycero-3-phosphate, thus producing phosphatidic acid (PA) with a sn-2-positioned VLCFA
moiety.[11]The VLCFA-containing PA can be converted to PI
by the PI synthase Pis1 and potentially also by the PI:IPC transferase Aur1. The VLCFA-containing PI can be converted to PIM and PIMIP by the MIPC synthase complex (Csg1/
Csh1/Csg2) and the M(IP)2C synthase (Ipt1), respectively.
Based on the original characterization it was suggested that the majority of suppressor lipid species contain a sn-1-positioned FA 16:0 moiety and a sn-2-positioned FA 26:0 (e.g.
PI 16:0/26:0).[12]Notably, more recent MS-based studies, using
wild-type yeastandthe mutant lag1Δlac1ΔLAG1,havereported detection of VLCFA-containing PI species primarily featuring a
sn-1-positioned FA 26:0 moiety (e.g. PI 26:0/16:1).[18,19]
Here we report, for the first time, the structural
characterization of the yeast suppressor lipids using high-resolution hybrid quadruple time-of-flight (QqTOF) MS and ion trap-orbitrap MS. Our investigation recapitulates the overall structural features of the suppressor lipids, originally proposed using conventional chemical approaches. Notably, tandem mass analysis identified the positionally defined molecular lipid species PI 26:0/16:1, PIM 16:0/26:0 and PIMIP 16:0/26:0 as abundant suppressor lipids. This finding differs from the original study that only inferred the positional isomer PI 16:0/26:0. In addition, our investigation also revealed a novel suppressor lipid featuring an amino sugar residue linked to a VLCFA-containing PI molecule. The obtained fragmentation information has been added to our ALEX lipid database and can be queried online
using our ALEX search engine.[20] Using our open source
ALEX software[21] this information can be harnessed for
identification and quantitative monitoring of suppressor lipids in yeast and similar lipid molecules produced by
pathogenic bacteria.[22,23]
EXPERIMENTAL
Chemicals
High-performance liquid chromatography (HPLC)-grade chloroform, methanol and 2-propanol were obtained from Rathburn (Walkerburn, UK). All other chemicals were purchased from Sigma-Aldrich (St. Louis, MO, USA). Synthetic PI 17:0/20:4 was purchased from Avanti Polar Lipids, Inc. (Alabaster, AL, USA).
Yeast strains and culture conditions
The S. cerevisiae strain 4R3-17c (lys2 lcb1Δ::URA3 SLC1–1
ade1)[11,12]was used in this study. The stain was cultured in
Lester Medium without phytosphingosine and tergitol.[24]
Yeast cells, corresponding to 4000 OD600 units, were
harvested by centrifugation, frozen in liquid nitrogen and
stored at 80°C.
Lipid extraction at 4°C
Collected yeast cells were dissolved in 35 mL 155 mM ammonium acetate, mixed with 10 mL glass beads
(500 μm) and disrupted for 120 min using a Vortex-Genie
2 (Scientific Industries, Inc., Bohemia, NY, USA) operated at 3200 rpm. The cell lysate was subsequently subjected to
two-step extraction.[14] The cell lysate (~35 mL) was
transferred to a 1000 mL glass bottle, 17.5 mL methanol was added and mixed for 30 min using a magnetic stirrer. Subsequently, 350 mL chloroform was added and the mixture was mixed for 5 h. Next, the mixture (~400 mL) was transferred to a separating funnel and set to phase separate for 12 h. The lower organic phase with relatively
Figure 1. Putative structures of yeast suppressor lipids and examples of used
shorthand nomenclature. The annotation of lipid molecules is described in the Experimental section.
apolar lipids including sterols, triacylglycerols, phosphatidylcholines and phosphatidylethanolamines was discarded (after a quality control by MS analysis).
The aqueous phase was returned to the 1000 mL glass bottle, 35 mL 155 mM ammonium acetate, 10 mL methanol and 350 mL chloroform were added, and mixed for 2.5 h. Next, the mixture was transferred back to the separating funnel and set to phase separate for 12 h. The lower organic phase with relatively apolar lipids was again discarded (after a quality control by MS analysis).
The aqueous phase was again returned to the 1000 mL glass bottle, 140 mL methanol and 280 mL chloroform were added, and mixed for 5 h. The mixture was subsequently transferred back to the separating funnel and set to phase separate for 12 h. The lower organic phase now with relatively polar lipids including PI, PIM and PIMIP lipids was collected (after a
quality control by MS analysis) in a distillation flask and
evaporated to almost complete dryness by vacuum distillation. The remaining aqueous phase in the separating funnel was again returned to the 1000 mL glass bottle, 17.5 mL 155 mM ammonium acetate, 105 mL methanol and 210 mL chloroform were added, and mixed for 2.5 h. The mixture was subsequently transferred to the separating funnel and set to phase separate for 12 h. The lower organic phase with relatively polar lipids was collected (after a quality control by MS) into
the distillationflask with polar lipids extracted in the previous
step. The solvent in the distillationflask was evaporated to
almost complete dryness by vacuum distillation. To this polar
lipid extract was added 5 mL chloroform/methanol/H2O
(25:100:0.2 v/v/v) and the mixture was stored at 20°C until
fractionation by preparative chromatography. Isolation of suppressor lipids
Next the polar lipid extract was fractionated using preparative normal-phase chromatography. Separation was performed on
an YMC-Pack PVA-Sil column (5μm, 12 nm, 150 × 4.6 mm i.d.)
(YMC Europe, Schermbeck, Germany) using a Dionex P680 LC system equipped with an ASI-100 autosampler and fraction
collector. A volume of 100μL of polar lipid extract was loaded
into an injection vial and 30μL of the extract was injected onto
the column using chloroform as a transport solvent. Lipids were separated using ternary gradient elution with the following solvents: chloroform (solvent A), 100 mM ammonium formate in methanol (solvent B) and 100 mM ammonium formate in water (solvent C). The gradient elution program was initiated with 100% A for 1 min, changed to 9% B after 2 min, changed to 22.6% B and 4.2% C after 9 min, changed to 32.4% B and 6% C after 16 min, changed to 34.5% B and 10% C after 19 min, changed to 60% B and 20% C after 21 min, changed to 80% B after 27 min, changed to 60% B after 32 min and
changed to back to 100% A after 38 min. Theflow rate was
1 mL/min, the column was at room temperature and fractions were collected every 0.5 min for 24 min (producing 48 fractions
with a volume of 500 μL). Each fraction was analyzed by
negative ion mode TOF MS analysis (see details below). Analysis by QqTOF MS
Mass spectrometric analysis was performed in negative ion mode using a TripleTOF 5600 spectrometer (SCIEX, Concord, Canada) equipped with a TriVersa NanoMate ion source
(Advion Biosciences Ltd, Ithaca, NJ, USA), as previously
described.[13,14,25] In brief, 5 μL of collected fractions were
loaded in 96-well plates (Eppendorf AG), 30 μL methanol
containing 0.01% methylamine were added and covered with aluminum foil. Samples were infused using an ionization
voltage of 0.96 kV and a gas pressure of 0.6 psi. All TOF
MS and TOF MS/MS spectra were recorded using high-resolution mode, providing a mass high-resolution of 35,000 (full width at half maximum (FWHM)). For TOF MS/MS analysis the analytical quadrupole Q1 was operated at unit mass resolution and using collision energy (CE) settings as specified
in thefigure legends. Acquired TOF MS data was processed
using LipidView software (SCIEX, Concord, Canada). Analysis by ion trap-orbitrap MS
High-resolution Fourier transform MS (FTMS) and MSn
analysis were performed in negative ion mode using an LTQ Orbitrap XL instrument (Thermo Scientific, San Jose, CA, USA) equipped with a TriVersa NanoMate ion source, as
previously described.[13,14]Samples were infused as specified
in the section above. FTMS spectra were acquired using a target mass resolution of 100,000 (FWHM at m/z 400) and
FTMS2and FTMS3spectra were acquired using a target mass
resolution of 30,000 (FWHM at m/z 400). Precursor ion
isolation width was 2.0 and 4.0 for MS2and MS3 analysis,
respectively. Normalized CE settings used for MSnanalysis
are specified in the figure legends. Annotation of lipid species
Lipid species are annotated as previously described.[25,26]In
brief, lipid species are annotated by sum composition when detected only by TOF MS or FTMS analysis. Lipid species
annotated by sum composition are denoted as <lipid
class> <sum of carbon atoms in the FA moieties>:<sum of double bonds in the FA moieties> (e.g. PIM 42:1). Lipid species detected by tandem mass analysis are annotated either by molecular composition or by positionally defined molecular composition. Lipid species annotated by molecular
composition are denoted as<lipid class > <number of carbon
atoms in thefirst FA moiety>:<number of double bonds in the
first FA moiety > - < number of carbon atoms in the second FA moiety>:<number of double bonds in the second FA moiety) (e.g. PI 16:1-26:0). Lipid species annotated by positionally defined molecular composition are denoted as <lipid class > <number of carbon atoms in the sn-1-positioned FA moiety>:<number of double bonds in the sn-1-positioned FA moiety>/ <number of carbon atoms in the sn-2-positioned FA moiety>:<number of double bonds in the sn-2-positioned FA moiety) (e.g. PI 26:0/16:1).
RESULTS AND DISCUSSION
Isolation of yeast suppressor lipids by preparative chromatography
In order to delineate the fragmentation pathways of yeast suppressor lipids we isolated these from the S. cerevisiae SLC
strain 4R3-17c.[11,12] To this end, we used differential lipid
extraction and preparative normal-phase chromatography (see Experimental section for details). Using this strategy we
obtained fractions enriched in different classes of suppressor lipids, and, additionally, chromatographic information showing the relative proportions of the different lipid classes (Fig. 2) and the stoichiometry between lipid species (see Fig. 7 and discussion below).
The separation showed that PI species containing LCFA and VLCFA moieties eluted primarily in fractions #36 and #35, respectively. The more polar LPI species with a single LCFA and VLCFA moiety eluted later in fractions #39 and
#38, respectively. The chromatographic analysis also
demonstrated that PIM, LPIM, and PIMIP species comprise primarily VLCFA moieties and were recovered in fractions #37, #39 and #41, respectively. Interestingly, the analysis also showed, in fraction #35, a potential lipid molecule matching a PI species containing an amino sugar residue (see discussion below). We note that we also detected LPIMIP 26:0 in fraction #43 (data not shown). Next, we undertook an in-depth study to characterize the fragmentation pathways of each the suppressor lipids. To this end, we used a combination of
hybrid QqTOF MS/MS and ion trap-orbitrap MSnanalysis.
Structural characterization of VLCFA-containing PI species Fragmentation pathways of PI species containing LCFA
moieties have previously been reported.[15,27]In contrast, not
much is known about the fragmentation pathways of PI species with VLCFA moieties (e.g. FA 26:0). Examining both TOF MS (data not shown) and FTMS spectra of fraction #35 showed that the most abundant VLCFA-containing PI species
is PI 42:1, detected as a singly charged deprotonated ion with m/z 947.6593 ( 0.1 ppm mass accuracy) (Fig. 3(A)). In addition, several other lower abundance VLCFA-containing PI species were detected including PI 42:0 with m/z 949.6747 ( 0.4 ppm mass accuracy and overlapping with second isotope of PI 42:1), PI 44:1 with m/z 975.6905 ( 0.2 ppm mass accuracy), PI 44:0 with 977.7061 ( 0.3 ppm mass accuracy and overlapping with second isotope of PI 44:1) and PI 40:0 with m/z 921.6436 ( 0.2 ppm mass accuracy).
To examine the fragmentation behavior of the VLCFA-containing PI species we subjected PI 42:1 (m/z 947.6593) to TOF MS/MS analysis (Figs. 3(B) and 3(E)). This showed three abundant fragment ions at m/z 395.3888, 253.2171 and 241.0116 matching a FA 26:0 acyl anion ( 1.7 ppm mass accuracy), FA 16:1 acyl anion ( 0.8 ppm mass accuracy) and
inositol-phosphate minus H2O (denoted as PI(241),
1.2 ppm mass accuracy). These fragment ions demonstrated that PI 42:1 is primarily composed of the molecular lipid species PI 16:1-26:0. The analysis also showed other structure-specific fragment ions. A subset of these fragment ions derive from neutral loss of the acyl moieties as a FA or as a ketene (KE), either alone or in combination with neutral loss of inositol (denoted as -PI(162)). The most abundant neutral loss fragments include m/z 711.4455 (-FA 16:1(KE), 0.2 ppm mass accuracy), 693.4348 (-FA 16:1(FA), -0.03 ppm mass accuracy), 551.2618 (-FA 26:0(KE), -1.6 ppm mass accuracy), 531.3811 (-FA 16:1(FA) -PI(162), -1.7 mass accuracy) and 389.2090 (-FA 26:0(FA) -PI(162), -2.2 ppm mass accuracy) (Figs. 3(B) and 3(E)).
Figure 2. Extracted ion chromatograms of lipid classes. A polar lipid extract of 4R3-17c was subjected
to preparative normal-phase chromatography followed by negative ion mode TOF MS analysis of all collected fractions. Intensities of lipid species in fractions were extracted from mass spectral data files using LipidView software. PI, PIM, PIMIP and PIN species with a total of 28 to 36 carbon atoms were grouped as LCFA-containing lipid species (upper panels). PI, PIM, PIMIP and PIN species with a total of 38 to 46 carbon atoms were grouped as VLCFA-containing lipid species (lower panels). LPI and LPIM lipids with a total of 14 to 18 carbon atoms were grouped as LCFA-containing lipid species (upper panels). LPI and LPIM lipids with a total of 20 to 26 carbon atoms were grouped as VLCFA-containing lipid species (lower panels).
Examining the stoichiometry between the different FA moiety-specific fragment ions showed that the acyl anion of FA 26:0 is more abundant than that of FA 16:1, and that fragments corresponding to the neutral loss of FA 16:1 are more abundant than the neutral loss of FA 26:0. To examine in further detail whether these fragment ion ratios are
indicative of the sn-1/sn-2 position of the FA moieties we subjected the synthetic standard PI 17:0/20:4, with known positional information, to TOF MS/MS analysis. This analysis showed that the acyl anion of the sn-1-positioned FA 17:0 is more abundant than the sn-2-positioned FA 20:4 (Supplementary Fig. S1(A), Supporting Information). The
Figure 3. Structural characterization of VLCFA-containing PI species. (A) FTMS spectrum of fraction
#35. Detected VLCFA-PI species are annotated by sum composition. (B) TOF MS/MS spectrum of m/z 947.7 ([PI 42:1–H] ) acquired using CE at 70 eV. Putative structures of annotated fragments are shown
in (E). (C) FTMS2spectrum of m/z 947.7 [PI 42:1–H] acquired using CID and CE at 34%. (D) ITMS3
spectrum of fragment ion m/z 693.6 derived from m/z 947.7. The MS3spectrum was recorded using
CID-CID with CE at 34% and 24%, respectively. (E) Tentative structures and predominant fragmentation pathways of PI 26:0/16:1. Specified m/z values are calculated based on the chemical composition of depicted structures.
analysis also demonstrated that fragment ions derived from neutral loss of sn-2-positioned FA 20:4 are more abundant than fragments from neutral loss of the sn-1-positioned FA 17:0. Notably, the preferential neutral loss of the sn-2-positioned FA moiety has previously been reported in tandem mass analysis of PI species using other types of mass
spectrometers.[15,27]Based on this information, and that the
most abundant fragment ions derived from PI 16:1-26:0 are the FA 26:0 acyl anion and neutral loss fragments of FA 16:1, we conclude that PI 16:1–26:0 is primarily composed of the positionally defined molecular lipid species PI 26:0/16:1. We note, however, that we cannot exclude the possibility that the positional isomer PI 16:1/26:0 is also present in lower
amounts.[26]
As an alternative strategy to investigate the fragmentation pathways of VLCFA-containing PI species we subjected PI 42:1 (m/z 947.6593) to multi-stage fragmentation analysis using
the ion trap-orbitrap instrument. By high-resolution FTMS2
analysis we confirmed the detection of the aforementioned PI 16:1-26:0-specific fragment ions (with mass accuracy less than 1.6 ppm, Figs. 3(C) and 3(E)). We again noticed preferential detection of the sn-1-positioned FA 26:0-derived acyl anion and fragment ions derived from neutral loss of
the sn-2-positioned FA 16:1. This observation was
corroborated by low-resolution ITMS2(data not shown) and
FTMS2 analysis of the synthetic standard PI 17:0/20:4
(Supplementary Fig. S1(B), Supporting Information). To further examine the fragmentation pathways of PI 26:0/16:1 we subjected the fragment ion m/z 693.4348 (derived from
neutral loss of FA 16:1 as a KE) to ITMS3analysis (Fig. 3(D)).
This analysis showed detection of structure-specific fragments at m/z 531.5, 395.6, 297.1, 241.4, 223.1 and 153.2 (see Fig. 3(E) for annotation of fragment ions).
Based on the structural characterization of PI 26:0/16:1, using both QqTOF and ion trap-orbitrap MS, we conclude
that VLCFA-containing PI species follow the same
fragmentation pathways as LCFA-containing PI species (Fig. 3(E)). Hence, no special considerations are needed when populating lipid databases with information on fragmentation of VLCFA-containing PI species. Importantly,
our finding that PI 26:0/16:1 is the most abundant
suppressor PI molecule contradicts that of the original
report. Lester et al.[12] inferred that PI 16:0/26:0, and not
PI 26:0/16:1, is the most abundant positional isomer based
analysis using radioactive labeling of PI molecules,
purification of VLCFA-containing PI species, treatment with
phospholipase A2to produce sn-1 LPI species, separation by
chromatography and scintillation counting. Notably, the FA composition of the produced LPI species was not validated by chemical derivatization and gas chromatography or running a synthetic LPI 16:0 standard, but was merely ascribed to be sn-1 LPI 16:0. Notably, our observation
corroborates findings of more recent studies reporting that
PI 26:0/16:1 is synthesized by wild-type[18] and mutant
lag1Δ lac1Δ LAG1 yeast.[19]
We note here that the tandem mass analysis of PI 42:1 also detected low abundance intensities of acyl anions matching FA 16:0, FA 18:1, FA 18:0, FA 24:1, FA 24:0 and FA 26:1 (data not shown). These fragments identify the molecular lipid species PI 16:0-26:1, PI 18:1-24:0 and PI 18:0-24:1 that each represent approximately 1 mol% of the total PI 42:1 intensity.
Structural characterization of PIM species
Evaluating the PIM species distribution in fraction #37 using FTMS analysis showed that PIM 42:0 with m/z 1111.7278 ( 0.1 ppm mass accuracy) is the most abundant PIM species (Fig. 4(A)). We also observed that PIM 42:1 with m/z 1109.7142 (1.8 ppm mass accuracy) is the second most abundant lipid species and that its second isotope is overlapping with the mono-isotopic peak of PIM 42:0. We note that this isotope interference is relatively minor given that the second isotope of PIM 42:1 only contributes to approximately 12% of the total intensity of m/z 1111.7278 (estimated using
isotope distribution information, data not shown).
Furthermore, the FTMS analysis also showed detection of other lower abundance PIM species including PIM 40:0 at m/z 1083.6986 (1.9 ppm mass accuracy), PIM 44:1 with m/z 1137.7448 (1.1 ppm mass accuracy) and PIM 44:0 with 1139.7579 ( 1.1 ppm mass accuracy and overlapping with the second isotope of PIM 44:1).
To examine the fragmentation pathways of PIM species we
subjected PIM 42:1 (m/z 1109.7142) to FTMS2analysis (Fig. 4
(B)). We note that the lower abundance PIM 42:1 was chosen in order to minimize isotopic interference when matching fragment ions to structural features of the PIM species. The
FTMS2 analysis showed two major fragment ions at m/z
389.2095, corresponding to the neutral loss of FA 26:0 and
the PIM head group (denoted as -FA 26:0(FA) –PIM(324),
1.0 ppm mass accuracy), and at m/z 531.3816, matching the neutral loss of FA 16:1 and the PIM head group (-FA 16:1
(FA) -PIM(324), 0.8 ppm mass accuracy). Moreover, several
other FA moiety-specific fragment ions were detected corresponding to the neutral loss of FA 16:1 (m/z 855.4869,
FA 16:1(FA), 0.8 ppm mass accuracy), the neutral loss of
FA 26:0 (m/z 713.3150, -FA 26:0(FA), 0.6 ppm mass accuracy),
the acyl anion of FA 26:0 (m/z 395.3891, 1.0 ppm mass
accuracy) and the acyl anion of FA 16:1 (m/z 253.2170, 1.2 ppm mass accuracy). In addition, a fragment ion at m/z 403.0642 corresponding to the PIM head group was also
detected (denoted as PIM(403), 1.2 ppm mass accuracy). In
addition, we also performed ITMS3analysis of the abundant
fragment ions with m/z 389.2095 (denoted as FA 26:0(FA) PIM(324)) and m/z 531.3816 (denoted as FA 16:1(FA) -PIM(324)). This analysis confirmed the assignment of FA 16:1 and FA 26:0 moieties in the precursor PIM 42:1 (data not shown). Based on the structural analysis we conclude that PIM 42:1 is primarily composed of the molecular lipid species PIM 16:1-26:0.
Evaluating the fragment ion stoichiometry derived from PIM 16:1-26:0 showed that (i) the acyl anion of FA 16:1 is slightly more abundant than that of FA 26:0 and (ii) that the intensity of fragments derived from neutral loss of FA 26:0 are more abundant than of fragments derived from neutral loss of FA 16:1. Given that structural characterization of PIM lipids from bacteria has previously shown that neutral loss of the sn-2-positioned FA moiety is more prominent than that
of neutral loss of the sn-1-positioned FA moiety,[22]we propose
that the PIM 16:1-26:0 molecule is primarily composed of the positionally defined isomer PIM 16:1/26:0 (Fig. 4(D)). We note, however, that we cannot exclude the possibility that the positional isomer PIM 26:0/16:1 is also present in lower amounts. Interestingly, the observation that PIM 16:1/26:0 is the predominant positional isomer is opposite to that of the
above described PI 26:0/16:1. This observation indicates that biosynthesis of PIM 16:1/26:0 can occur either by direct conversion of the metabolic precursor and positional isomer PI 16:1/26:0, or/and alternatively via PI 26:0/16:1 and FA
remodeling to produce PIM 16:1/26:0 (see discussion in Conclusions).
As an alternative approach to examine the fragmentation behavior of PIM species we also subjected PIM 42:1 (m/z
Figure 4. Structural characterization of PIM species. (A) FTMS spectrum of PIM species recovered in
fraction #37. Detected PIM species are annotated by sum composition. (B) FTMS2 spectrum of m/z
1109.7 ([PIM 42:1–H] ) recorded using CID and CE at 35%. (C) TOF MS/MS spectrum of m/z 1109.7 ([PIM 42:1–H] ) acquired using CE at 85 eV. (D) Tentative structures and predominant fragmentation pathways of PIM 16:1/26:0. Specified m/z values are calculated based on the chemical composition of depicted structures. (E) TOF MS/MS spectrum of m/z 1111.7 ([PIM 42:0–H] ) acquired using CE at 85 eV.
1109.7142) to tandem mass analysis using the QqTOF instrument (Fig. 4(C)). By TOF MS/MS analysis we confirmed the detection of structure-specific fragments that identified PIM 42:1 as the molecular species PIM 16:1-26:0 (with a mass accuracy less than 2.6 ppm). Moreover, we again noticed preferential detection of fragment ions derived from neutral
loss of FA 26:0. This observation corroborates the
abovementionedfindings and substantiates the identification
of PIM 16:1/26:0 (Fig. 4(D)) as being the predominant positional isomer. We note that the tandem mass analysis of PIM 42:1 also detected low abundance intensities of acyl anions matching FA 16:0, FA 18:1, FA 18:0, FA 24:1, FA 24:0 and FA 26:1. These fragments identify the molecular lipid species PIM 16:0-26:1, PIM 18:1-24:0 and PIM 18:0-24:1, which represents approximately 1.4 mol%, 0.6 mol% and 0.02 mol%, respectively, of the total pool of PIM 42:1.
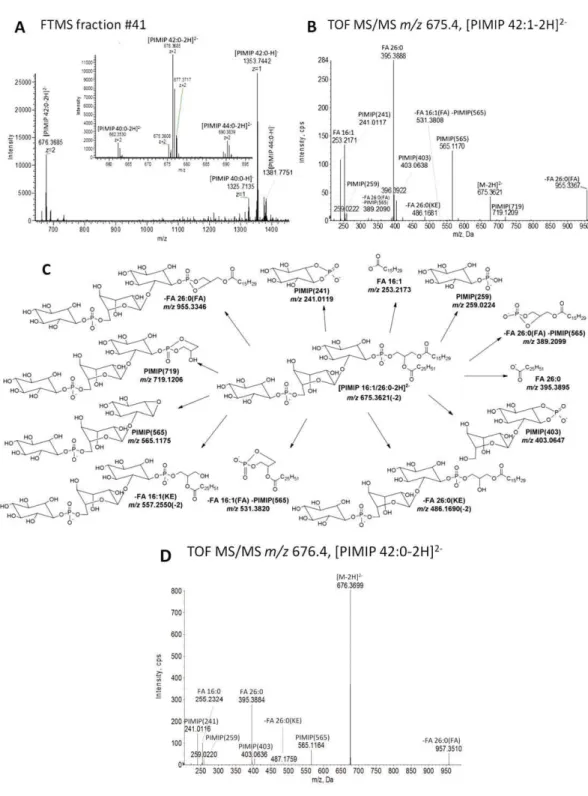
Figure 5. Structural characterization of PIMIP species. (A) FTMS spectrum of PIMIP species recovered
in fraction #42. Detected PIMIP species are annotated by sum composition. Insert shows m/z range with
doubly charged PIMIP species. (B) TOF MS/MS spectrum of m/z 675.4 ([PIMIP 42:1–2H]2
) acquired using CE at 45 eV. (C) Tentative structures and predominant fragmentation pathways of PIMIP 16:1/26:0. Specified m/z values are calculated based on the chemical composition of depicted
structures. (D) TOF MS/MS spectrum of m/z 676.4 ([PIMIP 42:0–2H]2
) acquired using CE at 43 eV.
Having delineated the fragmentation pathways of a representative PIM species we next evaluated the fragment ions derived from the more abundant PIM 42:0 at m/z 1111.7278. TOF MS/MS analysis showed two abundant fragment ions at m/z 255.2329 and m/z 395.3888 matching acyl anions of FA 16:0 ( 0.2 ppm mass accuracy) and FA 26:0 ( 1.7 ppm mass accuracy), respectively (Fig. 4(E)). In addition, we detected a repertoire of lower abundance fragment ions corresponding to neutral losses of FA 16:0 and FA 26:0 as well as PIM head group specific fragments. Based the detected fragment ion we deduce that PIM 42:0 is primarily the molecular species PIM 16:0-26:0. When inspecting the intensities of fragments matching neutral losses of FA moieties we observed that neutral loss of FA 26:0 was more abundant than that of FA 16:0, indicating that PIM 16:0-26:0 is composed primarily of the positionally defined molecular lipid species PIM 16:0/26:0. We note that the tandem mass analysis of PIM 42:0 also showed low abundance intensities of acyl anions matching FA 14:0, FA 18:0, FA 24:0 and FA 28:0. These fragments identify the molecular lipid species PIM 18:0-24:0 and PIM 14:0-28:0, which represent approximately 0.3 mol% and 0.5 mol%, respectively, of the total intensity of PIM 42:0 (data not shown).
Structural characterization of PIMIP species
PIMIP species contain two phosphate groups that can be deprotonated (Figs. 1 and 5(D)). Hence, PIMIP species can be detected as both singly and doubly charged ions in negative ion mode. High-resolution FTMS analysis of fraction #41, containing PIMIP species, showed a singly charged ion at m/z 1353.7442 ( 2.1 ppm mass accuracy) and a doubly charged ion at m/z 676.3685 ( 2.0 ppm mass accuracy) matching the most abundant molecule PIMIP 42:0 (Fig. 5(A)). The FTMS analysis also showed PIMIP 42:1 with singly charged m/z 1351.7268 (-3.4 ppm mass accuracy) and doubly charged m/z 675.3608 (-1.9 ppm mass accuracy). We note that the second isotope of PIMIP 42:1 overlaps with the mono-isotopic peak of PIMIP 42:0. However, this isotope interference is relatively minor given that second isotope of PIMIP 42:1 only contributes a maximum of 3.6% to the total peak intensity at m/z 1353.6663 and 676.3410 (estimated using isotope distribution information, data not shown). Furthermore, the analysis also showed detection of other lower abundance PIMIP species including PIMIP 44:1 with m/z 1379.7579 ( 3.5 ppm mass accuracy), PIMIP 44:0 with m/z 1381.7751 ( 2.3 ppm mass accuracy and overlapping with second isotope of PIMIP 44:1) and PIMIP 40:0 with m/z 1325.7135 ( 1.7 ppm mass accuracy, no major isotope interference from PIMIP 40:1 was observed).
To examine the fragmentation pathways of PIMIP species we subjected the doubly charged PIMIP 42:1 (m/z 675.3608) to TOF MS/MS analysis (Fig. 5(B)). We note that the lower abundance PIM 42:1 species was chosen in order to avoid isotopic interference when matching fragment ions to structural features in the PIMIP species. The TOF MS/MS
analysis showedfive abundant and singly charged fragment
ions: m/z 955.3367 matching the neutral loss of FA 26:0 (-FA 26:0(FA), 2.2 ppm mass accuracy), m/z 565.1170 matching the
PIMIP head group (denoted as PIMIP(565), 0.9 ppm mass
accuracy), m/z 395.3888 matching the acyl anion of FA 26:0 ( 1.8 ppm mass accuracy), m/z 253.2171 matching the acyl
anion of FA 16:1 ( 0.8 ppm mass accuracy), and m/z
241.0117 matching inositol-phosphate minus H2O derived
from the PIMIP head group (denoted as PIMIP(241), 0.8 ppm mass accuracy). Moreover, several other lower abundance fragment ions were detected matching a fragment ion of the PIMIP head group (m/z 719.1209, PIMIP(719), 0.4 ppm mass accuracy), neutral loss of FA 16:1 as a KE (m/z 557.2543(-2), FA 16:1(KE), 1.3 ppm mass accuracy), neutral loss of FA 16:1 as a FA (m/z 548.2494(-2), -FA 16:1(FA), 0.7 ppm mass accuracy), neutral loss of FA 26:0 as a KE
(m/z 486.1681(-2), -FA 26:0(KE), 1.9 ppm mass accuracy),
combined neutral loss of FA 26:0 and the PIMIP head group
(m/z 389.2090, -FA 26:0(FA) -PIMIP(565), 2.3 ppm mass
accuracy), and combined neutral loss of FA 16:1 and the PIMIP head group (m/z 531.3808, FA 16:1(FA) -PIMIP(565), 2.3 ppm mass accuracy). This repertoire of fragment ions confidently identifies PIMIP 42:1 as primarily the molecular species PIMIP 16:1-26:0 (Fig. 5(C)). We note that the tandem mass analysis of PIMIP 42:1 also detected low abundance intensities of acyl anions corresponding to acyl anions of FA 16:0, FA 18:1, FA 24:0 and FA 26:1. These fragments identify the molecular lipid species PIMIP 16:0-26:1 and PIMIP 18:1-24:0, which represent approximately 2.8 mol% and 0.7 mol%, respectively, of the total PIMIP 42:1 pool (data not shown).
When considering the stoichiometry between neutral loss fragments derived from PIMIP 16:1-26:0 we observed more abundant intensities of ions matching the neutral loss of FA 26:0 as compared to that of FA 16:1. Assuming that neutral loss of the sn-2-positioned FA moiety is favored from PIMIP species, as for PIs and PIMs and doubly charged
phosphoinositides,[27] we deduce that the most abundant
positional isomer of PIMIP 42:1 is PIMIP 16:1/26:0. We note, however, that we cannot exclude the possibility that the positional isomer PIMIP 26:0/16:1 is also present in lower amounts.
Having delineated the fragmentation pathways of a representative PIMIP species we next evaluated the fragment ions derived from the more abundant PIMIP 42:0 species at m/z
676.3699. TOF MS/MS analysis showed five abundant
fragment ions with structural features similar to that obtained by fragmentation of PIMIP 42:1. In particular, we detected acyl
anions matching FA 16:0 (m/z 255.2324, 2.4 ppm mass
accuracy) and FA 26:0 (m/z 395.3884, 2.8 ppm mass accuracy) identifying PI 42:0 as the molecular species PIMIP 16:0-26:0 (Fig. 5(D)). Based on the stoichiometry between neutral loss fragments generated by the loss of FA moieties, and also acyl anions, we deduce that the predominant position isomer of PIMIP 42:0 is PI 16:0/26:0.
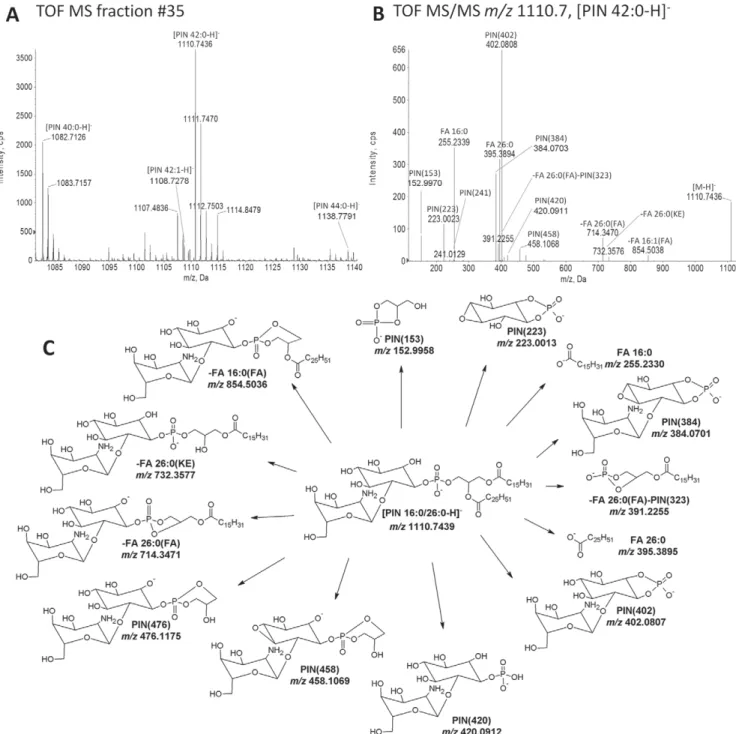
Structural characterization of PIN
The chromatographic separation of suppressor lipids also revealed a prominent singly charged ion with m/z 1110.7436 in fraction #35 (Figs. 2 and 6(A)). Given that the ion has an even nominal m/z suggests that it contains a nitrogen atom. To gain insights into the molecular structure of this putative lipid we subjected it to tandem mass analysis. TOF MS/MS analysis of m/z 1110.7436 showed two major fragment ions at m/z 395.3894 and 255.2339, corresponding to acyl anions of FA 26:0 ( 0.3 ppm mass
accuracy) and FA 16:0 (3.7 ppm mass accuracy),
respectively. Moreover, two fragment ions specific for inositol-phosphate and glycerol-phosphate were detected at m/z 223.0023 (4.5 ppm mass accuracy) and 152.9970 (7.6 ppm mass accuracy), respectively. Together, these fragment ions demonstrate that the lipid molecule at m/z 1110.7436 is a glycerophospholipid with FA 16:0 and FA 26:0 moieties, and an inositol-phosphate-containing head group. The tandem mass analysis also demonstrated three fragment ions at m/z 420.0911, 402.0808 and 384.0703, all featuring an even nominal m/z suggesting they contain a nitrogen atom. The mass difference between these ions is in
average 18.0108 amu, corresponding to a difference of H2O.
An identical mass difference is observed for inositol-phosphate mannoside fragments with m/z 421.0753 and 403.0647, derived from PIM lipids (Fig. 4(C)) and from MIPC
lipids.[13]This similarity in fragmentation behavior and the
observed even nominal m/z values suggest that the lipid molecule with m/z 1110.7436 contains an amino sugar residue. This prediction is supported by the mass differences between the PIM fragment with m/z 403.0647 (Fig. 4(D)) and m/z 402.0808 being 0.9839 Da, matching the exact mass
difference between an OH and a NH2group. This diagnostic
difference is also evident in the mass difference between the PIM fragment with m/z 421.0753 and m/z 420.0911.
Figure 6. Structural characterization of PIN species. (A) TOF MS spectrum of PIN species recovered in fraction #35. Detected
PIN species are annotated by sum composition. (B) TOF MS/MS spectrum of m/z 1110.7 ([PIN 42:0–H] ) acquired using CE at 95 eV. (C) Tentative structures and predominant fragmentation pathways of PIN 16:0/26:0. Specified m/z values are calculated based on the chemical composition of depicted structures.
Based on the structural features of the fragment ions we argue that the lipid molecule with m/z 1110.7436 is a PI molecule featuring an amino sugar residue linked to the inositol-phosphate head group. We annotate this lipid molecule as PIN 16:0–26:0, where ‘N′ indicates the amino sugar residue. Importantly, a lipid matching the mass of the novel suppressor lipid has previously been reported as the
second intermediate in the biosynthesis of
glycophosphatidylinositol-anchors in yeast.[28] This lipid
molecule contains the amino sugar glucosamine with linkage to an inositol-phosphate head group.
When considering the stoichiometry of neutral loss fragments derived from FA moieties we observed more abundant intensities of fragment ions matching neutral loss of the FA 26:0 (Fig. 6(B)). Assuming that neutral loss of the sn-2-positioned FA moiety is favored, as for PI and PIM lipids, we predict that the most abundant positional isomer is PIN 16:0/26:0. A tentative structure of PIN 16:0/26:0 and its fragment ions are presented in Fig. 6(C).
Having ascertained the identity of the PIN lipid we next evaluated whether other PIN species were detected. Examining the TOF MS spectrum of fraction #35 showed detection of also PIN 40:0 at m/z 1082.7126 (0.05 ppm mass accuracy), PIN 42:1 at m/z 1108.7278 ( 0.4 ppm mass accuracy) and PIN 44:0 at m/z 1138.7791 (3.4 ppm mass
accuracy) (Fig. 6(A)). We note that the second isotope of low abundance PIN 42:1 species do not cause any major isotope interferences on the mono-isotopic intensity of PIN 42:0, the most abundant PIN lipid molecule.
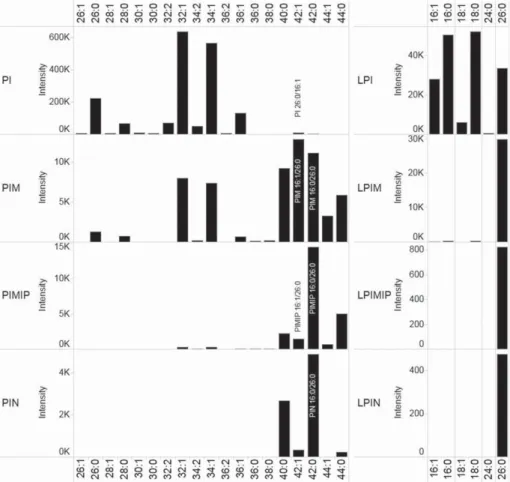
Profiling of suppressor lipids
Having characterized the most abundant suppressor lipids we next revisited the chromatographic data in order to evaluate the molecular profile of the suppressor lipids produced by the 4R3-17c strain. This analysis recapitulated that PI 42:1 (26:0/16:1), LPI 26:0, PIM 42:0 (16:0/26:0), LPIM 26:0, PIMIP 42:0 (16:0/ 26:0) and LPIMIP 26:0, PIN 42:0 (16:0-26:0) and LPIN 26:0 are the most abundant molecules within each class of suppressor lipid (Fig. 7). The analysis also showed a lipid class-dependent ratio between VLCFA- and LCFA-containing molecules: where PI lipids feature a very low proportion of VLCFA moieties, LPI and PIM lipids feature an intermediate proportion of VLCFA moieties, and LPIM, PIMIP, LPIMIP, PIN and LPIN molecules comprise almost exclusively VLCFA moieties. This observation is potentially linked to biosynthesis and turnover of the suppressor lipids, and suggests that a previously unrecognized degree of substrate-specificity is involved in the biosynthesis of the yeast suppressor lipids (see discussion in Conclusions).
Figure 7. Profile of suppressor lipids. Fractions with suppressor lipid classes were
isolated by preparative chromatography and analyzed by TOF MS (Fig. 2). Recorded peak intensities of lipid species are shown as function of sum composition. The main positionally defined isomers are indicated for lipid species characterized by tandem mass analysis (see Figs. 3, 4, 5 and 6).
CONCLUSIONS
In this study we revisited the structural characterization of suppressor lipids, described in 1993 to revive yeast that cannot
make essential sphingolipids.[12]Our investigation was aimed
at delineating the fragmentation pathways of the suppressor lipids using high-resolution MS technology, to profile the molecular composition of the suppressor lipids and to curate fragmentation information for enabling automated analysis of these lipid molecules. We note that the fragmentation information has been added to our ALEX lipid database and
can be queried using our online search engine.[20]The ALEX
lipid search engine also features fragmentation information on the mono-acyl suppressor lipids: LPI, LPIM and LPIMIP (see Supporting Information). Using our open source ALEX
software[21] this information can be used for automated
identification and quantitative monitoring of suppressor lipids in yeast and similar lipid molecules produced by certain
pathogenic bacteria.[23,24]
In addition to recapitulating the overall structural features of suppressor lipids our investigation also discovered a new class of suppressor lipids featuring an amino sugar residue (supposedly glucosamine) linked to a VLCFA-containing PI molecule. The analysis also provided new and unexpected insight into the incorporation of VLCFA moieties into PI, PIM and PIMIP lipids. Our mass spectrometric analysis demonstrated that the most abundant positionally defined molecular lipid species are PI 26:0/16:1, PIM 16:0/26:0 and PIMIP 16:0/26:0. The positional assignments for PIM 16:0/ 26:0 and PIMIP 16:0/26:0 match what has previously been
proposed, but not unambiguously verified, by Lester et al.[12]
In contrast, we identified the species PI 26:0/16:1, having the FA 26:0 moiety at the sn-1 position and not at the sn-2 position
as originally suggested. This novel finding, taken together
with the molecular species compositions of PIM, LPI and LPIM (Fig. 7), suggests that VLCFA-containing PI species are made by at least two distinct pathways.
One pathway, using Slc1–1, produces PI molecules with a VLCFA moiety at the sn-2 position (e.g. PI 16:1/26:0) which are presumably rapidly converted into PIM species (e.g. PIM 16:1/26:0) by the MIPC synthase. This notion is supported by the fact that the sn-2-positioned VLCFA moiety in PI molecules is stereochemically similar to the C-2-positioned FA moiety of sphingolipid IPC molecules, the archetypal substrates of the MIPC synthase. Moreover, several lines of evidence show that the MIPC synthase displays a substrate-specificity for IPC molecules with C-2-positioned VLCFA
moieties (ranging from FA 22:0 to FA 26:0),[14,29]which can
explain the higher proportion of VLCFA moieties in PIM species as compared to the precursor PI species.
The alternative pathway produces PI molecules with a VLCFA moiety at the sn-1 position (e.g. PI 26:0/16:1). This pathway could potentially be attributed to remodeling of LCFA-containing PI species (e.g. PI 16:1/18:1) by the concerted action of a phospholipase (e.g. Plb3) and the sn-1-specific acyltransferase Cst26 (A. Conzelmann, unpublished observations). It is tempting to speculate that PI molecules with a sn-1-positioned VLCFA moiety accumulate in SLC strains as these molecules are potentially relatively poor substrates of the MIPC synthase which prefers inositol-containing lipids with a VLCFA moiety at the C-2 atom. This would explain why we did not detect significant levels of PI
16:1/26:0 but instead found high levels of the opposite positional isomer PI 26:0/16:1. We note that additional studies are required to unravel the molecular mechanisms of suppressor lipid biosynthesis and that using high-resolution
MS technology, as applied herein, is a powerful
complementary tool for such investigations.
Acknowledgments
We thank Eva Duchoslav for advice on LipidView, Christian Klose for advise on large-scale lipid extraction and Ole N. Jensen for providing access to the TriVersa NanoMate. This work was supported by the VILLUM FONDEN (VKR023439).
REFERENCES
[1] R. C. Dickson, C. Sumanasekera, R. L. Lester. Functions and metabolism of sphingolipids in Saccharomyces cerevisiae. Prog. Lipid Res. 2006, 45, 447.
[2] R. Schneiter. Brave little yeast, please guide us to thebes: sphingolipid function in S. cerevisiae. Bioessays 1999, 21, 1004.
[3] R. Buede, C. Rinker-Schaffer, W. J. Pinto, R. L. Lester, R. C. Dickson. Cloning and characterization of LCB1, a Saccharomyces gene required for biosynthesis of the long-chain base component of sphingolipids. J. Bacteriol. 1991, 173, 4325.
[4] M. M. Nagiec, J. A. Baltisberger, G. B. Wells, R. L. Lester, R. C. Dickson. The LCB2 gene of Saccharomyces and the related LCB1 gene encode subunits of serine palmitoyltransferase, the initial enzyme in sphingolipid synthesis. Proc. Natl. Acad. Sci. USA 1994, 91, 7899.
[5] B. Weiss, W. Stoffel. Human and murine serine-palmitoyl-CoA transferase -- cloning, expression and characterization of the key enzyme in sphingolipid synthesis. Eur. J. Biochem. 1997, 249, 239.
[6] K. Hanada, T. Hara, M. Nishijima, O. Kuge, R. C. Dickson, M. M. Nagiec. A mammalian homolog of the yeast LCB1 encodes a component of serine palmitoyltransferase, the enzyme catalyzing thefirst step in sphingolipid synthesis. J. Biol. Chem. 1997, 272, 32108.
[7] M. P. Wymann, R. Schneiter. Lipid signalling in disease. Nat. Rev. Mol. Cell. Biol. 2008, 9, 162.
[8] K. Tarasov, K. Ekroos, M. Suoniemi, D. Kauhanen, T. Sylvanne, R. Hurme, I. Gouni-Berthold, H. K. Berthold, M. E. Kleber, R. Laaksonen, W. Marz. Molecular lipids identify cardiovascular risk and are efficiently lowered by simvastatin and PCSK9 deficiency. J. Clin. Endocrinol. Metab. 2014, 99, E45.
[9] R. C. Dickson, G. B. Wells, A. Schmidt, R. L. Lester. Isolation of mutant Saccharomyces cerevisiae strains that survive without sphingolipids. Mol. Cell. Biol. 1990, 10, 2176. [10] J. L. Patton, B. Srinivasan, R. C. Dickson, R. L. Lester.
Phenotypes of sphingolipid-dependent strains of Saccharomyces cerevisiae. J. Bacteriol. 1992, 174, 7180. [11] M. M. Nagiec, G. B. Wells, R. L. Lester, R. C. Dickson. A
suppressor gene that enables Saccharomyces cerevisiae to grow without making sphingolipids encodes a protein that resembles an Escherichia coli fatty acyltransferase. J. Biol. Chem. 1993, 268, 22156.
[12] R. L. Lester, G. B. Wells, G. Oxford, R. C. Dickson. Mutant strains of Saccharomyces cerevisiae lacking sphingolipids synthesize novel inositol glycerophospholipids that mimic sphingolipid structures. J. Biol. Chem. 1993, 268, 845.
[13] C. S. Ejsing, T. Moehring, U. Bahr, E. Duchoslav, M. Karas, K. Simons, A. Shevchenko. Collision-induced dissociation pathways of yeast sphingolipids and their molecular profiling in total lipid extracts: a study by quadrupole TOF and linear ion trap-orbitrap mass spectrometry. J. Mass Spectrom. 2006, 41, 372.
[14] C. S. Ejsing, J. L. Sampaio, V. Surendranath, E. Duchoslav, K. Ekroos, R. W. Klemm, K. Simons, A. Shevchenko. Global analysis of the yeast lipidome by quantitative shotgun mass spectrometry. Proc. Natl. Acad. Sci. USA 2009, 106, 2136. [15] R. Almeida, J. K. Pauling, E. Sokol, H. K. Hannibal-Bach,
C. S. Ejsing. Comprehensive lipidome analysis by shotgun lipidomics on a hybrid quadrupole-orbitrap-linear ion trap mass spectrometer. J. Am. Soc. Mass Spectrom. 2015, 26, 133. [16] C. Vionnet, C. Roubaty, C. S. Ejsing, J. Knudsen, A. Conzelmann. Yeast cells lacking all known ceramide synthases continue to make complex sphingolipids and to incorporate ceramides into glycosylphosphatidylinositol (GPI) anchors. J. Biol. Chem. 2011, 286, 6769.
[17] M. Benghezal, C. Roubaty, V. Veepuri, J. Knudsen, A. Conzelmann. SLC1 and SLC4 encode partially redundant acyl-coenzyme A 1-acylglycerol-3-phosphate O-acyltransferases of budding yeast. J. Biol. Chem. 2007, 282, 30845.
[18] R. Schneiter, B. Brugger, C. M. Amann, G. D. Prestwich, R. F. Epand, G. Zellnig, F. T. Wieland, R. M. Epand. Identification and biophysical characterization of a very-long-chain-fatty-acid-substituted phosphatidylinositol in yeast subcellular membranes. Biochem. J. 2004, 381, 941. [19] V. Cerantola, I. Guillas, C. Roubaty, C. Vionnet, D. Uldry,
J. Knudsen, A. Conzelmann. Aureobasidin A arrests growth of yeast cells through both ceramide intoxication and deprivation of essential inositolphosphorylceramides. Mol. Microbiol. 2009, 71, 1523.
[20] Available: http://mslipidomics.info/ALEX123/MS.php. [21] P. Husen, K. Tarasov, M. Katafiasz, E. Sokol, J. Vogt,
J. Baumgart, R. Nitsch, K. Ekroos, C. S. Ejsing. Analysis of lipid experiments (ALEX): a software framework for analysis of high-resolution shotgun lipidomics data. PLoS One 2013, 8, e79736.
[22] F. F. Hsu, J. Turk, R. M. Owens, E. R. Rhoades, D. G. Russell. Structural characterization of phosphatidyl-myo-inositol
mannosides from Mycobacterium bovis Bacillus Calmette Guerin by multiple-stage quadrupole ion-trap mass spectrometry with electrospray ionization. I. PIMs and lyso-PIMs. J. Am. Soc. Mass Spectrom. 2007, 18, 466. [23] M. E. Guerin, J. Kordulakova, P. M. Alzari, P. J. Brennan,
M. Jackson. Molecular basis of phosphatidyl-myo-inositol mannoside biosynthesis and regulation in mycobacteria. J. Biol. Chem. 2010, 285, 33577.
[24] W. J. Pinto, B. Srinivasan, S. Shepherd, A. Schmidt, R. C. Dickson, R. L. Lester. Sphingolipid long-chain-base auxotrophs of Saccharomyces cerevisiae: genetics, physiology, and a method for their selection. J. Bacteriol. 1992, 174, 2565.
[25] C. S. Ejsing, E. Duchoslav, J. Sampaio, K. Simons, R. Bonner, C. Thiele, K. Ekroos, A. Shevchenko. Automated identification and quantification of glycerophospholipid molecular species by multiple precursor ion scanning. Anal. Chem. 2006, 78, 6202.
[26] K. Ekroos, C. S. Ejsing, U. Bahr, M. Karas, K. Simons, A. Shevchenko. Charting molecular composition of phosphatidylcholines by fatty acid scanning and ion trap MS3fragmentation. J. Lipid Res. 2003, 44, 2181.
[27] F. F. Hsu, J. Turk. Characterization of phosphatidylinositol, 4-phosphate, and phosphatidylinositol-4,5-bisphosphate by electrospray ionization tandem mass spectrometry: a mechanistic study. J. Am. Soc. Mass Spectrom. 2000, 11, 986.
[28] G. Sipos, F. Reggiori, C. Vionnet, A. Conzelmann. Alternative lipid remodelling pathways for glycosylphosphatidylinositol membrane anchors in Saccharomyces cerevisiae. EMBO J. 1997, 16, 3494.
[29] K. Huitema, J. van den Dikkenberg, J. F. Brouwers, J. C. Holthuis. Identification of a family of animal sphingomyelin synthases. EMBO J. 2004, 23, 33.
SUPPORTING INFORMATION
Additional supporting information may be found in the online version of this article at the publisher's website.