ORIGINAL PAPER
Quantification of glucuronidated and sulfated steroids in human
urine by ultra-high pressure liquid chromatography quadrupole
time-of-flight mass spectrometry
Flavia Badoud&Elia Grata&Julien Boccard& Davy Guillarme&Jean-Luc Veuthey&Serge Rudaz& Martial Saugy
Received: 17 December 2010 / Revised: 3 February 2011 / Accepted: 4 February 2011 / Published online: 6 March 2011 # Springer-Verlag 2011
Abstract The urinary steroid profile is constituted by anabolic androgenic steroids, including testosterone and its relatives, that are extensively metabolized into phase II sulfated or glucuronidated steroids. The use of liquid chromatography coupled to mass spectrometry (LC-MS) is an issue for the direct analysis of conjugated steroids, which can be used as urinary markers of exogenous steroid administration in doping analysis, without hydrolysis of the conjugated moiety. In this study, a sensitive and selective ultra high-pressure liquid chromatography coupled to quadrupole time-of-flight mass spectrometer (UHPLC-QTOF-MS) method was developed to quantify major urinary metabolites simultaneously after testosterone intake. The sample preparation of the urine (1 mL) was performed by solid-phase extraction on Oasis HLB sorbent using a 96-well plate format. The conjugated steroids were analyzed by
UHPLC-QTOF-MSE with a single-gradient elution of
36 min (including re-equilibration time) in the negative
electrospray ionization mode. MSE analysis involved
Keywords Testosterone . Steroids . Glucuronide and sulfate conjugates . Ultra high-pressure liquid chromatography . Quadrupole time-of-flight . Quantification . MSE
Introduction
Anabolic androgenic steroids (AAS) are endogenous com-pounds that constitute the steroid profile, which is mainly based on testosterone (T), its epimer (epitestosterone (E)), its major metabolites (androsterone (A), etiocholanolone (Etio), 5α-androstan-3α, 17β-diol (5αAdiol) and 5β-androstan-3α, 17β-diol (5βAdiol)), and its precursor (dehydroepiandroster-one (DHEA)) excreted as phase II glucuro- or sulfoconjugated compounds in urine. The steroid profile provides information on the metabolism pathway of androgenic compounds and is essential to identify inborn errors and for the diagnosis of diseases related to steroid secretion [1,2]. These compounds are widely used as doping agents in sports and are not restricted to professionals, which becomes a public health concern [3] because steroid administration is used for
F. Badoud
:
E. Grata:
M. Saugy Swiss Laboratory for Doping Analyses,University Center of Legal Medicine, Geneva and Lausanne, Chemin des Croisettes 22,
1066 Epalinges, Switzerland
F. Badoud
:
J. Boccard:
D. Guillarme:
J.-L. Veuthey:
S. Rudaz School of Pharmaceutical Sciences, University of Geneva, University of Lausanne,Bvd d’Yvoy 20,
1211 Geneva 4, Switzerland
F. Badoud
:
E. Grata:
J. Boccard:
D. Guillarme:
J.-L. Veuthey:
S. Rudaz:
M. Saugy (*)Swiss Centre for Applied Human Toxicology, CMU, 1211 Geneva 4, Switzerland
e-mail: [email protected] DOI 10.1007/s00216-011-4779-8
parallel alternating acquisitions of both low- and high-collision energy functions. The method was validated and applied to samples collected from a clinical study performed with a group of healthy human volunteers who had taken testosterone, which were compared with samples from a placebo group. Quantitative results were also compared to GC-MS and LC-MS/MS measurements, and the correlations between data were found appropriate. The acquisition of full mass spectra over the entire mass range with QTOF mass analyzers gives promise of the opportunity to extend the steroid profile to a higher number of conjugated steroids.
enhancing physical appearance more than it is used for enhancing performance.
For doping control analysis, criteria have been established in the World Anti-Doping Agency (WADA) Prohibited List to highlight the alteration of the steroid profile by exogenous administration of T or its precursors. Indeed, intake of natural anabolic steroids is known to raise the urinary concentration of the parent steroid and its metabolites [4]. Therefore, some parameters, including a testosterone over epitestosterone ratio (T/E) greater than or equal to 4, are suspicious of exogenous T intake and necessitates further confirmation analysis by GC combustion isotope ratio mass spectrometry (GC-C-IRMS) [5].
The detection of AAS by gas chromatography coupled to mass spectrometry (GC-MS) has been extensively reported and reviewed [1,2,6,7]. GC-MS methods are sensitive and robust, but they suffer from time-consuming sample preparation, including hydrolysis and derivatization steps. Moreover, this procedure does not provide complete phase II information on the steroid profile. Thus, development of liquid chromatography–mass spectrometry (LC-MS) methods that allow for the direct analysis of steroid conjugates is of great interest for studying AAS metabo-lism. To date, the detection of intact glucuronidated and/or sulfated steroids has been reported by LC-MS/MS [8–14]. Furthermore, ultra high-pressure liquid chromatography (UHPLC) was recently used for metabolomics or profiling approaches for anabolic steroids in urine [15, 16]. This technique is of huge interest for resolving conjugated AAS, as it allows enhancement of efficiency with columns
packed with small particles (sub-2 μm), which provide
high peak capacity within a reasonable analysis time [17]. Mass spectrometry has also improved AAS detection, thanks to its sensitivity in detecting low amounts of substance in complex matrices [18]. Additionally, the improvement of time-of-flight or quadrupole time-of-flight mass spectrometry (TOF-MS or QTOF-MS) in terms of sensitivity and resolution has allowed its application in doping control analysis for accurate and sensitive full mass range acquisition [19–21]. QTOF-MS achieves accurate mass determination on molecular and fragment ions, giving structural information on unknown compounds or high-lighting undiscovered metabolites [22,23]. This technique is therefore popular for drug metabolism studies that require identification of new entities [24]. Moreover, QTOF-MS coupled to a MSEacquisition provides parent and fragment mass information in a single run, which is useful for targeted and metabolite profiling studies [25]. Finally, although TOF or QTOF mass analyzers could present a limited dynamic range, some authors have reported their use for quantitative evaluation [26–28].
In this study, the quantitative capabilities of QTOF-MS are explored for the determination of the steroid profile. A
UHPLC-QTOF-MSE approach is presented for the
simul-taneous quantification of 11 endogenous sulfo- or glucur-oconjugated steroids in human urine.
Experimental
Chemicals and reagents
All commercially available standards for AAS in glucuro-and sulfoconjugated form were acquired. 4-Androsten-17β-ol-3-one sulfate sodium salt (testosterone sulfate (TS)), 4-androsten-17α-ol-3-one sulfate sodium salt (epitestoster-one sulfate (ES)), 5β-androstan-3α-ol-17-(epitestoster-one sulfate sodium salt (etiocholanolone sulfate (EtioS)), 5-androsten-3β-ol-17-one sulfate sodium salt (dehydroepiandrosterone sulfate (DHEAS)), 4-androsten-17β-ol-3-one glucosiduronate (tes-tosterone glucuronide (TG)) 4-androsten-17α-ol-3-one
glu-cosiduronate (epitestosterone glucuronide (EG)), 5
β-androstan-3α-ol-17-one glucosiduronate (etiocholanolone glucuronide (EtioG)), 5-androsten-3β-ol-17-one glucosidur-onate (dehydroepiandrosterone glucuronide (DHEAG)), and 5α-androstan-3β, 17β-diol-3-glucosiduronate (α-diol-3-glucuronide (5αββ-AdiolG)) were purchased from Steraloids
(Newport, RI, USA). 5α-Androstan-3α-ol-17-one sulfate
triethylammonium salt (androsterone sulfate (AS)), 5α-androstan-3α-ol-17-one-3α-d-glucuronide (androsterone glucuronide (AG)), [16,16,17α-2H3]androst-4-en-17 α-ol-3-one sulfate triethylammonium salt (TS-d3), [16,16,17β-2H3] androst-4-en-17β-ol-3-one sulfate triethylammonium salt (ES-d3), [2,2,3β,4,4-2H5]5β-androstan-3α-ol-17-one sulfate triethylammonium salt (EtioS-d5), [2,2,4,4-2H4 ]5α-andro-stan-3α-ol-17-one sulfate triethylammonium salt (AS-d4), [16,16,17α-2H3]androst-4-en-17β-ol-3-one glucuronide (TG-d3), [16,16,17α-2H3]androst-4-en-17α-ol-3-one glucuro-nide (EG-d3), and [2,2,4,4-2H4]5α-androstan-3α-ol-17-one glucuronide (AG-d4) were purchased from the Australian Government National Measurement Institute (Pymble, Australia). Ultra pure water was provided by a Milli-Q system from Millipore (Bedford, MA, USA), and ULC-MS quality of water and acetonitrile was obtained from Biosolve (Chemie Brunschwig, Basel, Switzerland). Formic acid and ammonium hydroxide were purchased from Fluka (Buchs, Switzerland). Methanol was supplied by Merck (Darmstadt, Germany). Solutions
Stock standard solutions were obtained in methanol at a concentration of 1 mg/mL for all standards, except for AS and EtioS which were stocked at a concentration of 2 mg/mL.
Stock internal standards (I.S.s) solutions were obtained
in methanol at a concentration of 100 μg/mL, except for
solution was obtained by spiking 100μL of the TS-d3 and
ES-d3 stock solutions; 200μL of TG-d3, EG-d3, and
AG-d4; and 500 μL of AS-d4 and Etios-d5 into 10 mL of
methanol. Solutions were stored at −20 °C in glass tubes fitted with PTFE caps.
Sample preparation
A solid-phase extraction (SPE) on Oasis HLB (Waters, Milford, MA, USA) cartridges (30 mg, 30μm particle size) was developed for a 96-well plate format to extract selectively glucuro- and sulfoconjugated AAS from urine samples.
The loading solution was prepared by diluting 1 mL of urine with 1 mL of 2% formic acid solution spiked with 10μL of the I.S.s working solution. The extraction protocol was performed as follows: cartridges were first conditioned with 500μL of methanol and equilibrated with 500 μL of a solution containing 2% formic acid. The loading solution was added on the sorbents, and two washing steps followed. Cartridges were first washed with 1 mL of a 2% formic acid solution and were then washed with 1 mL of a 5% ammonium hydroxide/methanol (90%/10%, v/v)
solution. The elution step consisted of 500 μL of 40%
methanol/60% water. Eluates were transferred into conical glass tubes, and the wells were washed three times with 500μL of methanol. The solvent was evaporated to dryness under a gentle air stream, and the dry residue was recon-stituted with 100μL of a mixture of 30% acetonitrile/70% water.
UHPLC conditions
Separations were performed on an Acquity UPLC system
(Waters) with Acquity UPLC columns (BEH C18 150×
2.1 mm, 1.7μm) at 25 °C and 300 μL/min. A Van Guard
(Waters) pre-column (BEH C18, 5×2.1 mm, 1.7 μm) was
placed prior to the column. The mobile phase was (A) 0.1% formic acid in water and (B) 0.1% formic acid in acetonitrile. The gradient started linearly from 5% to 37% B over 25 min, followed by a washing step to 95% B for 3 min; the system was then re-equilibrated for 8 min. The injection volume was fixed at 20μL in the full loop mode, and samples were maintained at 4 °C in the autosampler.
QTOF-MSEparameters
Analyses were performed using a Micromass-Q-Tof Premier mass spectrometer (Waters) equipped with an electrospray ionization (ESI) source operated in the negative mode. MS operating conditions were set as follows: the desolvation gas flow was 800 L/h with a temperature of 360 °C, the capillary voltage was defined as 2.4 kV, and the cone voltage was kept
constant at 50 V. The micro-channel plates (MCPs) were operated at 1,750 V with 3.6 GHz time-to-digital converters (TDC), the source temperature was 120 °C, and the cone gas flow and the collision gas flow were set to 10 L/h and 0.25 mL/min, respectively.
The QTOF mass spectrometer was operated in wide-pass quadrupole mode with a low collision energy set at 5 eV in the first function, and a collision energy ramp from 5 to
70 eV was applied in the second function (MSE mode).
Data were collected in V-optics centroid mode over ranges of m/z 95–1,000 in the first function and m/z 50–1,000 in the second function with a scan time of 0.2 s and an interscan delay of 0.02 s. For the dynamic range enhancement (DRE) lockmass, a 2-ng/mL solution of leucine-enkephalin (Sigma-Aldrich, Buchs, Switzerland) was infused through the Lock Spray probe at 5μL/min.
Software
Data acquisition, data handling, and instrument control were performed using MassLynx Software (Waters). Validation
Guidelines
Experiments were conducted in compliance with the Internal Standards for Laboratories (ISL) of the World Anti-Doping Code [29]. Detailed procedures were found in
the “Identification method validation” section from the
International Conference for Harmonization (ICH)
guide-lines [30]. The US Food and Drug Administration (FDA)
guidelines [31] and the Third American Association of
Pharmaceutical Scientists (AAPS)/FDA Bioanalytical
Workshop in 2006 [32] were consulted for the assay of
stability and carry-over, respectively. Finally, the last concept paper regarding bioanalysis from the European
Medicines Agency (EMEA) [33] was referred for the
requirement of matrix effect study in case of LC-MS methods.
Selectivity
Because human urine samples may contain endogenous AAS, negative urine samples from children younger than 3 years old (one urine sample from a boy and two urine samples from girls) were collected for development and validation purpose because they contained a lower amount of steroids [34]. The levels of endogenous steroids (5αββ-AdiolG, TG, EG, DHEAG, AG, EtioG, TS, ES, DHEAS, AS, and EtioS) were estimated with the negative children's urine samples and were considered sufficiently low to be used for calibration and validation procedures (data not
shown). UHPLC-QTOF-MSEchromatograms were visually examined and compared for potential interferences with the negative urine samples. The negative urine samples were also spiked with the working I.S.s solution to ensure the lack of selectivity towards the I.S.s themselves.
Matrix effects
Matrix effects were determined using a method described by Matuszewski et al. [35] and revisited by Marchi et al. [36]. Assays were performed at low and high concentrations for each compound (5 and 200 ng/mL for 5αββ-AdiolG; 2 and 100 ng/mL for TS and ES; 10 and 200 ng/mL for TG, EG, and DHEAG; 500 and 2,000 ng/mL for DHEAS, AS, and EtioS; and 1,000 and 4,000 ng/mL for AG and EtioG). Four samples were prepared for the exhaustive classification of phenomena that estimated the global process efficiency (PE), the matrix influence on the MS signal (ME; including ionization perturbation), the extraction recovery (RE), and the extraction yield (EY). Indeed, PE was expressed as a percentage of the peak areas of the analytes spiked in the matrix to the areas of the analytes in a neat solution. The ME was evaluated by comparing the peak areas of the standards spiked in the extracted urine to that of the neat standard solution. The RE was obtained by calculating the ratio of the peak areas of the analytes spiked in the urine to the analytes reconstituted in a post-extracted matrix. Finally, the EY was expressed as the ratio of the peak areas of the standard extracted in water to that of the neat solution.
Quantitative analysis
Validation was conducted over three consecutive series. Calibration standards were prepared at four levels (k=4), and validation standards were prepared at five levels (k=5); each were performed in triplicate (n=3). Due to the high excretion of some steroids in urine, a dilution factor of 10 was tested among the validation standards for DHEAS, AS, EtioS, AG, and EtioG. Calibration curves were built based on the peak area ratios of 5αββ-AdiolG, TG, and DHEAG to TG-d3; EG to EG-d3; AG and EtioG to AG-d4; TS to TS-d3; ES and DHEAS to ES-d3; AS to AS-d4; and EtioS to EtioS-d5. The curves were generated over the ranges from 1 to 200 ng/mL for TS and ES; from 5 to 500 ng/mL for TG, EG, and DHEAG; from 1 to 500 ng/mL for 5αββ-AdiolG; from 50 to 3,000 ng/mL for DHEAS, AS, and EtioS; and from 500 to 8,000 ng/mL for AG and EtioG.
Results were expressed in terms of trueness, repeatability, and intermediate precision at each concentration level and were depicted in tolerance profiles for each compound [37,38].
Trueness was defined as the relative bias and was expressed as a percentage of the average recalculated
concentrations at each level. Repeatability was considered as the relative standard deviation (RSD) of the averaged intra-day standard deviation to the theoretical value. Finally, intermediate precision was expressed as the RSD of the inter-day standard deviation to the theoretical value. An external standard calibration with four levels of concentration was used in triplicate to quantify the metabolites in the real-case urine samples.
Carry-over
The carry-over effect was estimated by injecting an extracted spiked sample at its highest level of concentration (highest calibration standard) for each analyte, followed by three consecutive blank water samples. Peak areas in the extracted samples were considered as 100%, and if a peak was found at the expected retention time in the blank samples, it was expressed as a percentage of the previous sample peak area. Stability
Stability of analytes was evaluated by following the EMEA concept paper [33] with four different samples. Samples were either maintained at +4 °C or at batch temperature (ca. +22 °C), or they were subjected to three freeze (−20 °C) and thaw (ambient temperature) cycles before analysis, respectively. Finally, an additional sample was prepared for the evaluation of long-term stability at +4 °C. The time between each analysis was 48 h, except for the long-term stability assay, which was measured after 1 month. Application to clinical study
Urine samples from a clinical study conducted in 2006 at the Swiss Laboratory for Doping Analyses were analyzed with the method described herein. The clinical study consisted of the oral intake of 12 placebo and 19-norandrostenedione or testosterone undecanoate pills [39]. The pills were composed of 300 mg of mannitol for the placebo group, 80 mg of testosterone undecanoate and 115 mg of mannitol in the testosterone group, and 100 mg of 19-nor-4-androstenedione and 127 mg of mannitol in the 19-norandrostenedione group. The protocol of the study was set as described in Table 1, such that pill intakes occurred three times a week and urine spots were collected in accordance with the study design. Urine samples were split into 20-mL flasks and stored at −20 °C. For this research, selected samples of both the placebo (n=7) and testosterone (n=8) intake groups were investigated. Amongst the urine specimens, five kinds of samples were studied. However, a t00 sample was deter-mined with the urine collected before any pill intake occurred. Additionally, samples t01 to t05 were taken at 0, 4, 8, 24, and 200 h after pill intake, respectively. Samples
were defrosted at ambient temperature and analyzed. Because the clinical study samples were stocked for 4 years at−20 °C, five of them were re-analyzed with the GC-MS accredited method (STS 288) to ensure that their stability and validity had been preserved over the intervening years. No significant differences between the measured values for all of the analytes were observed. For the purpose of this study, samples were
analyzed by UHPLC-QTOF-MSE in triplicate, and the
analytes were quantified with an external calibration curve. Steroid concentrations were corrected using specific gravity, as was recommended in the WADA technical document [5]. Samples were randomized to avoid batch effect, and a calibration curve was analyzed at the beginning of the sample list and in the middle, to consider the susceptible loss of sensitivity during the batch. One batch constituted 15 samples after triplicate studies and, in addition, a calibration curve of four levels (57 samples) was determined.
Results and discussion Method development AAS
The steroid profile includes the measurement of glucuro-and sulfoconjugated T, E, A, Etio, 5α-Adiol, glucuro-and 5β-Adiol,
whose structures are presented in Fig. 1. In regards to the reference population concentration ranges, high sensitivity is required for some of the analytes, such as TG, EG, TS, ES, and DHEAG, because they are normally excreted in low amounts (0.5 to 40 ng/mL) in urine. Notably, the only available standard for the 5α- and 5β-Adiol was the isomer 5αββ-AdiolG, which was a minor metabolite and was excreted in low concentrations (0.5 to 10 ng/mL). On the other hand, some analytes are highly excreted in urine, with concentrations reaching 8,000 ng/mL (AG, EtioG, DHEAS, AS, and EtioS) [4, 7, 11]. Therefore, an analytical method able to extract sulfated and glucuronidated steroids together with selective chromatographic separation to resolve isomers was mandatory.
Sample preparation
A SPE procedure was developed for conjugated AAS, as it allowed for superior sample clean-up and analyte pre-concentration. Oasis HLB cartridges of 30 mg were used to extract simultaneously the sulfated and glucuronidated steroids from the 96-well plate with high sample capacity. A 1-mL volume of the urine specimen was then loaded onto the cartridges with 1 mL of 2% formic acid, which ensured constant pH. Two washing steps were successively performed. The first was performed in acidic conditions (2% formic acid), and the second was performed with a
Testosterone (T) Epitestosterone (E) Androsterone (A) DHEA Etiocholanolone (Etio) 5 -Adiol 5 -Adiol Sulfate moiety (S) O S O H O O -R= UGT SULT MW 288.20 MW 288.20 MW 292.24 MW 292.24 MW 290.22 MW 290.22 MW 288.20 MW 97.96 MW 194.14 -H2O -H2O R= Glucuronide moiety (G) O OR RO O O OR RO O H RO O H RO OR H RO OR H O Xn OH OH OH CO2H Fig. 1 Structures of the
investi-gated compounds. At the right side of the picture, phase II metabolism enzymes were presented. Uridine diphosphate-glucuronosyltransferase (UGT) for glucuronide conjugation and sulfotransferase (SULT) for sulfate conjugation mechanism
Table 1 Design of the clinical study. Pill administrations were performed during the four first weeks. Spot urine samples were collected during the first week, during the second week, on day 24 during the third week and finally on the last day of the study
Week 1 2 3 4 5 6
Pill intake/week 3 3 3 3 -
-Urine spot First day Every day Day 24, 4 spots Last day
basic solution containing organic solvent (5% ammonium hydroxide in methanol, 90%/10%, v/v). The proportion of methanol was evaluated to avoid the elution of the analytes and was set at a 10% maximum. Various conditions were also tested for the elution, from 30% to 95% methanol. Elution with 40% methanol was selected, as it allowed the complete recovery of the analytes excreted at low concen-tration and adjusted the extracted amount for the com-pounds found at high concentrations in urine, such as DHEAS, which could saturate the QTOF detector equipped with TDC cards. Finally, a preconcentration factor of 10 was obtained, which was necessary to detect and quantify the lowest excreted endogenous AAS. Extraction recoveries (RE) were between 78% and 137% for the compounds excreted at low concentrations and between 74% and 120% for the high-concentration compounds, as presented in Table2. Notably, the REs higher than 100% were attributed to a salting-out effect that could increase the amount extracted in the urine, compared to water, due to the presence of salts, fatty acids, amino acids, or organic bases in urine matrix. As an exception, DHEAS was extracted with REs of 42% and 49% at low and high concentrations, respectively. However, as this analyte was observed at a high amount in urine, its detection was not altered. Overall, this method allowed for the simultaneous extraction of the sulfated and glucuronidated steroid from the urine matrix with satisfactory RE.
UHPLC
Initial UHPLC conditions Various column chemistries, mobile phase compositions, and temperatures were evaluated to obtain the highest possible selectivity between analytes, especially between the different pairs
of isomers (TG/EG, TS/ES, AG/EtioG, and AS/EtioS), not resolved by MS. For the stationary phase chemistry
screening, specific short columns (50 × 2.1 mm, 1.7 μm)
of various reversed phase chemistries (e.g., C18, phenyl, and C18 shield) were selected to evaluate the selectivity in a minimum period of time. Two different mobile phase additives, ammonium formate buffer (20 mM at pH 3.0) and 0.1% formic acid, were tested. Finally, the column temperature was maintained either at 30 °C or 50 °C to assess the influence of this parameter on the selectivity.
However, due to the difficult separation of the isomers, additional combinations of column chemistries, mobile phase additives, and temperatures were tested. To limit the number of conducted experiments, only two gradients (5% to 70% acetonitrile in 8.6 and 26 min) were performed, and the retention times were computed on modeling software (Osiris v.4.2, Datalys, Grenoble, France). By modeling the behavior of each compound, the software highlighted the best separation that can be attained with a given condition. For steroids, the best separation of critical pairs of isomers (AS/EtioS and AG/EtioG) was obtained with the Acquity BEH C18 column at a temperature of 50 °C and with 0.1% formic acid added to the mobile phase. Nevertheless, the resolution between the most critical pair of isomers, AS and EtioS, was still not sufficient (Rs equal to 0.6) and endogenous interferences from the urine co-eluted with DHEAG, in particular. Therefore, final conditions were performed on a 150-mm column length to ensure enough selectivity for the quantitative measurement of DHEAG in urine.
Separation optimization To start, an isocratic step was performed with 27% acetonitrile, and three different
Table 2 Process efficiency, matrix effect, extraction recovery, and extraction yield for the investigated analytes at low and high concentration
Low conc. High conc. Low concentration High concentration
[ng/mL] [ng/mL] PE (%) ME (%) RE (%) EY (%) PE (%) ME (%) RE (%) EY (%) αββ-AdiolG 5 200 82 80 103 98 105 92 114 110 TG 10 200 127 98 130 110 108 91 96 86 EG 10 200 136 80 137 110 120 105 114 109 DHEAG 10 200 67 86 78 96 89 95 94 99 AG 1,000 4,000 111 90 124 92 101 98 103 83 EtioG 1,000 4,000 109 80 136 97 126 104 120 100 TS 2 100 122 86 90 67 126 107 118 53 ES 2 100 101 107 94 106 90 100 90 91 DHEAS 500 2,000 43 102 42 58 70 111 49 74 AS 500 2,000 84 95 89 98 75 102 74 83 EtioS 500 2,000 90 91 99 101 75 91 82 83
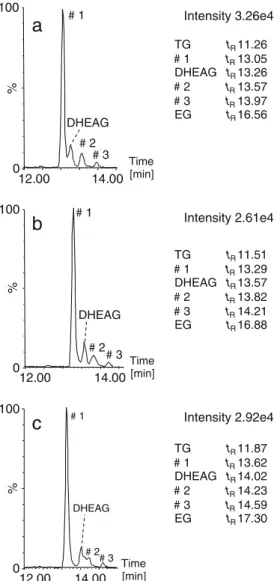
constituents were detected under the peak of DHEAG when extracting the trace at m/z 463.2332 ±0.0500 Da, corresponding to the theoretical exact mass of deprotonated DHEAG. Here, HPLC modeling software was employed, and the best separation was obtained at 30 °C with a gradient of 5% to 37% acetonitrile over 25 min and at a
flow rate of 300 μL/min, as shown in Fig. 2a for the
extracted ion DHEAG at m/z 463.23±0.05 Da. However, higher chromatographic resolution was still mandatory for separation between DHEAG and an unknown endogenous compound #1. In this case, the impact of a lower column temperature was evaluated in a univariate way, and the corresponding chromatograms are presented in Fig.2b, c. A sufficient separation for all of the analytes was finally obtained at 25 °C. Indeed, when the column was
main-tained at 30 °C, compound #1 was co-eluting with DHEAG, whereas at 20 °C, the peak of the analyte #2 interfered with DHEAG. The three unknown peaks were most probably isomers of DHEAG.
To summarize, the best conditions to separate the investigated analytes with sufficient selectivity and reason-able analysis time (36 min) was finally achieved on an
Acquity BEH C18 (150×2.1 mm, 1.7 μm) column, at a
temperature of 25 °C, using a gradient from 5% to 37% acetonitrile in 25 min, and at a flow rate of 300 μL/min.
QTOF-MSE
Both ESI-positive and ESI-negative modes were tested for the ionization of sulfated and glucuronidated steroids. As expected, the highest sensitivity was obtained by analyzing the conjugated steroids as their deprotonated form [M−H]− in the negative ESI mode. Specifically, the selectivity obtained by the coupling of the UHPLC to the QTOF-MS
is represented in Fig. 3. Here, two chromatograms were
extracted from the same analysis to show separately the sulfoconjugated (Fig. 3a) and glucuroconjugated (Fig. 3b) steroids. Notably, the compounds were resolved either by MS or by UHPLC regarding steroid isomers.
For the MS acquisition mode illustrated in Fig.4aandb for sulfoconjugated and glucuroconjugated DHEA, respec-tively, MSEwas selected. It consisted of a first function that was obtained in wide-pass quadrupole mode at a low fixed collision energy (5 eV) and an alternated second function with ramped collision energy from 5 to 70 eV. This mode was achieved to obtain maximum information in a single run, with no pre-selection of a precursor ion in the quadrupole.
Specifically, by using ramped collision energy, the depro-tonated molecule was maintained, together with the generated
fragments. Moreover, as discussed elsewhere [11], the
sulfoconjugated steroids had a low fragmentation pattern. The unique ion formed by applying collision energy on the sulfoconjugated steroid was the sulfate moiety itself at m/z 96.96 (HSO4−; Fig. 4a). The ramped collision energy also yielded more information regarding the fragmentation of glucuroconjugates (Fig. 4b), but they were not specific, as fragments were generated principally from the glucuronic acid itself [13]. For example, the fragment at m/z 287.20, corresponding to the free steroid (neutral loss of glucuronic acid, m/z 176.03), was found at less than 10% of the base peak, whereas several fragments of glucuronic acid were also observed (m/z 157.02, m/z 113.02, m/z 85.03, and m/z 75.01). The parent and fragment ions obtained for sulfated and glucuronidated steroids are listed in Table3.
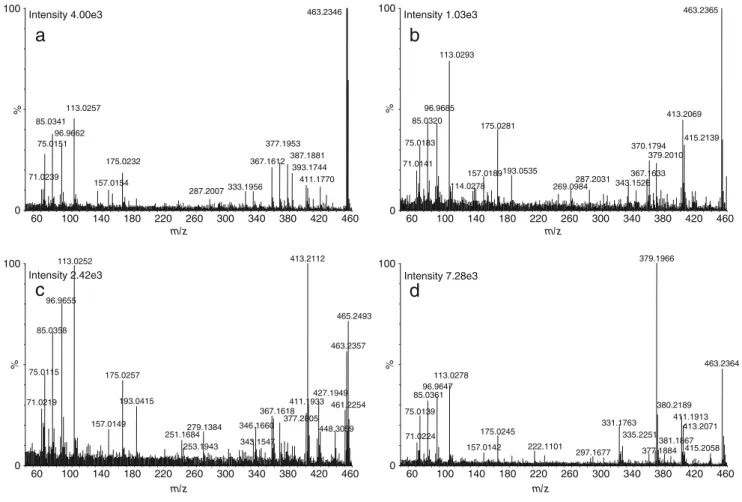
The MSEmode was used as an example to gather more
information about unknown peaks #1, #2, and #3; the MSE Time [min] % 0 100 Intensity 3.26e4 # 1 # 3 DHEAG # 2
a
TG tR 11.26 # 1 tR13.05 DHEAG tR 13.26 # 2 tR13.57 # 3 tR13.97 EG tR 16.56 % 0 100 Intensity 2.61e4 # 1 # 2 # 3 DHEAGb
TG tR 11.51 # 1 tR13.29 DHEAG tR 13.57 # 2 tR13.82 # 3 tR14.21 EG tR 16.88 Time [min] 12.00 14.00 12.00 14.00 12.00 14.00 % 0 100 Intensity 2.92e4 # 1 # 2 # 3 DHEAGc
TG tR 11.87 # 1 tR13.62 DHEAG tR 14.02 # 2 tR14.23 # 3 tR14.59 EG tR 17.30 Time [min]Fig. 2 Extracted ion chromatogram (XIC) at m/z 463.23 ±0.05 Da in urine matrix. Chromatographic separation at 300 μL/min with a gradient from 5% to 37% acetonitrile over 25 min at a 30 °C, b 25 °C, and c 20 °C. Peaks #1, #2, and #3 were endogenous isomers of DHEAG
spectra are shown in Fig.5a–dfor each peak. The spectra contained characteristic fragments of DHEAG together with parent and product ions from the co-eluting peaks. However, without selecting a precursor ion, co-eluting peak fragments obtained in the spectra were also viewed. In these cases, we linked a precursor ion to its product ions by use of retention time information and known mass defect (glucuro-nide, sulfate, or water loss). Another way to determine this relationship between the ions could also be automatically establish by a dedicated software. As observed in Fig.5a, ions corresponding to peak #1 were the parent ion at m/z 463.23 and fragment ions at m/z 287.20, m/z 157.02, m/z 113.02, m/z 85.03, and m/z 75.01. These ions are common to a glucuronide conjugate, as reported in Table 3. However, interfering ions at m/z 367.15 and 96.96, corresponding to a sulfoconjugated steroid and to the inorganic hydrogenosul-fate (HSO4−), respectively, were also present in the spectrum, due to nonselective fragmentation. For further confirmations, MS/MS experiments were conducted on each peak with selection of the parent ion (m/z 463.23) as the precursor ion for fragmentation at a fixed collision energy of 25 eV (data not shown). The same fragments were obtained with MS/MS
and MSE acquisition modes by selecting either the m/z
463.23 precursor ion or by applying the nonselective ramped
collision energy. The advantages of MSE over MS/MS
acquisition mode were the nonselective approach allowing detection and characterization of new entities in metabolite studies, as all data were collected in exact mass mode.
Moreover, the information provided by the QTOF-MSE
acquisition was particularly relevant for biological matrices, as data could be processed retroactively.
Validation of the study Selectivity
An additional experiment was previously performed to improve resolution by injecting the analytes extracted in the matrix on a 300-mm column length. Here, two 150-mm columns were connected in series, and the optimized method was transferred geometrically by
adjusting the injection volume (40 μL) and the gradient
profile (5% to 37% acetonitrile in 83.9 min).
Further-more, the flow rate was reduced (180 μL/min) to reach
a backpressure compatible with the system. Overall, no interfering peaks were observed in the extracted MS traces for all analytes.
As the investigated analytes are endogenous com-pounds, selectivity was evaluated by the quantitative analysis of six independent adult urine samples, and the results were compared to the GC-MS accredited method measurements. For the 11 analytes, the results obtained were not significantly different than those obtained by GC-MS, suggesting no over- or underestimation. More-over, the MSEacquisition mode allowed for the enhance-ment of the selectivity. Specifically, the combined information of the molecular ion with the fragmentation pattern obtained in the second function allowed for specific confirmation ions. The selectivity was also estimated by comparing I.S.s spiked in negative children's urine specimens to adult urine specimens. For each I.S., no co-elution was observed at the selected retention time and m/z window. % 0 100 Intensity 1.76e4 16.40 12.64 13.68 Time [min] a TS ES DHEAS m/z 367.16 m/z 369.17 Sulfated steroids Time [min] 2.00 6.00 10.00 14.00 18.00 22.00 26.00 30.00 34.00 2.00 6.00 10.00 14.00 18.00 22.00 26.00 30.00 34.00 % 0 100 Intensity 1.47e3 20.54 11.52 13.60 16.88 21.18 10.32 Glucuronidated steroids -AdiolG 19.57 20.34 AS EtioS TG DHEAG EG EtioG AG m/z 463.23 m/z 465.24 m/z 467.26 b Fig. 3 UHPLC-QTOF-MS
chromatogram (Acquity BEH C18
150×2.1 mm; 1.7μm) of the investigated analytes. For better readability, the chromatogram was presented in two parts. a The traces corresponded to sulfoconjugated steroids were extracted at m/z 367.16±0.05 Da and 369.17±0.05 Da. b The traces from glucuroconjugated steroids were extracted in the chromatogram at m/z 467.26± 0.05 Da, 463.23±0.05 Da, and 465.24±0.05 Da
Matrix effects
The ME were measured on the basis of experiments
described by Matuszewski et al. [35] and classified
according to the method described by Marchi et al. [36] in case of SPE prior to LC-MS. The measured PE, ME, RE, and EY, at low and high concentrations, are presented in
Table 2. PE was considered suitable for quantitative
analysis, and ME reflected no ion suppression or enhance-ment effect with values between 80% and 111% at low and high concentrations. Additionally, REs were satisfactory for all of the analytes, as a salting-out effect, due to the presence of the matrix, enhanced the detection of most analytes at low concentrations, except for DHEAS, which was extracted with less than 50% at both concentrations.
However, as discussed before, this compound was excreted at a high concentration, so that the loss during the extraction step was not detrimental to its sensitivity. Lastly, EY was good, with values near 100% for all analytes except for TS and DHEAS. For these compounds, EY was lower than 70% and 80%, respectively, but it was considered sufficient to detect them at low concentrations. Quantitative analysis
Results of the validation assays were built into a tolerance profile for each compound with aβ-value of 80%, as shown in Fig. 6, and the investigated parameters are reported in Table 4. As recommended elsewhere [31], a variability of 30% was found to be acceptable for the quantification of Function 1: MS 5eV
Molecular ion
Molecular ion and fragments
Function 2: MSE5 to70 eV XIC 463.23 0.05 Time [min] 10.00 12.00 14.00 16.00 18.00 20.00 % 0 100 Intensity 2.61e4 DHEAG m/z 100 140 180 220 260 300 340 380 420 460 % 0 100 Intensity 3.32e4 463.2366 377.1977 157.0134 113.0244 367.1578393.1767 464.2414 m/z 60 100 140 180 220 260 300 340 380 420 460 % 0 100 Intensity 2.01e3 463.2359 113.0294 96.9695 85.0339 75.0180 71.0212 413.2054 175.0233 157.0180193.0451 367.1591370.1737 343.1386 269.1339 415.2101 287.2094 Function 1: MS 5eV Molecular ion
Molecular ion and fragments
Function 2: MSE5 to70eV XIC 367.16 0.05 Time [min] 10.00 12.00 14.00 16.00 18.00 20.00 % 0 100 Intensity 3.64e4 DHEAS m/z 100 140 180 220 260 300 340 380 % 0 100 Intensity 9.29e4 367.1593 368.1616 369.1609 370.1655 m/z 70 110 150 190 230 270 310 350 390 % 0 100 Intensity 2.87e4 367.1582 96.9606 98.9592 368.1581 369.1620 370.1547 a b Fig. 4 UHPLC-QTOF-MSE acquisition mode. a In the first function obtained at low collision energy (5 eV), the molecular ion of DHEAS is shown at m/z 367.16, while the sulfate moiety fragment at m/z 96.96, together with the molecular ion, is obtained in the second function with ramped energy from 5 to 70 eV. b Spectra at low and ramped energy were obtained from the peak trace of DHEAG. The molecular ion was found in the first function at m/z 463.23. A fragmentation pattern was obtained in the second function with ions at m/z 287.20, m/z 157.01, m/z 113.02, m/z 85.03, m/z 75.01, and m/z 71.02, together with the molecular ion at m/z 463.23
these steroids in urine. Additionally, for the calibration, a linear regression was obtained after 1/x-weighting for each analyte.
Trueness, repeatability, and intermediate precision were found to be acceptable over the validated range for the
majority of compounds, as shown in Table 4. However,
the lower limit of quantification was estimated from the absolute tolerance profile at 2, 4, and 5 ng/mL for TS, ES, and 5αββ-AdiolG, respectively, instead of 1 ng/mL, as
m/z % 0 100 Intensity 4.00e3 463.2346 113.0257 85.0341 75.0151 71.0239 96.9662 377.1953 367.1612 175.0232 157.0154 333.1956 287.2007 387.1881 393.1744 411.1770 m/z % 0 100 Intensity 1.03e3 463.2365 113.0293 85.0320 75.0183 71.0141 96.9685 413.2069 175.0281 157.0189 114.0278 370.1794 193.0535 367.1633 343.1526 269.0984 287.2031 379.2010 415.2139 m/z % 0 100 Intensity 7.28e3 379.1966 113.0278 96.9647 85.0361 75.0139 71.0224 331.1763 175.0245 157.0142 222.1101 297.1677 335.2251 377.1884 380.2189 411.1913 381.1867 413.2071 463.2364 415.2058
a
b
m/z 60 100 140 180 220 260 300 340 380 420 460 60 100 140 180 220 260 300 340 380 420 460 60 100 140 180 220 260 300 340 380 420 460 60 100 140 180 220 260 300 340 380 420 460 % 0 100 Intensity 2.42e3 413.2112 113.0252 96.9655 85.0358 75.0115 71.0219 175.0257 157.0149 193.0415 411.1933 367.1618 346.1660 279.1384 251.1684 253.1943 343.1547 377.2805 465.2493 463.2357 427.1949 461.2254 448.3059c
d
Fig. 5 MSEspectra of a peak #1 (tR, 13.29), b DHEAG (tR, 13.57), c peak #2 (tR, 13.82), and d peak #3 (tR, 14.21) obtained in the second
function with ramped energy from 5 to 70 eV
Table 3 Parent and fragment ion assignment for glucuronidated and sulfated phase II metabolites of testosterone
Compounds Deprotonated molecule m/z Fragments m/z
Sulfated steroids AS, EtioS [M−H]− 369.17 [HSo4]− 96.96
TS, ES, DHEAS [M−H]− 367.16
Glucuronidated steroids AG, EtioG [M−H]− 465.24 [M–H–H2O]− 447.23
[M–H–Gluc]− 289.20 αββ-AdiolG [M−H]− 467.26 [M–H–H 2O]− 449.25 [M–H–Gluc]− 291.21 TG, EG, DHEAG [M−H]− 463.23 [M–H–H2O]− 445.22 [M–H–Gluc]− 287.20
Common fragmentation to all glucuonides [Gluc–H]− 175.02
[Gluc–H–H2O]− 157.01
[Gluc–H–H2O–CO2]− 113.02
[Glu–?]− 85.03
[Glu–?]− 75.01
the repeatability and intermediate precision were above 30%. The tenfold dilution factor for the four analytes excreted in urine at high amounts (AS, EtioS, AG, and EtioG) was also validated. However, it is notable that, at the lower limit of quantification (LLOQ), the number of points per peak was estimated at a minimum of 30,
which was sufficient for the quantitative analysis,
because it took into account the MSE-ramped collision
energy function and the DRE lockmass function. The method was thus considered adequate for the determina-tion of endogenous sulfated and glucuronidated steroids in urine. 0 500 1000 1500 2000 2500 3000 3500 4000 4500 0 500 1000 1500 2000 2500 3000 3500 4000 4500 0 500 1000 1500 2000 2500 3000 3500 4000 4500 0 50 100 150 200 250 300 Theoretical concentration [ng/mL] TS AS Range: 1-200 ng/mL Range: 50-3,000 ng/mL ES Range: 1-200 ng/mL EtioS Range: 50-3,000 ng/mL DHEAS Range: 50-3,000 ng/mL Theoretical concentration [ng/mL] Theoretical concentration [ng/mL]
Theoretical concentration [ng/mL] Theoretical concentration [ng/mL]
Calculated concentration [ng/mL] Calculated concentration [ng/mL]
Calculated concentration [ng/mL] Calculated concentration [ng/mL] Calculated concentration [ng/mL]
0 50 100 150 200 250 300 0 50 100 150 200 250 0 50 100 150 200 250 0 2000 4000 6000 8000 10000 12000 0 100 200 300 400 500 600 700 0 100 200 300 400 500 600 700 0 100 200 300 400 500 600 700 0 100 200 300 400 500 600 700 AG Range: 100-8,000 ng/mL EG Range: 5-500 ng/mL EtioG Range: 100-8,000 ng/mL DHEAG Range: 5-500 ng/mL TG Range: 5-500 ng/mL Calculated concentration [ng/mL]
Theoretical concentration [ng/mL] Theoretical concentration [ng/mL]
Theoretical concentration [ng/mL] Theoretical concentration [ng/mL] Theoretical concentration [ng/mL]
Calculated concentration [ng/mL]
Calculated concentration [ng/mL] Calculated concentration [ng/mL] Calculated concentration [ng/mL]
-AdiolG Range: 1-500 ng/mL Theoretical concentration [ng/mL] Calculated concentration [ng/mL] 0 2000 4000 6000 8000 10000 12000 0 1000 2000 3000 4000 0 1000 2000 3000 4000 0 1000 2000 3000 4000 0 2000 4000 6000 8000 10000 0 200 400 600 0 200 400 600 0 200 400 600 0 200 400 600 0 2000 4000 6000 8000 10000
Fig. 6 Absolute tolerance profile for the investigated analytes with aβ-expectation of 80%. Solid line corresponded to theoretical value, dashed line to the confidence interval, and dotted line to the acceptability (30%)
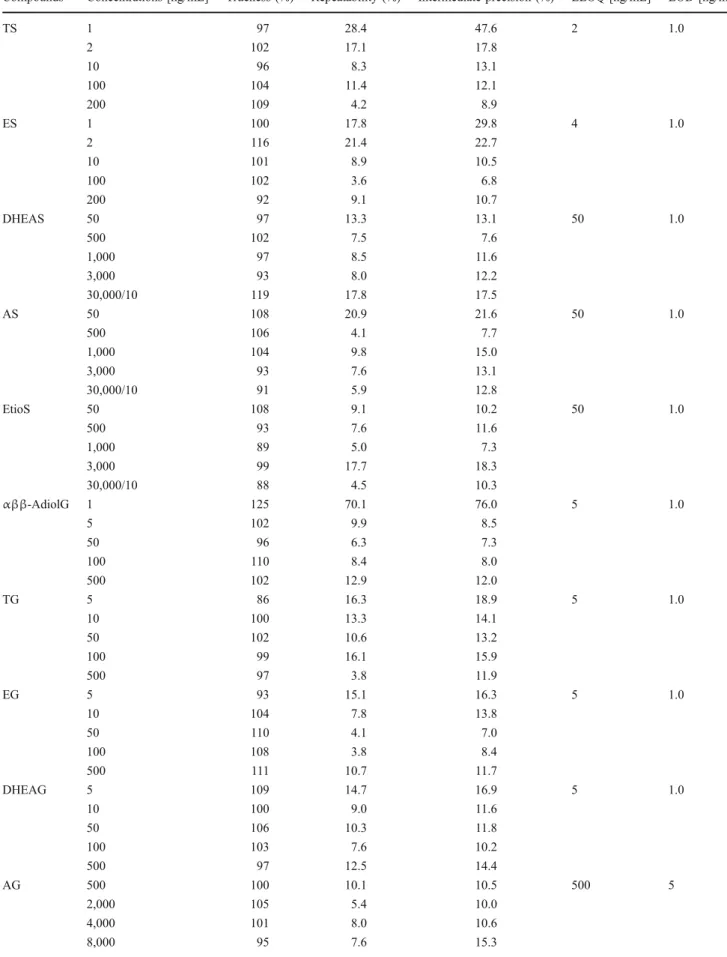
Table 4 Validation parameters for the 11 investigated steroids
Compounds Concentrations [ng/mL] Trueness (%) Repeatability (%) Intermediate precision (%) LLOQ [ng/mL] LOD [ng/mL]
TS 1 97 28.4 47.6 2 1.0 2 102 17.1 17.8 10 96 8.3 13.1 100 104 11.4 12.1 200 109 4.2 8.9 ES 1 100 17.8 29.8 4 1.0 2 116 21.4 22.7 10 101 8.9 10.5 100 102 3.6 6.8 200 92 9.1 10.7 DHEAS 50 97 13.3 13.1 50 1.0 500 102 7.5 7.6 1,000 97 8.5 11.6 3,000 93 8.0 12.2 30,000/10 119 17.8 17.5 AS 50 108 20.9 21.6 50 1.0 500 106 4.1 7.7 1,000 104 9.8 15.0 3,000 93 7.6 13.1 30,000/10 91 5.9 12.8 EtioS 50 108 9.1 10.2 50 1.0 500 93 7.6 11.6 1,000 89 5.0 7.3 3,000 99 17.7 18.3 30,000/10 88 4.5 10.3 αββ-AdiolG 1 125 70.1 76.0 5 1.0 5 102 9.9 8.5 50 96 6.3 7.3 100 110 8.4 8.0 500 102 12.9 12.0 TG 5 86 16.3 18.9 5 1.0 10 100 13.3 14.1 50 102 10.6 13.2 100 99 16.1 15.9 500 97 3.8 11.9 EG 5 93 15.1 16.3 5 1.0 10 104 7.8 13.8 50 110 4.1 7.0 100 108 3.8 8.4 500 111 10.7 11.7 DHEAG 5 109 14.7 16.9 5 1.0 10 100 9.0 11.6 50 106 10.3 11.8 100 103 7.6 10.2 500 97 12.5 14.4 AG 500 100 10.1 10.5 500 5 2,000 105 5.4 10.0 4,000 101 8.0 10.6 8,000 95 7.6 15.3
Carry-over
The carry-over effect at the injection step was determined by analyzing a water blank sample directly after the highest level standard calibration. No peak was found in the subsequent blank samples, except for EtioG and AG, for which only 0.02% and 0.01%, respectively, of the former peak was detected in the first blank sample. In other words, the carry-over effect was found to be negligible for all analytes.
Stability
Stability assays were performed at a concentration of 5 ng/mL for TS and ES; at 10 ng/mL for 5αββ-AdiolG, TG, EG, and DHEAG; at 200 ng/mL for AS, EtioS, and DHEAS; and at 1,000 ng/mL for EtioG and AG. Stability was evaluated on three measurements separated by 48 h in three storage conditions as follows: at +4 °C (autosampler condition), at room temperature (+22 °C), and after three freeze–thaw cycles (freezing at −20 °C and thawing at room temperature). All of these conditions did not affect the stability of the analytes with relative standard deviations (RSD) below 15% (data not shown). However, after maintaining the analytes at +4 °C for 1 month in the matrix, sample degradation was observed with RSD rising to 27% for DHEAG. Analytes loss was estimated to be around 30% of the initial peak area. Consequently, samples shall not be conserved more than 6 days (three times 48 h) before analysis at +22 °C or +4 °C.
Application to clinical study
The 100 samples from a clinical study were analyzed to determine the levels of glucuronidated and sulfated steroids. UHPLC-QTOF-MS results were compared with values obtained by GC-MS for the glucuroconjugates and by LC-MS/MS for the sulfoconjugates, with a method presented
elsewhere [11]. The Bland–Altman approach was used to
further assess the differences between the methods. Quanti-tative measurements obtained by UHPLC-QTOF-MS were in agreement with those performed by GC-MS and LC-MS/
MS, as the statistical Bland–Altman test showed no significant difference with a riskα of 0.05.
All well-known parameters influenced by testosterone administration were modified, in terms of ratio or individual levels, as already described by Baume et al. [40]. For the majority of subjects (n=6), an enhancement of the T/E value, together with TG, AG, and EtioG concentrations, was observed from point +4 h (t02) to point +8 h (t03) after testosterone administration. However, for two subjects among the eight who had taken 80 mg of testosterone, no particular change in concentration or ratio was observed. One athlete was detected to have a deficient genotype in the UGT2B17 gene, causing significantly lower excretion of TG in urine [41], and the other was considered as a fast excretor, with an excretion peak and return to basal state before t02. Overall, the detection window based on glucuronidated steroids was short and not very sensitive, as two individuals out of eight were not detected. The first hypothesis was to observe sulfated metabolites by consid-ering the fact that if a deletion was present on the glucuroconjugation enzyme, sulfoconjugation could com-pensate for steroid elimination. However, the concentra-tion of the inorganic sulfate substrate for the enzyme sulfate transferase could be the limiting factor [42], and further investigation should be performed on sulfoconju-gated metabolism.
As analyses were acquired in the QTOF-MSEmode, rich information was provided by combining exact mass measurements over the mass. This opened the way to a broader steroid profile with chemometric tools for data treatment to highlight minor metabolites or new steroid entities influenced by an oral intake of testosterone.
Conclusion
Direct analysis of steroid metabolism comprising phase II metabolites is still challenging because these compounds are not restricted to professional sport and can be used as biomarkers of diseases related to steroid secretion.
A UHPLC-QTOF-MSE method was validated and
allowed for the quantification of glucuronidated and
Table 4 (continued)
Compounds Concentrations [ng/mL] Trueness (%) Repeatability (%) Intermediate precision (%) LLOQ [ng/mL] LOD [ng/mL]
80,000/10 98 4.1 4.6 EtioG 500 99 17.5 21.2 500 5 2,000 105 4.8 5.4 4,000 100 13.8 13.4 8,000 105 11.9 13.7 80,000/10 95 7.2 10.5
sulfated steroids within the same analysis. Thanks to UHPLC resolution, critical pairs of isomers can be separated. The sample preparation was performed on Oasis HLB SPE cartridges and allowed for a superior sample clean-up and ten-fold pre-concentration of analytes. The chromatographic analysis time required to separate targeted analytes was 36 min (including the re-equilibration time) on a 150-mm column length. An optimal gradient time was mandatory to obtain the needed selectivity between the investigated analytes and the potentially interfering com-pounds present in the matrix. Indeed, as the sample preparation was generic towards the class of conjugated steroids present in the urine, numerous steroid phase II metabolites were extracted with the targeted compounds. However, these compounds can also be used as biomarkers of steroid administration within the framework of a clinical
study. By combining information obtained with QTOF-MSE
acquisition mode and with chemometric tools, additional perspectives on this work could be expected. Furthermore, this method opens a promising route to a broader under-standing of steroid profile (steroidomics), including sulfo-conjugated metabolites, and to the discovery of potentially important indirect biomarkers for the detection of exogenous testosterone misuse, which will be published elsewhere.
References
1. Mareck U, Geyer H, Opfermann G, Thevis M, Schänzer W (2008) J Mass Spectrom 43:877–891
2. Taylor NF (2006) Methods Mol Biol 324:159–175 3. Sjöqvist F, Garle M, Rane A (2008) Lancet 371:1872–1882 4. Van Renterghem P, Van Eenoo P, Delbeke FT (2010) Steroids
75:1047–1057
5. World Anti-doping Agency (WADA) (2010) The world anti-doping code. Endogenous anabolic androgenic steroids, testing and report-ing guidance, technical document TD2010EAAS, Montreal. Avail-able athttp://www.wada-ama.org. Accessed on Dec 2010 6. Ayotte C (2009) Detecting the administration of endogenous
anabolic androgenic steroids. In: Thieme D, Hemmersbach P (ed) Doping in sports: biochemical principles, effects and analysis. Springer, Heidelberg, pp 77–98
7. Van Renterghem P, Van Eenoo P, Geyer H, Schänzer W, Delbeke FT (2011) Steroids 75:154–163
8. Bowers LD (1997) Clin Chem 43:1299–1304
9. Bowers LD, Sanaullah (1996) J Chromatogr B Biomed Sci Appl 87:61–68
10. Antignac J-P, Brosseaud A, Gaudin-Hirret I, André F, Bizec BL (2005) Steroids 70:205–216
11. Strahm E, Kohler I, Rudaz S, Martel S, Carrupt P-A, Veuthey J-L, Saugy M, Saudan C (2008) J Chromatogr A 1196–1197:153–160 12. Bean KA, Henion JD (1997) J Chromatogr B Biomed Sci Appl
690:65–75
13. Buiarelli F, Coccioli F, Merolle M, Neri B, Terracciano A (2004) Anal Chim Acta 526:113–120
14. Pozo OJ, Van Eenoo P, Van Thuyne W, Deventer K, Delbeke FT (2008) J Chromatogr A 1183:108–118
15. Flores-Valverde AM, Hill EM (2008) Anal Chem 80:8771–8779
16. Rijk JCW, Lommen A, Essers ML, Groot MJ, Van Hende JM, Doeswijk TG, Nielen MWF (2009) Anal Chem 81:6879–6888 17. Guillarme D, Ruta J, Rudaz S, Veuthey J-L (2009) Anal Bioanal
Chem 397:1069–1082
18. Hopfgartner G, Bourgogne E (2003) Mass Spectrom Rev 22:195–214 19. Georgakopoulos CG, Vonaparti A, Stamou M, Kiousi P, Lyris E, Angelis YS, Tsoupras G, Wuest B, Nielen MWF, Panderi I, Koupparis M (2007) Rapid Commun Mass Spectrom 21:2439– 2446
20. Fragkaki AG, Tsantili-Kakoulidou A, Angelis YS, Koupparis M, Georgakopoulos C (2009) J Chromatogr A 1216:8404–8420 21. Galesio M, Rial-Otero R, Capelo-Martínez JL (2009) Rapid
Commun Mass Spectrom 23:1783–1791
22. Peters RJB, Rijk JCW, Bovee TFH, Nijrolder AWJM, Lommen A, Nielen MWF (2010) Anal Chim Acta 664:77–88
23. Nielen MWF, Bovee TFH, van Engelen MC, Rutgers P, Hamers ARM, van Rhijn JA, Hoogenboom LAP (2005) Anal Chem 78:424–431 24. Temesi DG, Martin S, Smith R, Jones C, Middleton B (2010)
Rapid Commun Mass Spectrom 24:1730–1736
25. Plumb RS, Johnson KA, Rainville P, Smith BW, Wilson ID, Castro-Perez JM, Nicholson JK (2006) Rapid Commun Mass Spectrom 20:1989–1994
26. Purves RW, Gabryelski W, Li L (1998) Rapid Commun Mass Spectrom 12:695–700
27. Zhang H, Heinig K, Henion J (2000) J Mass Spectrom 35:423–431 28. Zhang N, Fountain ST, Bi H, Rossi DT (2000) Anal Chem
72:800–806
29. World Anti-Doping Agency (WAA) (2010) International standard for laboratories V5.0. Available at http://www.wada-ama.org. Accessed on Dec 2010
30. International Conference on Harmonisation of Technical Requirements for Registration of Pharmaceuticals for Human Use (2005) ICH harmonised tripartite guideline, validation of analytical procedures: text and methodology, Q2 (R1). ICH, Geneva
31. Food and Drug Administration (2001) Guidance for industry: bioanalytical method validation. US Department of Health and Human Services, FDA, Centre for Drug Evaluation and Research, Rockville
32. Viswanathan C, Bansal S, Booth B, DeStefano A, Rose M, Sailstad J, Shah V, Skelly J, Swann P, Weiner R (2007) AAPS J 9: E30–E42
33. European Medicines Agency, Committee for Medicinal Products for Human Use (CHMP) (2008) Concept paper/recommendations on the need for a (CHMP) guideline on the validation of bioanalytical methods, London, 18 Dec
34. Weykamp CW, Penders TJ, Schmidt NA, Borburgh AJ, van de Calseyde JF, Wolthers BJ (1989) Clin Chem 35:2281–2284 35. Matuszewski BK, Constanzer ML, Chavez-Eng CM (2003) Anal
Chem 75:3019–3030
36. Marchi I, Viette V, Badoud F, Fathi M, Saugy M, Rudaz S, Veuthey J-L (2010) J Chromatogr A 1217:4071–4078
37. Rozet E, Ceccato A, Hubert C, Ziemons E, Oprean R, Rudaz S, Boulanger B, Hubert P (2007) J Chromatogr A 1158:111–125 38. Feinberg M, Boulanger B, Dewé W, Hubert P (2004) Anal
Bioanal Chem 380:502–514
39. Baume N, Schumacher Y, Sottas P-E, Bagutti C, Cauderay M, Mangin P, Saugy M (2006) Eur J Appl Physiol 98:329–340 40. Baume N, Saudan C, Desmarchelier A, Strahm E, Sottas P-E,
Bagutti C, Cauderay M, Schumacher YO, Mangin P, Saugy M (2006) Steroids 71:364–370
41. Strahm E, Sottas PE, Schweizer C, Saugy M, Dvorak J, Saudan C (2009) Br J Sports Med 43:1126–1130
42. Weinshilboum R, Otterness D (1994) Sulfotransferase enzymes. In: Kauffmann FC (ed) Conjugation–deconjugation reactions in drug metabolism and toxicity. Springer, Berlin, pp 45–78