HAL Id: hal-02898094
https://hal.archives-ouvertes.fr/hal-02898094
Submitted on 14 Dec 2020HAL is a multi-disciplinary open access
archive for the deposit and dissemination of sci-entific research documents, whether they are pub-lished or not. The documents may come from teaching and research institutions in France or abroad, or from public or private research centers.
L’archive ouverte pluridisciplinaire HAL, est destinée au dépôt et à la diffusion de documents scientifiques de niveau recherche, publiés ou non, émanant des établissements d’enseignement et de recherche français ou étrangers, des laboratoires publics ou privés.
Accurate characterization of Escherichia coli tRNA
modifications with a simple method of deep sequencing
library preparation
Ji Wang, Claire Toffano-Nioche, Florence Lorieux, Daniel Gautheret, Jean
Lehmann
To cite this version:
Ji Wang, Claire Toffano-Nioche, Florence Lorieux, Daniel Gautheret, Jean Lehmann. Accurate char-acterization of Escherichia coli tRNA modifications with a simple method of deep sequencing library preparation. RNA Biology, Taylor & Francis, 2020, pp.1-14. �10.1080/15476286.2020.1790871�. �hal-02898094�
This article has been accepted for publication in RNA BIOLOGY, published by Taylor &
Francis.
See the published version (later version) here:
•
DOI :
10.1080/15476286.2020.1790871
•
PUBMED :
32618488
(the present version is a revised version for RNA biology, therefore before decision of acceptance
by RNA BIOLOGY)
Wang et al. (2020) 1 1
2
Accurate characterization of Escherichia coli tRNA modifications
3
with a simple method of deep sequencing library preparation
4 5 6
Ji Wang, Claire Toffano-Nioche, Florence Lorieux, Daniel Gautheret1, Jean Lehmann1
7
Institute for Integrative Biology of the Cell (I2BC), CEA, CNRS, Université Paris-Sud,
8
Campus Paris-Saclay, 91198 Gif-sur-Yvette, France
9 10 1 corresponding author 11 daniel.gautheret@u-psud.fr; jean.lehmann@u-psud.fr 12 13 ABSTRACT 14 15
In conventional RNA high-throughput sequencing, modified bases prevent a large fraction of tRNA transcripts to
16
be converted into cDNA libraries. Recent proposals aiming at resolving this issue take advantage of the
17
interference of base modifications with RT enzymes to detect and identify them by establishing signals from
18
aborted cDNA transcripts. Because some modifications, such as methyl groups, do almost not allow RT bypassing,
19
demethylation and highly processive RT enzymes have been used to overcome these obstacles. Working with
20
Escherichia coli as a model system, we show that with a conventional (albeit still engineered) RT enzyme and key
21
optimizations in library preparation, all RT-impairing modifications can be highlighted along the entire tRNA length
22
without demethylation procedure. This is achieved by combining deep-sequencing samples, which allows to
23
establish aborted transcription signal of higher accuracy and reproducibility, with the potential for differentiating
24
tiny differences in the state of modification of all cellular tRNAs. In addition, our protocol provides estimates of
25
the relative tRNA abundance.
26 27 28
INTRODUCTION
29
During the past few years, several new experimental strategies have been developed to help characterize cellular 30
tRNAs from either cells or tissues, both in terms of modification state and relative frequency (Cozen et al. 2015; Zheng 31
et al. 2015; Hauenschild et al. 2015; Gogakos et al. 2017; Shigematsu et al. 2017; Schwartz et al. 2018). These 32
investigations came at the time of the realization that, although tRNA modifications are primarily ensuring an 33
accurate and efficient deciphering of mRNAs during translation (reviewed in Krutyhołowa et al. 2019), a multitude of 34
other biological processes are directly or indirectly impacted by them (Novoa et al. 2012, Chan et al. 2018, Baldridge 35
Wang et al. (2020) 2 et al. 2018). Furthermore, a large variety of diseases originate from an absence of tRNA modifications (Bohnsack and 36
Sloan 2017; Jonkhout et al. 2018, de Crécy-Lagard et al. 2019), while the modification state of tRNAs has also been 37
shown to relate to metabolism (Alexandrov et al., Richter et al. 2018; Ng et al. 2018; Pollo-Oliveira and de Crécy-38
Lagard 2018). It is, therefore, highly desirable to develop straightforward methods for the characterization of all 39
tRNAs. The presence of modifications on tRNA constitutes a burden in traditional deep-sequencing experiments 40
because they prevent RT enzymes from generating full cDNA transcripts by blocking their progression along the RNA 41
strand. Earlier protocols of cDNA library preparation relied on RNA adapters ligated to both ends of the RNAs for PCR 42
amplification, implying that aborted cDNA transcripts could not be amplified. RT enzymes may still bypass 43
modifications at a rate depending on the nature and position of the chemical groups attached to nucleosides, which 44
would often lead to nucleotide misincorporation. This information has already been used to identify modified 45
residues in RNA-seq databases established from these earlier protocols (Ryvkin et al. 2013, Vandivier et al. 2019). 46
Since then, procedures to amplify aborted cDNA transcripts have been developed, which have allowed to establishing 47
signals at the location of RT-impending modifications, and thus acquiring quantitative information about the state of 48
modification (Hauenschild et al. 2015, Zheng et al. 2015, Clark et al. 2016). Currents methods are reviewed in Helm 49
and Motorin (2017) and Motorin and Helm (2019). Some modifications, such as methyl groups, do almost not allow 50
any RT bypass when they are situated on the Watson-Crick face of bases. In order to overcome this issue, Cozen et 51
al. (2015) and Zheng et al. (2015) combined demethylase treatments with an exceptionally processive RT enzyme to 52
generate full-lengh cDNA transcripts at higher yields. Alternate procedures were developed by Motorin, Helm and 53
coworkers, who established aborted transcription signals from fragmented RNA (Hauenschild et al. 2015). Although 54
it is still used in many RNA deep-sequencing protocols (Hauenschild et al. 2015; Gogakos et al. 2017), RNA 55
fragmentation generates a high level of noise in the analysis due to ambiguous gene mapping. This procedure was, 56
therefore, avoided in the present study. 57
Searching for a method that could highlight RT-impairing base modifications with minimal benchwork, we identified 58
a robust procedure that allows to generate signals from aborted cDNA transcripts without requiring demethylase 59
treatment and/or RNA fragmentation, and that we validated with a regular RT enzyme (Superscript III, Invitrogen). 60
Working with 3 biological replicates from Escherichia coli, a bacterial species the tRNA modifications of which are 61
well characterized, we first show that conventional treatments of total RNA samples (DNAse, DNAse and deacylation) 62
have no significant effect on these signals (we call them ts, termination signals). The number of QC-passed reads 63
obtained from single samples (10-15 million) is, however, too low to fully characterize all tRNAs. Next, we show that 64
a significant gain in accuracy of ts signals is obtained by combining independently sequenced samples. Because deep-65
sequencing experiments require PCR amplification, tiny variations in the amount of initial sample translate into 66
noticeable differences in relative fractions of amplified cDNA transcripts, implying that ts signals fluctuate around 67
characteristic values. Our data show that these fluctuations reach amplitudes as high as 90%. Pooling reads from 3 68
experiments allows us to demonstrate a reduction in ts standard deviation by a factor > 2. Furthermore, by combining 69
all samples from 9 independent deep-sequencing experiments, totalizing about 60 million mapped reads, we show 70
Wang et al. (2020) 3 that the coverage is high enough to fully characterize 43 out of the 48 different E. coli tRNAs, 5 weakly expressed 71
tRNAs being incompletely covered with ts signals. E. coli being an extensively studied bacteria, almost all ts signals 72
can be attributed to modifications listed in the Modomics database (Boccaletto et al. 2018). An innovative aspect of 73
our protocol based on the conserved CCA 3’ terminal of all tRNAs was found essential to obtaining highly consistent 74
data. Because the ultimate A76 residue, that is required for aminoacylation, can be specifically removed by RNase T 75
in E. coli (Deutscher et al. 1984, 1985), a subpopulation of non-functional tRNAs may always occur in these cells 76
(Czech 2020 and our unpublished data). Conversely, an additional CCA may be added by the CCA-adding enzyme that 77
tags these tRNAs for degradation through the combined action of poly(A) polymerase and RNase R (Li et al. 2002, 78
Mohanty et al. 2012, Wellner et al. 2018). We found that the use of primers with TGG 3’ overhang in the first PCR 79
step essentially only amplifies CCA 3’-ending RNA transcripts and drastically reduces background amplification. This 80
enables our protocol to generate signals of unprecedented cleanliness, although it is restricted to almost only tRNAs. 81
The universality of the tRNA CCA 3’ end makes it, however, applicable to any organism of interest. Because all 82
transcribed cDNAs start at the 3’ end of the tRNAs, a relative quantification of mature isoacceptors can be established 83
from the read coverage at that position. 84
85 86
MATERIAL & METHODS
87
Preparation of samples
88
To test the proposed method, three biological replicates (R1, R2 and R3) of total RNA from E. coli MG1655 cells grown 89
at 37°C in standard LB medium were sampled at an OD600 of ~4.0. Total RNA was extracted with trizol/chloroform.
90
Glycogen was added and the solution was precipitated with ethanol. Each of these samples were prepared following 91
three different procedures (Fig. 1): Total RNA was either not treated (a), or treated with DNase (b), or treated with 92
DNase and deacylated (c) prior to 3' adapter ligation (Table 1). DNAse treatment (with TurboDNase, Ambion) was 93
performed 4 hours at 37°C, followed by overnight incubation at 4°C. Adapter ligation (10°C overnight) was achieved 94
with a pre-adenylated RNA 3’ adapter using a truncated T4 RNA ligase 2 (NEB). Reverse transcription was performed 95
with Superscript III (Invitrogen), 1h at 55°C. Chimeric RNA/cDNA products were directly loaded on gel for size 96
selection between 35 to 200 bp by electrophoresis to eliminate the excess of 3’ adapters and select mid-size RNA 97
transcripts. Gel-extracted products were subjected to poly-A tailing by a TdT enzyme (NEB) 45 min at 37°C. A first 98
round of selective pre-amplification of the cDNA (10-18 cycles) was achieved using a Taq polymerase (Invitrogen) 99
with Illumina TruSeq sRNA RTP with TGG overhang and Illumina TruSeq sRNA 5’ adapter primer with polyT(20). A 100
second amplification (5-15 cycles) with Illumina RP1 and Illumina TruSeq sRNA Index primer (RPIX) that added a 101
specific tag to each of the 9 samples provided the final libraries. Illumina deep sequencing (libraries multiplexing; 102
pair-end: 2x125bp PE, HiSeq High Output mode, V4 chemistry) was performed by an external contractor (Genewiz). 103
The detailed protocol of library preparation is available in supplemental File S1. 104
…AAAAA N(5)TT…TTT(20)
N(5)A…AAA N(5)T…TTT
Illumina TruSeq sRNA 3’ adapter (RA3)
Illumina TruSeq sRNA RT primer (RTP) Illumina TruSeq sRNA PCR primer (RP1) Illumina TruSeq sRNA Index primer (RPIX) Illumina TruSeq sRNA RTP with GGT overhang
Insert 3’ Adapter ligation
Reverse transcription
1stround selective PCR
PCR with NGS primers
Final library for deep sequencing
5’ 3’
5’ 3’
5’ 3’
cDNA PolyA tailing
…AAAAA…AAAAAAAA …AAAAAAAAAAAA…AAAAAAAA
5’ 3’
Modified bases cDNA Size selection Ladder Ladder 35 bp50 bp 200 bp 35 bp 50 bp 200 bp 300 bp 300 bp 5’ 3’
Total RNA sample
5’ 3’
GGT
No treatment (a) or DNase treatment (b) or DNase treatment and deacylation (c)
N(5)TT…TTT GGT CCA GGT CCA 3’
Illumina TruSeq sRNA 5’ adapter primer with polyT N(5)T…TT(20)
5’
Figure 1. Workflow of library preparation. See text for explanations and Supplemental File S1 for detailed protocol. Note that the stretch of 5 random positions (N5) preceding the poly(T) tail of the 5’ adapter primer is a requirement of Illumina deep-sequencing spot localization.
Wang et al. (2020) 4
Computational treatment of deep-sequencing data
106
Processing of the deep-sequencing data required an optimization in order to extract the most relevant signal from 107
read coverage. We established a protocol (Fig. 2 and suppl. Fig. S1) that generated the sharpest termination signals 108
(see below). In brief, only reads R2 in pair-end sequencing (i.e. sequenced from the 3’ end) were processed. Both 109
adapters were removed and poly-T tails corresponding to TdT-added poly A on cDNA were trimmed. Mapping on E. 110
coli K-12 (substr. MG1655) genome was achieved with Bowtie 2 (Langmead and Salzberg 2012) with the --local
111
option, that maximizes the stretch of correct matches at the end of a read. This option turned out to be essential 112
because bases other than A sometimes occur in the added poly-A that prevent its complete removal at the trimming 113
step. Finally, a CCA/TGG filter complementing the selective PCR step only kept mapped transcripts with CCA at the 114
3’ end. The quality and distribution of read lengths at each step, performed with FastQC (v0.11.5, Babraham 115
Bioinformatics), are shown in supplemental Figure S1. After filtering, about 5 million to 9 million reads mapped onto
116
the E. coli genome (Table 2; suppl. Fig. S1), allowing to establishing tRNA genomic coverages. 117
118
Visualization
119
To connect ts signals with modified bases, all E. coli tRNA sequences from the Modomics database (Boccaletto et al. 120
2018) were aligned onto the E. coli genome with blastn (ncbi-blast-2.5.0+), where a .gff file specifying the position of 121
661 modifications (suppl. File S2) allowed their visualization on IGV (Robinson et al. 2017). A separate .txt file (suppl. 122
File S3) was used to generate plots connecting ts signals with tRNA sequences and modifications (Fig. 3b). 123
Modifications one-letter-code are from the Modomics database (supplemental Table S1). 124
125 126
RESULTS
127
Analytical treatment of tRNA transcripts coverages
128
Examination of tRNA coverages (Fig. 3a) revealed that they were highly specific and reproducible. The coverages 129
decrease from the terminal CCA3’, with sudden jumps at locations of RT-impairing base modifications. Following
130
analytical procedures introduced by Helm, Motorin and coworkers (Hauenschild et al. 2015) and Pan and coworkers 131
(Zhang et al. 2015; Clark et al. 2016) these jumps were converted into termination signals (ts) highlighting the loss of 132
coverage (in %) from nucleotide i+1 to nucleotide i (Fig. 3b). A ts signal is defined only when coverage (i) ³ 100 reads 133
to ensure a minimal precision of the order of 1%. Furthermore, when negative values occur (reflecting very rare 134
instances of amplified internal fragments), ts is set to zero. Figure 3a illustrates the analysis with the R1b sample of 135
lysQ, the coverage of which corresponds to the average expression of 6 identical genes (lysQ, lysT, lysV, lysW, lysY,
136
lysZ). The average ts signal established from the R1b, R2b and R3b samples (Fig. 3b) allows to highlight three major
137
termination events associated with base modifications (see below for the analysis). Although the amplitude of these 138
signals fluctuates among samples, they all correlate well (Fig. 3c and Table 3): Pearson correlation coefficients (r) are 139
all above 0.92, with 22/36 coefficients higher than 0.98 (all associated p values are zero). Two significant observations 140
can be made from Table 3. First, the amplitude of ts signals does not depend on RNA treatment: the two samples 141
fastq data bioinformatic procedure software bam sam wig R2 fastq 9736417 trimmed reads 11796813 QC-passed number of reads of R1a sample 7209763 mapped reads legend chr, CCA/TGG : 6494515 remaining reads, among which 6299382 tRNA reads trimming cutadapt --adapter=AAAAAAAAAAAAAAA --minimum-length=10 mapping Bowtie2 --phred 33 --local selection samtools view NC_000913.3 CCA/TGG awk filter
visualization & count
samtools depth
-d 1000000 -a software option
1 2 3 4 5
Figure 2. Computational workflow of deep-sequencing Illumina data processing (See Supplemental Figure S1 for details). Shown values are from the R1a sample (all samples provided similar results). Among half a dozen tested strategies, the established workflow provided the sharpest termination signals. From the initial QC-passed reads (1), trimmed reads (2) were obtained with cutadapt by identifying and trimming all TdT-added poly-A (i.e. poly-Ts on the tRNA gene sequence) with at least 15 nt. In a second step, a local mapping of the reads onto the E. coli genome with bowtie2 (Langmead and Salzberg 2012) was achieved, providing the mapped reads (3). The –local option maximizes the stretch of matching bases by removing mismatches at the end of the reads (softclipping). In a third step, mapped reads were filtered with a custom awk script to select only the reads ending with CCA/TGG (depending to the orientation of the tRNA on the genomic sequence), thus complementing the selection of mature tRNA achieved during library preparation. This operation provided the final mapping (4), from which a wig file (5) compiling the coverage of all expressed RNA genes was established with samtools depth using the –d 1000000 and –a options.
Biological replicate
Treatment R1 R2 R3
a. no treatment R1a R2a R3a
b. DNase R1b R2b R3b
c. DNase + deacylation R1c R2c R3c
Table 1: The 9 total RNA samples analysed in this study.
Sample Total reads mapped and
CCA/TGG filtered tRNA pseudo tRNA tmRNA
R1a 6,494,515 6,299,382 (97,0%) 45,775 ( ~1%) 1,191 (~ 0.01%) R2a 5,150,196 5,026,263 (97,6%) 44,260 ( ~1%) 704 (~ 0.01%) R3a 6,941,871 6,793,490 (97,9%) 67,948 ( ~1%) 426 (~ 0.01%) R1b 7,229,758 7,056,586 (97,6%) 91,245 ( ~1%) 851 (~ 0.01%) R2b 6,803,833 6,669,159 (98,0%) 45,793 ( ~1%) 2,336 (~ 0.01%) R3b 7,551,225 7,385,017 (97,8%) 103,008 ( ~1%) 749 (~ 0.01%) R1c 9,045,057 8,899,275 (98,4%) 54,894 ( ~1%) 1,074 (~ 0.01%) R2c 7,457,325 7,301,761 (97,9%) 54,527 ( ~1%) 3,378 (~ 0.01%) R3c 6,771,946 6,598,669 (97,4%) 82,914 ( ~1%) 1,515 (~ 0.01%)
Table 2: Total read numbers of samples. Reads of tRNA are from the following genes (identical copies are indicated in
brackets): (alaT, alaU, alaV), (alaX, alaW), (argQ, argV, argY, argZ), (argU), (argW), (argX), (asnT, asnU, asnV, asnW), (aspT,
aspU, aspV), (cysT), (glnU, glnW), (glnV, glnX), (gltT, gltU, gltV, gltW), (glyT), (glyU), (glyV, glyW, glyX, glyY), (hisR), (ileT, ileU, ileV), (ileX), (ileY), (leuP), (leuQ, leuT, leuV), (leuU), (leuW), (leuX), (leuZ), (lysQ, lysT, lysV, lysW, lysY, lysZ), (metT, metU), (metV, metW, metZ), (metY), (pheU, pheV), (proK), (proL), (proM), (selC), (serT), (serU), (serV), (serW, serX), (thrT), (thrU), (thrV), (thrW), (trpT), (tyrT, tyrV), (tyrU), (valT, valU, valX, valY, valZ), (valV), (valW). Reads of pseudo tRNA are from
the following genes: (pauD), (pawZ), (ptwF). Reads of tmRNA are from the following gene: (ssrA).
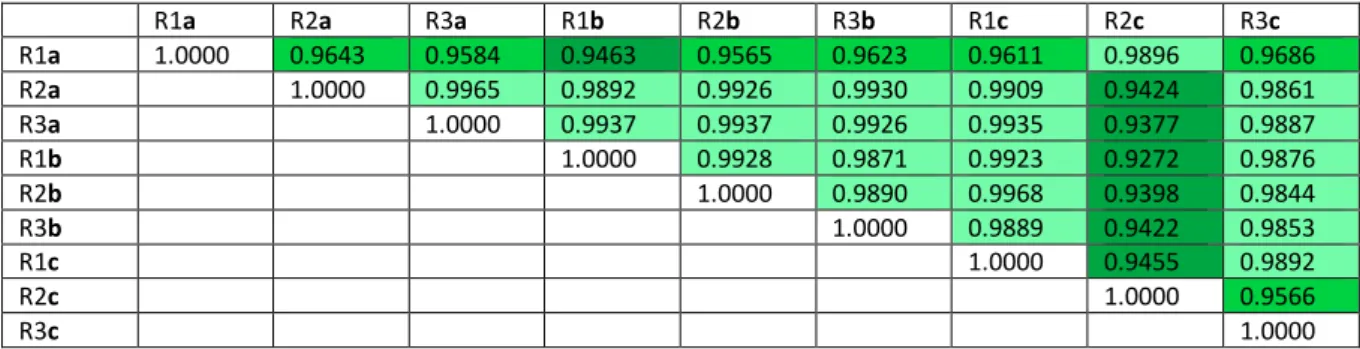
R1a R2a R3a R1b R2b R3b R1c R2c R3c
R1a 1.0000 0.9643 0.9584 0.9463 0.9565 0.9623 0.9611 0.9896 0.9686 R2a 1.0000 0.9965 0.9892 0.9926 0.9930 0.9909 0.9424 0.9861 R3a 1.0000 0.9937 0.9937 0.9926 0.9935 0.9377 0.9887 R1b 1.0000 0.9928 0.9871 0.9923 0.9272 0.9876 R2b 1.0000 0.9890 0.9968 0.9398 0.9844 R3b 1.0000 0.9889 0.9422 0.9853 R1c 1.0000 0.9455 0.9892 R2c 1.0000 0.9566 R3c 1.0000
Table 3: Pearson correlation coefficients (r) between samples ts values. Correlation coefficients established from ts signals
of tRNA, tmRNA and pseudo tRNA only when these signals are defined in all 9 samples (N = 3146 per sample); see Table 2 for the list of genes. Identical transcript copies (e.g. metT, metU) are included only once in the analysis. Dark green: 0.92 ≤ r < 0.95 ; medium green: 0.95 ≤ r < 0.98 ; light green: r ≥ 0.98. All associated p-values are 0.
ts threshold A. 1 sample (a, b or c) B. Avg., 2 samples (all comb.) C. Avg., 3 samples (a, b, c) ratio A/C
tsR1+R2+R3 > 0 0.719 (N = 66781) 0.456 (N = 68775) 0.324 (N = 2538) 2.22
tsR1+R2+R3 > 1 1.952 (N = 23239) 1.278 (N = 23070) 0.920 (N = 839) 2.12
tsR1+R2+R3 > 10 5.230 (N = 6977) 3.467 (N = 6863) 2.520 (N = 249) 2.08
tsR1+R2+R3 > 20 6.249 (N = 5204) 4.177 (N = 5172) 3.033 (N = 188) 2.06
Table 4: Comparison between biological replicates R1, R2 and R3: average ts standard deviation (%) as a function of the
number of samples (a, b and/or c), established for four ts threshold. TsR1+R2+R3 > x implies that a particular standard deviation
is computed only if the sum of ts signals of the three replicates at a given position is > x. About 2,500 ts values are simultaneously determined in all three replicates for a considered set of samples (the total number of nucleotide positions, including all tRNAs and three tRNA pseudogenes, is 3,916). Standard deviations are established for all possible combinations of samples. With one sample (A), there are 33 = 27 combinations. With two samples (B), there are also 33 = 27 combinations
metT (metU) G T C T G T A T G T A A C C T A T A A T A G G T A A G T G A C C T G A C A C G C A G A C C G T G T G G A A C C C T A G T G G C C G T C A T C G C T G C C A 4 DD# DD M 6 P 7X TP 0 20 40 60 80 100 − −− − −−−−−−−−−−−−−−− − −−−−−−− − − − − −−−−−−−−−−−−−−−−−−−−−−−−−−−−− − − −− − −−−−−−−−−−−−−−− − −−−−−− −− − − − −−−−−−−−−−−−−−−−−−−−−−−−−−−−− − −−−−−−−−−−−−−−−−−− − −−−−−− −− − − − −−−−−−−−−−−−−−−−−−−−−−−−−−−−−
metV (metW metZ)
G G G T G G A C T G A C C T G G T A A C C A G T G C G T A A C G C C C C A C C C G G G A C G C G T G T G C G C C T A C G A G C T G T C A T C G C C G A C A 4 D B 7 TP 0 20 40 60 80 100 −−−−−−−−−−−−−−−−−−−−−−−−−−−−−−−−−−−−−−−−−−−−−−−−−−−−−−−−−−−−−−−−−−−−−−−−−−−−− −−−−−−−−−−−−−−−−−−−−−−−−−−−−−−−−−−−−−−−−−−−−−−−−−−−−−−−−−−−−−−−−−−−−−−−−−−−−− −−−−−−−−−−−−−−−−−−−−−−−−−−−−−−−−−−−−−−−−−−−−−−−−−−−−−−−−−−−−−−−−−−−−−−−−−−−−− metY G G G T G G A C T G A C C T G G T A A C C A G T G C G T A A C G C C C C A C C C G G G A C G C G T G T G C G C C T A C G A A C T G T C A T C G C C G A C A 4 D B TP 0 20 40 60 80 100 −−−−−−−−−−−−−−−−−−−−−−−−−−−−−−−−−−−−−−−−−−−−−−−−−−−−−−−−−−−−−−−−−−−−−−−−−−−−− −−−−−−−−−−−−−−−−−−−−−−−−−−−−−−−−−−−−−−−−−−−−−−−−−−−−−−−−−−−−−−−−−−−−−−−−−−−−− −−−−−−−−−−−−−−−−−−−−−−−−−−−−−−−−−−−−−−−−−−−−−−−−−−−−−−−−−−−−−−−−−−−−−−−−−−−−− 5’ 3’ AD BD CD Avg. R1b.bam coverage R1b.bam Te rm in a ti o n si g n a l ts (% ) Sequence → Base modification → (Modomics database, Nov. 2017)
N=76,336 N=23,522 N=20,926 N=4,778 N=3,321 N=265 a b !" # =%&'()*+( # + 1 − %&'()*+( # %&'()*+( # + 1 / 100 # runs from 5’ to 3’ of the transcripts. !" # is defined only if coverage # ≥ 100 when !" # < 0, !" # is set to 0 c R1b R2c 0 20 40 60 80 100 0 20 40 60 80 100 Te rm in a ti o n si g n a l ts (% ) Termination signal ts (%) r = 0.927 0 20 40 60 80 100 0 20 40 60 80 100 R2b R1c Te rm in a ti o n si g n a l ts (% ) Termination signal ts (%) r = 0.997 d 0,9 0,92 0,94 0,96 0,98 1 0 1000000 2000000 3000000 4000000 1.00 0.98 0.96 0.94 0.92 0.90 0 1x10⁶ 2x10⁶ 3x10⁶ 4x10⁶
Difference in total read number
Pe a rs o n r
lysQ (lysT lysV lysW lysY lysZ)
GGGUCGUUAGCUCAGUUGGUAGAGCAGUUGACUUUUAAUCAAUUGGUCGCAGGUUCGAAUCCUGCACGACCCACCA D 6 P X P D D S 7 T 0 20 40 60 80 100 −−−−−−−−−−−− −− − − − −−−−−−−−−−−−−−−− − − − −−−−−−−−−− − −−−−−−−−−−−−−−−−−−−−−−−−−−−−− − −−−−−−−−−−− − − − − − −−−−−−−−−−−−−−−−−− − −−−−−−−−− − − −−−−−−−−−−−−−−−−−−−−−−−−−−−−− −−−−−−−−−−− −−−− − − −−−−−−−−−−−−−−−−−− − −−−−−−−−− − − −−−−−−−−−−−−−−−−−−−−−−−−−−−−−
lysQ (lysT lysV lysW lysY lysZ)
GGGTCGTTAGCTCAGTTGGTAGAGCAGTTGACTTTTAATCAATTGGTCGCAGGTTCGAATCCTGCACGACCCACCA D 6 P X P D D S 7 T 0 20 40 60 80 100 − −−−−−−−−−−− −−− − − − −− −−−−−−−−−− −−−−− − − −−−−−−−−− − − − − −−−−−−−−−−−−−−−−−−−−−−−−−− −− −−−−−−−−−− − − − − − − − − − − −−−−−−−−−−−− − − − −−−−−−−− − − − − − −−−−−−−−−−−−−−−−−−−−−−−−−− − − − − − − − − − − − −−−− − − − −−−−−−−−−−−−−−−−− − − −−−−−−−− − − − − −−−−−−−−−−−−−−−−−−−−−−−−−−− R1b R2b R3b avg.
Figure 3. Overview of the analysis of deep-sequenced CCA3’-amplified RNA transcripts. a) Snapshot of an IGV window (Thorvaldsdóttir et al. 2013) centered on the lysQ tRNA gene of E. coli MG1655 genome, showing the coverage established from the R1b sample. This gene is oriented 5’-3’ from left to right. Interruption of reverse transcription events (from 3’ to 5’) generate coverage jumps. b) Termination signals (ts, defined in the box) of lysQ tRNA, established from the coverage of R1b, R2b and R3b samples. Because the lysQ sequence is identical to that of lysT, lysV, lysW, lysY and lysZ, reads are evenly distributed among these 6 genes. Base modifications symbols indicated below the sequence are from the Modomics database (Boccaletto et al. 2018) (Supplemental Table S1). c) Ts-ts Plots illustrating the lowest (left) and the highest (right) obtained Pearson correlation coefficients (r) between samples (see Table 3); n = 3146 in both plots. d) Pearson correlation coefficients as a function of the difference in total tRNA read number between samples.
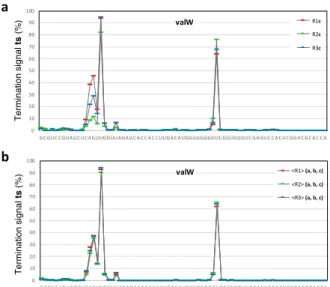
0 10 20 30 40 50 60 70 80 90 100
GCGUC CGUAGCUC AGUUGGUUAGAGC A C C A C CUUGA C AUGGUGGGGGUCGGUGGUUCGAGUC C A CUCGGA CGC A C C A
valW A avg (-, D, Dd) B avg (-,D, Dd) C avg (-, D, Dd) Te rm in a ti o n si g n a l ts (% ) 0 10 20 30 40 50 60 70 80 90 100
GCGUC CGUAGCUC AGUUGGUUAGAGC A C C A C CUUGA C AUGGUGGGGGUCGGUGGUUCGAGUC C A CUCGGA CGC A C C A
valW ADd BDd CDd Te rm in a ti o n si g n a l ts (% ) R1c R2c R3c <R1> (a, b, c) <R2> (a, b, c) <R3> (a, b, c) a b
Figure 4. Gain in precision obtained in the ts analysis when ts signals from 3 samples are averaged, as compared to signals obtained from single samples (illustration with valW tRNA). a) Comparison of ts values between three biological replicates (R1, R2 and R3) with a single sample (c treatment). b) Same comparison as in a, but with ts values of each biological replicate averaged over three samples (a, b and c). Because RNA sample treatment (a, b, c) were found not to noticeably alter ts signals (see Table 3 and text), they are considered as equivalent. For a global quantitative analysis, see Table 4.
Wang et al. (2020) 5 related by the lowest r (0.927) are R1b and R2c (Fig. 3c, left), while the highest r (0.997) is observed between the R2b 142
and R1c samples (Fig. 3c, right). It suggests that the difference in ts signal in between samples is essentially related 143
to PCR amplification. Remarkably, these signals are not affected by the total read number of a sample (Fig. 3d), which 144
constitutes an unexpected robustness of the method. It can thus be concluded that b and c treatments do not have 145
noticeable effects on the ts analysis, and, within the range of values obtained in the present study (Table 2), ts signals 146
are not affected by the total number of reads provided by a deep sequencing experiment. Because these signals 147
display fluctuations that can be higher than 90%, single deep-sequencing experiments cannot accurately determine 148
their characteristic values (Fig. 4a), a quantitative aspect that has not been addressed in earlier analyses based on 149
aborted cDNA signals (e.g. Hauenschild et al. 2015, Zhang et al. 2015). Since ts signals were found not to be affected 150
by total RNA treatments, we established the average ts standard deviation by combining a, b and c samples in each 151
replicate R1, R2 and R3, and found an increase in the accuracy by a factor > 2 when three samples were combined 152
(Fig. 4b; Table 4), the average standard deviation dropping from 6 to 3 % for ts signals equal or higher than ~7 % (i.e. 153
tsR1+R2+R3 > 20). The decrease of the average standard deviation with the number of samples being approximately 154
logarithmic, our data suggest that 7 to 8 independent sequencings provide signals ~10 times more accurate than 155
single ones (supplemental Fig. S2). Furthermore, when samples are separately analyzed, from 11 to 23 tRNAs 156
sequences lack full 5’ ts characterization due to low coverage at the 5’ end. By combining the coverages of the 9 157
independently sequenced samples of the present study (Table 2), only about 3% of the combined tRNA sequence 158
length could not be characterized (magenta lines in Figure 5; see supplemental File S4). Combining independent 159
samples has, therefore, a double benefit: it significantly increases the precision in the value of ts signals, required to 160
assess the level of modification of residues, and allows to establishing a complete (or near complete) ts analysis of 161
all tRNA sequences. 162
163
Termination signal analysis of E. coli tRNA transcripts
164
The ts analysis generates signals similar to the arrest rate (Hauenschild et al. 2015) and modification index (Zhang et 165
al. 2015; Clark et al. 2016). It provides a set of characteristic signals reflecting the modification state of a tRNA. Some 166
modifications, such as P and T, can only be revealed by chemical treatments that make them interfering with RT 167
enzymes (Motorin et al. 2007, Zhang et al. 2019). These were not investigated in the present study. To facilitate a 168
rapid assessment of all tRNAs, four types of modifications are highlighted in Figure 5 (see supplemental Table S1 for 169
one letter code). Green dots indicate the T and P modifications of the T-loop, for which no interference with the RT 170
enzyme is noticeable. Blue dots highlight the D modification, with which strong ts signals are observed when three 171
or more of such residues are present (see below). Orange dots signal modifications for which strong ts signals are 172
observed only when two or more of such modifications are in close vicinity (V, %, {, 6, Q, c, *, $, S, B, M and +) while 173
red dots highlight modifications that are always interfering strongly with the RT enzyme (X, K, *, }, ) and E). 174
Modifications that do essentially not affect the path of the RT enzyme (such as 4 and #) are left unhighlighted. 175
Modification interfering weakly with Superscript III except if other modification(s) occur(s) nearby GGGGCUAUGACUCAGCUGGGAGGACGCCUGCUUUGCCAGCAGGAGGUCUGGCGUUCGAUCCCGCAUGACUCCACCA D V 7 TP GGGGCUAUGACUCAGCUGGGAGGACGCUUGCAUGGCUAGCAAGAGGUCAGGCGUUCGAUCCCGCUUGACUCCACCA D 7 TP GUAUGGACUGACCCUGUGGCAGGUGAGUGACUUUACAC CGGUGCCGCGUGGAUCUCGAGAGGCGGUCAUCCACCGCA K P D 7 T GCCUGGACUGACCCGCUGGGCGGUGAGUAACUUGGCAC CGAGACCGCGUGGACUAGGUUGGGCGGUCAUCCCUCGCA GCAUGGACUGACCAUGUGGCAUGUGAGUGACUUUGCAC CGGGACCGUGUGGACGUUGACGGGCGGUCAUCCCCCGCA GGAAGUACGUCGUCUCCGGGUAGGCGGCUGGACUCUAAAUCCAGUUGGGGCCGCCAGCGGUCCGCGGCAGGUUCGACCUCUGUGAUCUUCCGCCA P 4 D + T GGAAGUGUGGCCGAGCGGUUGAAGGCACCGGUUCUGAAAACCGGCGACCCGAAAGGGUUCCGAAGUUCGAAUCUCGUCGCUUCCGCCA #D BV P 4 D * T GGAGGAAUGCCGGAGCGGCGUAACGGACCGGUCUGCAAAACCGGAGUAGGGGCAACUCUACCGGGGGUUCAAAUCCCCUCCUCUCCGCCA #D * TP GGUGGAGUGGCCGAGAGGCGUAAGGCGCUCCCCGUCUAAGGGAGUAUGGCGUCAAAAGCUGCAUCCGGGGUUCGAAUCCCCGCCUCACCGCCA % T 4 D 6 P GGGUAGGUGUCCGAGUGGUCGAAGGAGCACGCUCGGAAAGUGUGUAUCAGGCAACGUAUCGGGGGUUCGAAUCCCCCCCUCACCGCCA # P P 4 D T GGCGCGUUAACAAAGCGGUUUAGUAGCGGAUUGCAAAUCCGUCUAGUCGCGUUCGACUCCGGAACGCGCCUCCA D P P 4 D *P T GGUUGCACGAGCCGUUUAACGAUCUGUGACAGACCGC UGGACCAGGUAGACGUUGUCGCUCCGUCAUCGUCCACA 4 #D J$/P TP GGUUGCACGAGCCGAUUAUCGAUCAGUGACUGACCGC UGGACCAGGUAGACGUCGUCGCUCGGUCAUCCUCCACA 4 #D J /PP TP GUCCCCUUGCUCUAGAGGCCCGAGACACCGCCCUUUCCAGGCGGUAACAGGGGUUCGAAUCCCCUGAGGGACGCCA P S P 4 / T CGCUGAAUGUUACCGCUCACGUAGGGUGUCCCGCGUC GGGACUUAGCAUCUACUCAGUAGUCGUCAUCGUCCCCA { TP GCGGGGCUAGUUCAAUGGUGAAACGAGAGCUUCCCAAGCUCUAUACGAGGGUUCGAUUCCCUUGCCCCGCUCCA D P 4 T GCGGGAAUGACUCAGUUGGUAGGACACGACCUUGCCAAGGUCGGGGUCGCGGAUUCGAGUCUCGUUUCCCGCUCCA D P 4 D D 7 T GCUUGUAGGUAACCCCUAAGGGGUGUGUAGCAUAGCAC AGUGACCGUGUGGGACCGUAGUAGCGGUCAUCCCGCUCA D 6 X P P DD 7 T GGCCCCUUAGCUCAGGUGUUAGAGCAGGGCACUCAUAAUCGCUGUGUCGCUGGUUCAAGUCCAGCAGGGGCCCACA #D 6P X P 4 D } 7 T GGCCCUUUAGCUCAGGUGUUAGAGCAGGGCACUCAUAAUCGCUGUGUCGCUGGUUCAAGUCCAGCAAGGGCCCACA #D 6P X P 4 D } 7 T CAGUGGAUGUGCCCACUAGGUGGUUAGAGGGGUAGCCCCUGAC GGAGGCGAUGAAGGUGUCGUUAUUCUCGCUGGUCAUCCCCCCCA DD#D KPP TP CAGUGGAUGUGCCCACUAGGUGGCUAGAGGGGUAGCCCCUGAC GGAGGCGAUGAAGGUGUCGUUAUUCUCGCUGGUCAUCCCCCCCA DD#D KPP TP CGGUGGAUGUGCCCACUAGGUGGCAUGGUAGGUAGCCUCCGAC GCAGGUGAUGAAAGUCUGGUGAUCCAAGCUCGUCAUCGCUGUCA DD#D KP TP CGAUGGAUGUGCCCAAUAGUUGGCCAGGGGGUAGCCCUCGAC GGGGGCAAUGAAGACGUUGUCGCCGAGUUCAUCAUUGCCCCCA DD# VKP TP CGAUGGAUGUGCCGUAUAAUACGAAAAGGCGUGGCGCUCGAC GCAGGCAACGAAGAUGUCAACACUGAUCUCGUCAUCGCUGCCA 4 D#D PB*P TP CCGUGGAUGUGCCAGAUAAUCUGCUCCCGGGGUAGCCCCGGAC GCGAGUGACGAAAAGGUUAACCCGGUGGUUCGUCAUCGUCGUCA 4 D#D P)*P TP GGGUCGUUAGCUCAGUUGGUAGAGCAGUGUACUUUUAAUCAAUGUGUCGCAGGUUCGAAUCCUGCACGACCCCACA D 6P X P DD S 7 T GUCUGUAUGUAACCUAUAAUAGGUAAGUGACCUGACAC GCAGACCGUGUGGAACCCUAGUGGCCGUCAUCGCUGCCA 4 DD#DD M6P 7X TP GGGUGGACUGACCUGGUAACCAGUGCGUAACGCCCCAC CCGGGACGCGUGUGCGCCUACGAGCUGUCAUCGCCGACA 4 D B 7 TP GGGUGGACUGACCUGGUAACCAGUGCGUAACGCCCCAC CCGGGACGCGUGUGCGCCUACGAACUGUCAUCGCCGACA 4 D B TP CUCUGUACGAAAUCCGUCACGGGUGAGUGACUCGAGAC GACGACCGUGUGGAUGCAGACACGCGGUCAUCCCGUCCA 4 D D %I/ 7X TP CCCUGUAUGAAACAGCUCAGCUGCGAGUGACUCGGGGC GGCUACCGUGUGGACACUUAUGGGCCGUCAUCGAGCCCA 6 P %{ P T UCCUGUAUGUUAGGCCCUAGCAUGAGUGUCUCGGAAC GCUUAUAAGAAACACCUCAGGUAUCGUCAUCGAGGCCA CCCUGUACGAAACCGCUCGGCGGUUAGUGACUUGGGGC GGCGACCGUGUGGGUCCCGAGAAGCCGUCAUCGCGCCCA K P D D % 7 T UCCUCUGUGAUUCAGUCGGUAGAACGGCGGACUGUUAAUCCGUAUGUCACGUGUUCGAGUCCAGUCGAAGGAGCCA 6P P 4 D D Q 7 T GGGUGUAUGUAAUCUCUUAGAGGUGGGUGGCCUCUCGC GACGAUCGCGUGAACGCGCCCGGGCCGUCAUCGCGUCCA 4 D DD c/ 7 TP P GCCCGGAUAGCUCAGCUGGUAGAGCAGGGGAUUGAAAAUCCCGCUGUCCUUGGUUCGAUCUCGAGUCCGGGCCACA *P X P 4 DD P 7 T GGCAACCGUGAACCGAUUAUCGUUGGGUGACCUACACC GUGUUGUAUGUGGCUGUGGUCAUGCUGUCAUCAUGCCCA D /P P 4 D D Q P 7 T GCUGAUUAAGCUCAGUUGGUGAAGCGCACCCUUGUGAAGGGUGAGGUCGGCAGUUCGAAUCUGCCUAUCAGCACCA D E P D D 7 T GCCGACUUAGCUCAGUAGGUGAAGCAACUGACUUUGAAUCAGUAGGUCACACGUUCGAUUCCGGUAGUCGGCACCA 6 P D BV 7 T GCUGAUUAGGCUCAGUUGGUGAAGCGCACCCUUGUGAAGGGUGAGGUCCCCAGUUCGACUCUGGGUAUCAGCACCA D E P D D 7 T GCCGAUUAAGCUCAGUUGGUGAAGCAGCGCAUUCUGAAUGCGAAGGUCGUGAGUUCGACUCCUUAUAUCGGCACCA AGGGGGCUAGUUCAAUUGGUGAAGCACCGGUCUCCAAAACCGGGUGUUGGGAGUUCGAGUCUCCUCGCCCCUGCCA D * P 4 D D B 7 T GGGUCCACGCAGGGAAUUAUUCGCUGCUGAGUGACUCCCCAC GUGGUCGGGCAAGACGCGAACGCUACAUCAGUCAUCUCCACCA 44 # QP*P TP GGGUCCACGCAGGGAAUUAUUCGCCGCUGAGUGACUCCCCAC GUGGUCGGGCAAGACGCGAACGCUAAAUCAGUCAUCUCCACCA 44 # QP*P TP GGGUGAUAUGCUCAGCUGGGGAAGCACCUCCCUUCAAAGGAGGGGGUCGGCGGUUCGAUCCCGCUAUCACCCACCA D = P 4 V 7 T CUCUGUAUGUAACCACUAAGUGGUGUGUGGCAUGAGAC GGUAACCGUGUGGACCUGCUGGGGCUGUCAUCAUACCCA 4 DDDD 7X TP CUCUGUAUGUAACCACUAAGUGGUGUGUGGCAUGAGAC GGCGACCGUGUGGACCUGCUGGGGCGGUCAUCCCGCCCA 4 DDDD 7X TP leuP (CAG) leuQ (CAG) (leuT leuV) ileT (GAU) (ileU ileV) ileX (CAU) ileY (CAU) leuU (GAG) leuW (UAG) leuX (CAA) leuZ (UAA) lysQ (UUU) (lysT lysV lysW lysY lysZ)
metT (CAU) (metU) metV (CAU) (metW metZ) metY (CAU) pheU (GAA) (pheV) GUAUGGACUGACCCUGUGGCAGGUGAGUGACUUUACAC CGGUGCCGCGUGGAUCUCGAGAGGCGGUCAUCCACCGCA K P D 7 T GCCUGGACUGACCCGCUGGGCGGUGAGUAACUUGGCAC CGAGACCGCGUGGACUAGGUUGGGCGGUCAUCCCUCGCA GCAUGGACUGACCAUGUGGCAUGUGAGUGACUUUGCAC CGGGACCGUGUGGACGUUGACGGGCGGUCAUCCCCCGCA alaT (UGC) (alaU alaV) alaX (GGC) (alaW) argQ (ACG) (argV argY argZ) argU (UCU) argW (CCU) argX (CCG) asnT (GUU) (asnU asnV asnW) aspT (GUC) (aspU aspV) cysT (GCA) glnU (UUG) (glnW) glnV (CUG) (glnX) gltT (UUC) (gltU gltV gltW) glyT (UCC) glyU (CCC) glyV (GCC) (glyW glyX glyY) hisR (GUG) proK (CGG) proL (GGG) selC (UCA) serT (UGA) serU (CGA) serV (GCU) serW (GGA) (serX) thrT (GGU) thrU (UGU) thrV (GGU) thrW (CGU) trpT (CCA) tyrT (GUA) (tyrV) tyrU (GUA) valT (UAC) (valU valX valY valZ)
valV (GAC) valW (GAC) proM (UGG) ⊄ Thymine + Pseudouridine Dihydrouridine Modification interfering strongly with Superscript III
Insufficient read coverage
tRNA uncharacterized in the Modomics database
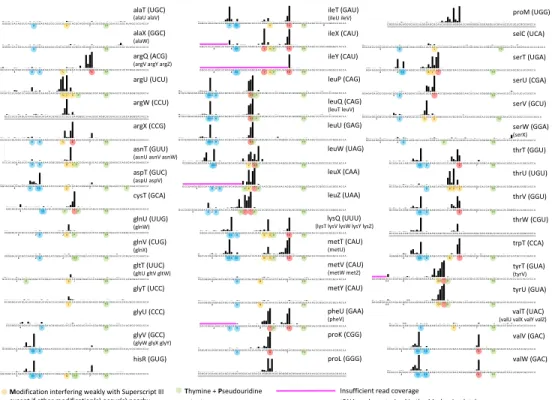
Figure 5. Atlas of ts signals of all E. coli tRNAs, with base modifications reported from Modomics (as of Nov. 2017), with one correction: only one D modification could be attributed to serW (serX). Modomics-uncharacterized tRNAs are underlined with gray lines. Identical tRNA genes are represented only once (copies are listed in brackets). Ts signals are established from the combined coverage of all 9 samples of the present work (Table 2). Magenta lines highlight 5’ portions of tRNAs for which the total coverage was too low to establish ts signals. Plots with individual ts values for all 9 samples are available in Supplemental File S4.
Wang et al. (2020) 6 When modified residues are close to each other, non-linear ts amplifications are observed, a situation that can be 176
attributed to the combined burden that these modifications impose to the core of the RT enzyme. It is thus often not 177
possible to relate specific ts signals with a given modification, although the pattern of these signals is most often 178
altered if a modification is missing. Also, when stretches of U residues occur on the 3’ side of modified bases, the 179
position of ts signal(s) resulting from the interference with the RT enzyme is shifted to the 3’ side due to poly-T 180
computational trimming on DNA reads (see Section “Computational treatment of deep-sequencing data” and 181
supplemental Fig. S3). This effect is highlighted in figures with blue arrows. 182
Following the path of the RT enzyme, ts signals are analyzed below from the 3’ end to 5’ end (Fig. 6a), crossing four 183
regions highlighted in green (from the 3’ end to the 5’ side of the T-arm), salmon (variable loop), sand (anticodon 184
stem-loop) and blue (from the D-loop to the 5’ end). 185
Region of the T-arm
186
The length encompassing the 3’ end of the tRNA to the 5’ side of the T-arm being highly conserved (it comprises 28 187
nucleotides in E. coli, tRNAsel being the only exception with 27 nts), we performed the ts analysis at once by combining
188
signals of all tRNAs (Fig. 6b). Only T and P modifications are present, which do not constitute an obstacle to the RT 189
enzyme (Motorin et al. 2007). From the 3’ end, the first region presenting a significant (albeit very low) ts signal starts 190
after the entry of the T-arm (pos. 65; red arrow). It appears to be related to the RT enzyme encountering the densely 191
folded region of the tRNA, as suggested by a correlation between the proportion of (G+C) residues in the T-arm and 192
the summed ts signals along this segment (Fig. 6b, right inset). The line chart of Figure 6b reveals that the profile of 193
the average signal is highly reproducible: essentially only the amplitude varies among the 9 samples, an effect that 194
we attribute to PCR amplification. The ts signals of pos. 54 and 55 (T and P) combine on pos. 55 (blue arrow on Fig. 195
6b) as a result of poly-A computational trimming (supplemental Figure S3). The variability of the ts signal for individual 196
tRNAs (Fig. 6b, left inset) reveals that it is highly sequence dependent, even though the amplitude of this variability 197
is small. 198
199
Region of the variable loop
200
Only two modified bases are present at the start of the variable loop in some E. coli tRNA: 3-(3-amino-3-201
carboxypropyl) uridine (X) and 7-methylguanosine (7). X is analog to N1-Methyl-3-(3-amino-3-carboxypropyl)-202
pseudouridine, known to allow only minimal bypass by RT enzymes, while 7 was demonstrated not to detectably 203
affect reverse transcription (Motorin et al. 2007). According to the Modomics database, the 7 modification is present 204
in position 46 in slightly more than 50% of all E. coli tRNAs, and only when 7 is present does X occur in position 47 for 205
half of these tRNAs. Our data show that a strong ts signal is always present when X is listed in Modomics (Fig. 6c). 206
Furthermore, additional “trailing” ts signals occur on the 5’ side of the major ts signal when it is higher than ~80% 207
(Fig. 6d). Two important deductions can be made from our results: Figure 6c shows that the ts signal associated with 208
X cannot unambiguously separate 7U from 7X-modified tRNAs, suggesting that all tRNAs with 7U in positions 46-47
209
are converted to 7X to some extent although they may not be listed as such in Modomics (prominent cases are argX 210
0 10 20 30 40 50 60 70 80 90 100
trpT thrU thrV asnT proK metV alaX alaT valT thrT glyV aspT argX hisR valW valV lysQ ileT ileX pheU argQ metT R1a R2a R3a R1b R2b R3b R1c R2c R3c Avg. 0 0,2 0,4 0,6 0,8 1 1,2 1,4 1,6 1,8 2 48 49 50 51 52 53 54 55 56 57 58 59 60 61 62 63 64 65 66 67 68 69 70 71 72 73 74 75 76 A- avg. B- avg. C- avg. AD avg. BD avg. CD avg. ADd avg. BDd avg. CDd avg. b 72 71 70 69 68 67 66 1 2 3 4 5 6 7 0 72 7475 76 65 6463 62 61 57 49 5051 52 53 56 55 54 60 59 58 18 13 12 1110 19 22 23 2425 8 9 44 43 42 41 40 39 35 26 27 28 29 30 31 36 37 38 32 33 34 20 20a 20b21 17a 1716 14 15 45 48 e11 47 e12 46 e13 e21 e14 e22 e15 e23 e16 e24 e17 e25 e1 e26 e2 e27 e3e4 e5 3’ RT enzyme 5’ a c 7 U asnU asnV asnW metW metZ alaU alaV alaW valZ valU valX valY glyW glyX glyY aspU aspV lysT lysV lysW lysY lysZ ileV ileU
pheVargVmetU argY argZ
7 X
Modomics:
pos. 46 47 46 47
tRNAs with 7 in pos. 46
R1a R2a R3a R1b R2b R3b R1c R2c R3c R1a R2a R3a CCAGUUGUC metT hisR GGUGAGGUC R1a R2a R3a asnT 0 50 100 150 200 250 0 20 40 60 80 100 A- B- C-AD BD CD ADd BDd CDd 2.0 1.8 1.6 1.4 1.2 1.0 0.8 0.6 0.4 0.2 0.0
nucleotide position on tRNA 0 1 2 3 4 5 6 123456789 10 11 12 13 14 15 16 17 18 19 20 21 22 23 24 25 26 27 28 29 48 58 68 76 R3c tRNAs R3c avg. 6 5 4 3 2 1 0 0 4 8 12 16 20 24 10 11 12 13 14 15 No of (G+C) pos. 61-65 R1a avg. R2a avg. R3a avg. R1b avg. R2b avg. R3b avg. R1c avg. R2c avg. R3c avg. Sum of ts si gna ls , pos . 6 1 -65 ts signal in pos. 47 Su m o f ts si gn al , p o s. 4 0 -46 47 40-46 metT GAUGGGGUC (trailing ts) 7 X 7 7 X 7 ~97% Avg. 9 samples Avg. /No (G+C) 0 1 2 3 4 5 Te rm in at io n si gn al ts (% ) R1a R2a R3a R1a R2a R3a R1a R2a R3a R1b R2b R3b R1c R2c R3c ts si gn al in p o s. 4 7 (% ) d R1a R2a R3a R1b R2b R3b R1c R2c R3c GAUGGGGUC 7 X
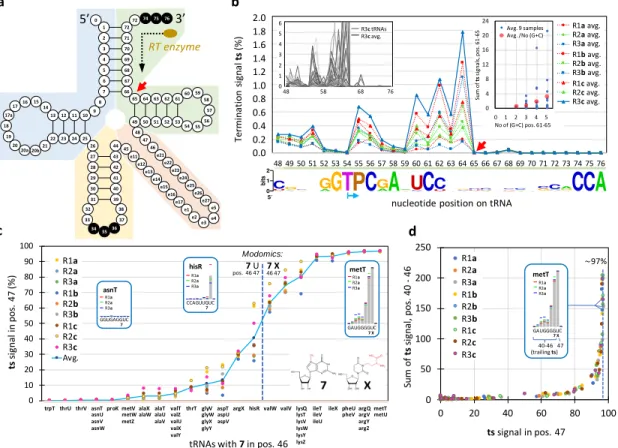
Figure 6. a) Standard tRNA nucleotide numbering according to the tRNA gene database curated by experts website (Abe et al., 2014). The colored regions correspond to the four successively analyzed tRNA segments, from 3’ to 5’: green, red, sand and blue. b) Ts analysis from pos. 76 to pos. 48 (green segment), established from an alignment of all tRNA transcripts. The sample with the highest values (R3c) is highlighted with a thick line. The left inset illustrates individual tRNA values (and the average) of the R3c sample. The right inset shows the sum of the ts signal as a function of the number of (G+C) residues in positions 61 to 65. Each blue dot corresponds to a tRNA; values averaged over all 9 samples (see Table 1). Red dots correspond to values averaged over all tRNAs. The base conservation logo reported at the bottom is based on all E. coli tRNA listed in Modomics. Because T and P modifications correspond to a stretch of two As on the cDNA, the ts signal of the two residues essentially combine into a single signal on the P residue (blue arrow) (see Material and Methods). c) Ts analysis of the variable loop (red segment). Ts signal in pos. 47 for all tRNAs bearing the 7 modification in pos. 46, according to Modomics. For tRNAs with multiple gene copies (e.g. asnT, asnU, asnV, asnW), only one set of values is indicated. tRNA genes are ranked from left to right following an increasing average value of the ts signal. The vertical dashed line splits tRNAs into those with U (left) from those with X in pos. 47 according to Modomics (as of Nov. 2017). Insets illustrate three ts signals. d) Sum of ts values from pos. 40 to 46 (trailing ts signals) as a function of the ts value in pos. 47. Note that according to the Modomics database, all E. coli tRNAs with 7 and X modifications do not have any e residue in the variable loop, implying that the sequences analyzed in c and d follow standard numbering (panel a).
Wang et al. (2020) 7 and hisR). This observation corroborates biochemical analyses performed by Meyer et al. (2019), who showed that 211
the modifications of these two residues are interdependent. Furthermore, the value of the ts signal in position 47 212
converges towards ~97% when the overall signal reaches the highest values (Fig. 6d). Assuming that the fraction of 213
X-modified tRNAs reaches 100% in that case, the bypass rate of this modification by the RT enzyme is of about 3%,
214
the y-axis of Fig. 6c thus representing roughly the percentage at which U47 is converted into X on the tRNAs. A 215
straightforward interpretation of trailing ts signals is that RT enzymes bypassing the X modification drop off one or a 216
few nucleotides downstream as a result of the perturbation caused by the modification embedded in the chimeric 217
cDNA/RNA duplex. 218
Region of the anticodon loop
219
The anticodon loop is by far the region with the most diverse types of modifications (Boccaletto et al. 2018). Figure 220
7 and supplemental Figure S4 highlight ts signals generated by some of the most frequent E. coli modifications. 221
N6-threonylcarbamoyladenosine (6). This large modified base appears to constitute a moderate obstacle to the RT
222
enzyme (Fig. 7a, b, d, e, h). Unexpectedly, a major ts signal is not present at the location of the modification, but one 223
base downstream the path of the RT enzyme (small red arrow), suggesting that it generates an impediment only after 224
being incorporated into the cDNA/RNA duplex. An examination of the read processing revealed that the observed ts 225
pattern (Fig. 7a) is partly the result of incomplete 5’ poly-A trimming due to the incorporation of other bases (often 226
a C) in the poly-A, followed by local mapping (supplemental Fig. S3). Thus, the pattern of ts signals associated with a 227
modification may not always be interpreted as a direct consequence of the interaction between the modification and 228
the RT enzyme. Interference of 6 with other modifications: 6, that is only found in pos. 37, is often accompanied by 229
other modifications in pos. 34 (Q, S) or in pos. 32 (%). Figure 7b, 7e and 7h show that whenever this occurs, the 230
combined perturbations generate a ts response that is stronger than a linear combination of individual ts signals (see 231
below). 232
Queuosine (Q). The effect of this large modification on RT processivity was not assessed in the seminal work of
233
Motorin et al. (2007). Surprisingly, it does not generate a strong ts signal (Fig. 7c), suggesting that the RT enzyme can 234
easily cross this residue if it is not in the vicinity of other modifications (Fig. 7b). 235
5-methylaminomethyl-2-thiouridine (S). This modification generates a small ts signal (Fig. 7f) similar to Q (Fig. 7c).
236
When combined with 6, the resulting ts signal (Fig. 7e) is similar to that of the 6-Q combination (Fig. 7b). 237
2-thiocytidine (%). The nearly isosteric C2-O ® C2-S modification of C does not generate any ts signal when it is in
238
an unperturbed environment such as the one shown in Figure 7i. In that case, the closest modified neighbor is an 239
inosine (I), which is known not to interfere with the RT enzyme, although it leads to the incorporation of C and U 240
(Motorin et al, 2007). However, in the context of a 6 modification in pos. 37 (Fig. 7h), % generates an unexpectedly 241
high ts signal, suggesting that additional modification(s) unlisted in Modomics could be present on the % residue in 242
that case. 243
2-methyladenosine (/). This modification was found to only generate RT pause at low dNTP concentration (Motorin
244
et al. 2007). Representative examples (Fig. 7c, f, i) show that it is indeed associated with almost no ts signal. 245
0 10 20 30 40 50 60 70 80 90 100 C G C C C U U U C A C G G 0 10 20 30 40 50 60 70 80 90 100 C G G A C U G U U A A U C 6 Q asnT(asnU asnV asnW) U U P b 0 10 20 30 40 50 60 70 80 90 100 U C A U A A U C G C U U G 0 10 20 30 40 50 60 70 80 90 100 C G G G A C 0 10 20 30 40 50 60 70 80 90 100 C A G G U G leuP proK 0 10 20 30 40 50 60 70 80 90 100 C C U G A U A A G G G U G
ileT(ileU IleV)
Te rm in a tio n si g n a l ts (% ) 6 a K Te rm in a ti o n si g n a l ts (% ) g 0 10 20 30 40 50 60 70 80 90 100 U G G A U U G U G A U U C / P P hisR U c 0 10 20 30 40 50 60 70 80 90 100 G C U C C C C U G C U A A serV U 6 h 0 10 20 30 40 50 60 70 80 90 100 A C U C G G C U A C G A A
argQ(argV argY argZ)
U i ileX P 6 Te rm in a tio n si g n a l ts (% ) d gltT(gltU gltV gltW) / 0 10 20 30 40 50 60 70 80 90 100 U U G A C U U U U A A U C
lysQ(lysT lysV lysW lysY lysZ)
P U f U U U S 6 S P } / I % % Q K e
Figure 7. Ts analysis of the anticodon loop. Plots of the average values and standard deviations established from all 9 samples (Table 1), highlighting ts signatures of some typical E. coli combinations of modifications (panels a to i) and their ts error that occur when only a single sample is considered. Anticodons are boxed in magenta. Known modifications are reported from the Modomics database below the sequences (5’-3’). Highlighted modifications (in orange and red) are illustrated above in the same order (cartoons are from the Modomics website). A blue arrow indicates a shift of a ts signal associated with a modification as a result of the presence of U residue(s) on its 3’ side (highlighted in blue), an artifact caused by poly-T computational trimming (see Material and Methods). Red arrows highlight the shift of the ts signal to the 5’ direction observed with the 6 modification. The ts signal could not be established on the 5’ side of the } modification for IleX (panel d, dashed lines) in all samples. Although Inosine (I) is associated with a low ts signal (panel i), an examination of the read coverage shows that it leads to incorporation of 86%C and 14%U on the cDNA, a typical signal of the presence of this modification (Schwartz and Motorin, 2017).
Wang et al. (2020) 8
2-lysidine (}). Only one E. coli tRNA bears this large modification, that is associated with a strong ts signal (Fig. 7d).
246
1-methylguanosine (K). This small modification is known to constitute a major obstacle for the RT enzyme (Motorin
247
et al. 2007, Zheng et al. 2015). This can clearly be seen in our data: with proK tRNA (Fig. 7g, left), the average ts signal 248
at the position of the modification is as high as 99.65 ± 0.08 %, corresponding to a coverage drop from 283,925 to 249
864 reads with the AD sample. Assuming a rate of modification of 100% in that case implies a bypass rate of the order 250
of 0.35%. As a result of computational trimming, the major ts signal is shifted when a pseudouridine (P) is present on 251
its 3’ side (Fig. 7g, right). 252
2-methylthio-N6-isopentenyladenosine (*). This base has a complex pattern of modifications that is expected to
253
strongly impair the RT enzyme. It consistently generates a high ts signal (supplemental Fig. S4a). All related tRNAs 254
only have 7, T and P modifications upstream the path of the RT enzyme, which do not affect its processivity. The only 255
exception is pheU (pheV), that bears the dual 7X modifications in the variable loop. Although this early roadblock 256
generates a strong ts signal in these tRNAs, our data show that the ts signal at the * position is identical to that of 257
other tRNAs (supplemental Fig. S4b), demonstrating that ts signals generated by distant modifications along 258
transcripts may be considered as independent. 259
Uridine 5-oxyacetic acid (V). In a way similar to the % modification, V essentially does not generate any ts signal
260
when occurring in a sequence context without perturbing modifications (supplemental Fig. S4c, d). When other 261
nearby modifications are present, such as in the case of LeuW, the effect of this base is difficult to assess because 262
stretches of U are present (supplemental Fig. S4e). 263
2ʹ-O-methylcytidine (B). This modification is known to generate RT pauses at low dNTP concentration (Motorin et al.
264
2007). In a sequence context without any other modified base, B does only generate a faint ts signal similar to V 265
(supplemental Fig. S4f). With a * modification 6 bases upstream the path of the RT enzyme, the associated ts signal 266
is slightly more pronounced (supplemental Fig. S4g), and with an additional V residue in between B and *, a strong 267
and complex ts pattern is observed (supplemental Fig. S4h). This last example illustrates the non-linear response of 268
the ts signal in the presence of three modifications, two of which do almost not generate any signal when found 269
isolated (supplemental Fig. S4c, f). 270
Region of the D-loop
271
Dihydrouridine (D). With 152 reported instances, D is the most frequent tRNA modification found in E. coli MG1655
272
tRNAs according to the Modomics database. Because the D-loop is located near the 5’ end, there is often not much 273
exploitable signal in each sample due to 3’ upstream termination events caused by RT-blocking modifications (Fig. 274
3a). However, with the coverage provided by 9 deep-sequencing samples, accurate ts signals can be established up 275
to the 5’ end for all but 5 weakly expressed tRNAs (Fig. 5). D is known to only create RT pauses (Motorin et al. 2007). 276
The presence of major ts signals associated with this modification therefore came as a surprise. It turns out that these 277
signals are highly dependent on the number of dihydrouridine(s) known to occur on the D-loop, a phenomenon 278
already noticed by Clark et al. (2016), although our quantitative analysis leads to a different conclusion with regard 279
to the effect. Considering the sum of ts signals in 11-nt windows centered on each dihydrouridine, a near clear-cut 280
Wang et al. (2020) 9 threshold separates loops with one and two from those with three and four dihydrouridines when the window with 281
highest ts sum is considered (Fig. 8a,b). No clear sequence context allows to predict the position of the major ts 282
signal, which can be associated either with a doublet of dihydrouridines (glyV) or with one dihydrouridine (ileT). 283
Furthermore, it can occur ‘early’ (aspT) or ‘late’ (ileT) along the path of the RT enzyme (Fig. 5). Clark et al. (2016) 284
found a strong signal associated with a doublet of dihydrouridine in human tRNAasn (GUU), and concluded that a
285
doublet sufficiently destabilizes the RT enzyme to lead to transcription abortion. Our analysis suggests instead that 286
all three U residues present on the D-loop of this tRNA are likely modified. Similarly, our analysis predicts the presence 287
of an unknown D modification on the D-loop of leuW, where only two dihydrouridines are listed in the Modomics 288
database. The ts signal analysis (Fig. 8b) and a sequence context that is identical to that of five other leucine tRNAs 289
where an analogous uridine is modified (Fig. 8d) are indeed both consistent with the presence of a third 290
dihydrouridine. With a high ts signal and only two possible D modifications on the loop, the case of serT is less clear 291
(Fig. 8d). Examination of the Modomics database reveals that whenever a uridine is present in the D-loop, it is 292
essentially modified into D, with two exceptions, glyT and argU (Fig. 8c). Our predictive analysis (Fig. 8b) suggests 293
that at least two among the four uridines present in the D-loop of glyT are indeed not modified (Fig. 8d), supporting 294
the possibility of this exception (the ts signal associated with argU cannot be unambiguously interpreted). 295
296
Quantification of -CCA ending tRNA transcripts
297
Since amplified 3’ tRNA segments are always long enough to be uniquely mapped onto the genome (except for 298
identical tRNA genes), a relative frequency of tRNA isoacceptors can be established by reporting the number of reads 299
at the position of the 3’ end (Fig. 9a; see also Fig. 3a). It is, however, important to keep in mind the non-linear nature 300
of PCR amplification, that changes RNA transcripts true relative frequencies. Figure 9a shows that the observed 301
frequencies are comparable among all three biological replicates, and that sample treatment (a, b or c) only has a 302
marginal effect, except for isoacceptors for which the amino acyl linkage is particularly resistant (ile, val) or prone to 303
hydrolysis (ser) (Matthaei et al. 1966). In the first case, deacylation increases these frequencies, while isoacceptors 304
that are already substantially deacylated without any treatment become proportionally less represented (ser). Our 305
data thus show that deacylation still occurs with a and b samples, that allowed the ligation of the RNA adapter. The 306
mild pH of the RNA adapter ligation step (pH 7.5; overnight incubation at 10°C) is likely responsible for this 307
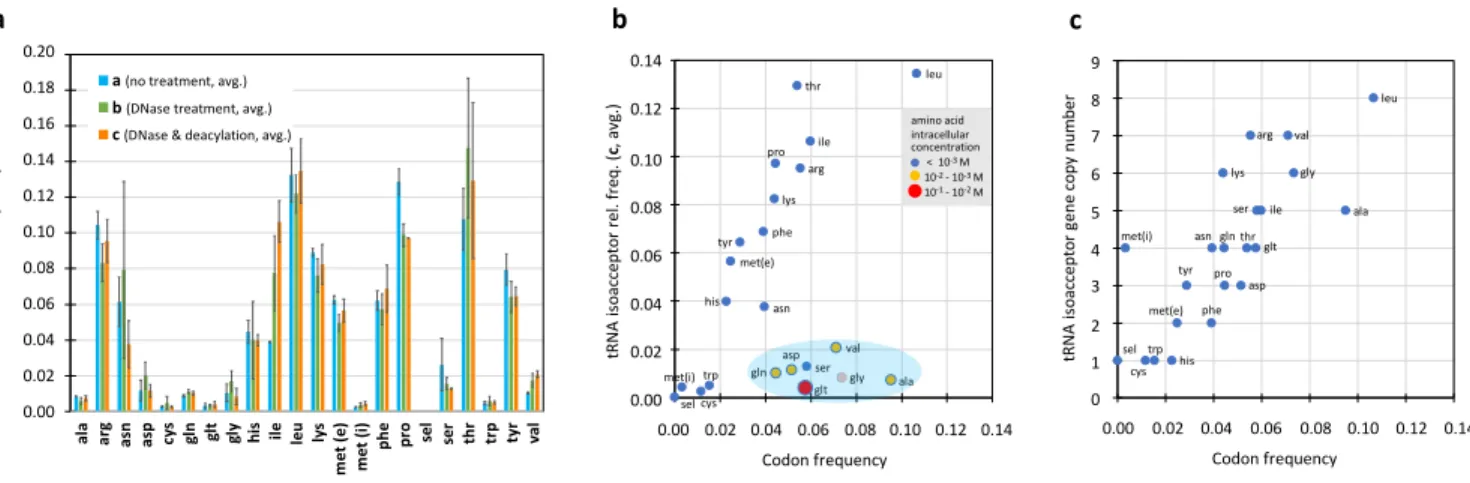
phenomenon. Deacylated samples (c) provide a picture of the population of all tRNA isoacceptors regardless of their 308
aminoacylation state. Figure 9b shows that their relative frequency mainly follows that of their corresponding codons 309
in the E. coli genome, a phenomenon that is expected based on tRNA gene copy number (Fig. 9c) (Higgs and Ran 310
2009; Du et al. 2017). Transcripts of a group of isoacceptors (gln, asp, ser, glt, val gly and ala), however, appear 311
significantly underrepresented, a feature that was not observed in a study in which quantification was achieved by 312
probe hybridization on gel (Dong et al. 1996; supplemental Fig. S5). While we could not find a clear explanation for 313
this result, it is possibly related to the -CCA 3’ end requirement of our protocol. The 3’ terminal adenosine can be 314
specifically removed by RNase T in E. coli (Deutscher et al. 1984, 1985), in which case these tRNAs would not be 315