HAL Id: hal-00683199
https://hal.archives-ouvertes.fr/hal-00683199
Submitted on 28 Mar 2012
HAL is a multi-disciplinary open access
archive for the deposit and dissemination of
sci-entific research documents, whether they are
pub-lished or not. The documents may come from
teaching and research institutions in France or
abroad, or from public or private research centers.
L’archive ouverte pluridisciplinaire HAL, est
destinée au dépôt et à la diffusion de documents
scientifiques de niveau recherche, publiés ou non,
émanant des établissements d’enseignement et de
recherche français ou étrangers, des laboratoires
publics ou privés.
An experimental comparison of Grid5000 clusters and
the EGEE grid
Tristan Glatard, Johan Montagnat, Xavier Pennec
To cite this version:
Tristan Glatard, Johan Montagnat, Xavier Pennec. An experimental comparison of Grid5000
clus-ters and the EGEE grid. Experimental Grid testbeds for the assessment of large-scale distributed
applications and tools, Jun 2006, Paris, France. pp.1-10. �hal-00683199�
An experimental comparison of Grid5000 clusters and the EGEE grid
Tristan Glatard, Johan Montagnat
I3S, CNRS
{glatard,johan}@i3s.unice.fr
Xavier Pennec
INRIA, Epidaure
[email protected]
Abstract
In this paper, we present a set of experiments compar-ing the EGEE production infrastructure and the Grid5000 experimental one. Our goal is to better understand and quantify how these systems behave under load. We first identify specific characteristics of the workload and data management systems of these two infrastructures, underlin-ing some of their limitations and suggestunderlin-ing some improve-ments. We experimentally determine characteristic param-eters for each infrastructure. From them, we build a multi-grids model that minimizes the execution time of an appli-cation by finding the best repartition of jobs between these two systems. We finally coherently compare Grid5000 clus-ters and EGEE using a real medical imaging application.
1. Introduction
Grids are novel and complex systems that are difficult to optimally exploit from the end users point of view as their behavior is not very well known. In this paper, we compare two grid infrastructures, namely Grid5000 and EGEE. Our ultimate goal is to understand, from an application point of view, when it is preferable to use a given system. Through a set of experiments, we present quantitative results charac-terizing the performance of those systems. We identify what differentiates those two platforms that define themselves as
experimental (Grid5000) and production (EGEE). We
un-derline their respective main limitations and propose some improvements.
A brief overview of those systems is first presented in section2. We then evaluate some of their specific aspects that are of major importance from an application point of view: workload management (section3) and data manage-ment (section4). We finally compare the two systems in a realistic scenario using a scientific medical imaging appli-cation.
2. Grid5000 and EGEE infrastructures
The basic components of the EGEE and Grid5000 plat-forms are the infrastructure, the workload management sys-tem and the data management one. The infrastructure cov-ers the physical aspects of the system. Workload manage-ment is responsible for the submission, scheduling, execu-tion and results collecexecu-tion of the jobs. Data management handles representation, storage and access to the data files.
2.1. Grid5000
This platform is made of 13 clusters, located in 9 French cities and including 1047 nodes for 2094 CPUs. Within each cluster, the nodes are located in the same geographic area and communicate through Gigabyte Ethernet links. Communications between clusters are made through the french academic network (RENATER). We will focus on 2 particular clusters of this infrastructure: the “idpot” cluster of the Grenoble site, made of 20 2 GHz biprocessor nodes and a larger Grid5000 cluster in Sophia Antipolis, made of 105 biprocessor nodes.
Grid5000’s nodes are accessible through the OAR batch scheduler [1], from a central user interface shared by all the users of the cluster. A cross-clusters super-batch system, OARGrid, is currently being deployed and tested.
The home directories of the users are mounted with NFS [6] on each of the infrastructure’s clusters. Data can thus be directly accessed inside a cluster. Data transfers be-tween clusters have to be handled by the users. The storage capacity inside each cluster is a couple of hundreds of giga-bytes.
2.2. EGEE
This platform is a pool of 18,000 CPUs clustered in more than 180 computing centers. Users are grouped into Virtual Organizations (VOs) which can only access a limited num-ber of resources. For our VO, about 3000 CPUs, distributed in 25 computing centers are available. The infrastructure is
spread all over the world and communications between its components are done through the Internet.
Resources are accessible through the LCG2 middleware. This middleware is based on various components coming from the European DataGrid middleware, Globus Toolkit, Condor, and other toolboxes. Jobs are described in a dedi-cated format (Job Description Language) which mainly in-cludes the executable to be run, and the input and output files to be transfered to the execution resource. Jobs are submitted from a user interface to a central Resource
Bro-ker (RB) which distributes them to the Computing Elements
(CEs) where they are queued in a batch scheduler and finally run on Worker Nodes (WNs).
Specific resources are dedicated to data storage. Those storage elements have a total capacity of 5 petabytes, 21 ter-abytes of them being accessible for our VO. Data transfers between the Storage Elements (SEs) and the worker nodes are mainly done through the gridFTP protocol. Other proto-cols such as RFIO are also available but they are only used by a limited number of users. Data files are identified by
Logical File Names (LFNs) on the EGEE grid. LFNs
iden-tify files which may be replicated in multiple physical in-stances for fault tolerance and optimization reasons.
2.3
Differences between both systems
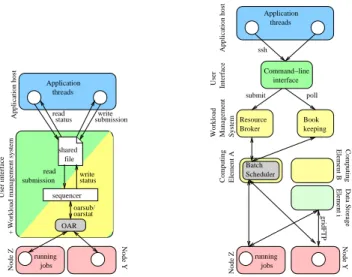
Figure1displays the interactions between the main com-ponents of the studied systems. To perform experiments on the Grid5000 clusters, we implemented a sequencer to avoid overloading the OAR batch scheduler. Indeed, this sched-uler processes connections in parallel but making a high number of parallel queries rapidly overloads the user inter-face which hosts the OAR server. In practice, we were not able to submit and monitor more than 80 jobs in parallel. To cope with this limitation, we implemented a sequencer that puts the OAR queries coming from independent application threads in sequence. On the EGEE system, the Resource Broker sequentially processes the incoming connections.
The EGEE infrastructure is a production grid, strongly administrated and exploited 24/7 for scientific production. Its resources are part of ever loaded computing centers and are shared by a very large users community (in the order of 1000 registered users). They are distributed on the WAN and likely to be affected by network instabilities. Con-versely, Grid5000 is an experimental grid, whose goal is to ease research works on grid infrastructures. The resources are only shared by dozens of users and may be reserved and tailored for specific experiments. It is possible for a user to get root access on them and to deploy its own operat-ing system, whereas it is not possible on EGEE. Resources are volatile but the connections inside each cluster are much more stable.
The system load and the (computing or network)
re-Node Y
User interface
Node Z
Application host
+ Workload management system
file shared OAR sequencer Application threads read status submission running jobs write submission oarsub/ oarstat write status read Node Z Node Y Computing Element A Data Storage Element i Book keeping
Workload Management System
Interface User Batch Scheduler Resource Broker Computing Element B submit poll Application host ssh gridFTP interface Command−line Application threads running jobs
Figure 1. Overview of the systems. Left:
Grid5000 ; right: EGEE
sources volatility have severe consequences on the schedul-ing and queuschedul-ing times of the systems. One direct conse-quence is the variability measured and discussed in the next sections. A side effect is the non null probability to get out-liers: jobs that are lost or blocked for a considerable time before being processed. This problem is characteristic of grid infrastructures and cannot be ignored unless a single job could stop a very complex computation. Timeouts have to be set up to deal with such outliers. For the same reason, we did not compute any means nor standard deviations in the analysis of the experimental results shown below. We used medians and inter-quartile ranges (IQR) which are less sensitive to outliers instead. Considering a sorted set of values, the IQR is the interval defined between the first quarter and the third quarter of the number of values. It rep-resents the interval of the most relevant values, ignoring the 25% lowest and highest ones.
3. Workload management performances
3.1
Variable of interest
The variable of interest in this section is the overhead caused by the workload management system. We define it as the difference between the execution time of a job (i.e. the duration between the submission time of the job and the instant when the results become available) and its running
time (i.e. the time it is effectively running on a resource).
As it will be shown in this section, this overhead may be very high on large scale infrastructures. It strongly penal-izes the execution of applications with a high turn-over of jobs to process. It may come from (i) the network
infras-tructure itself, (ii) the middleware components (scheduling time, latency of the information system) and (iii) the system load (queuing time in batch and services queues).
3.2
Experimental method
To measure the overhead, we progressively loaded the workload management system by submitting an increasing number n of short jobs. We resubmitted a new job each time a job completed, so that the total load introduced by the experiment was constant. We considered short (trun=1
minute long) jobs. These jobs were sleeping for one minute to ensure constant execution time independently from the hardware on which they were running. This experimental setting favored a short turn-over of jobs and stressing con-ditions of the WMS. Experiments were run over 3 hours pe-riods (a long enough period compared to the jobs duration to capture the system behavior over a statistically significant number of measurements). We measured the execution time
texecof the jobs. A measure of the system overhead time
toverwas obtained by computing the difference texec− trun.
3.3
Results
Figure2displays the median of toverfor a growing
num-ber n of submitted jobs and for the 3 studied systems. This figure also displays, for each measure, the inter-quartile range (IQR) of the overhead. This information measures the spread of the samples and gives an information about the variability of the system. For this experiment, 20, 000
jobs were submitted to the EGEE infrastructure,32, 000 to
the Sophia cluster and28, 000 to the Grenoble one.
The experimental results suggest an affine behavior of the median overheads with respect to the number of concur-rently submitted jobs. We thus fitted a linear model A.n+B
to the median overhead curve of each system. The lines ob-tained are plotted on figure2.
The parameters of this model are shown in table1, where the systems are sorted from the smallest one to the widest. The determination of those parameters was done by a linear regression on the median experimental values of the over-head.
Those parameters will be used as metrics, to characterize the variation of the median of the overhead with respect to the number of jobs for each system. The B parameter mea-sures the nominal overhead of the system. It corresponds to the overhead introduced by the system without any load. The inverse of A measures the scalability of the system with respect to the number of jobs. It represents the additional time generated by the submission of 1 extra job to the sys-tem.
Despite its simplicity, this model provides a relevant way to compare grid infrastructures, as detailed in the following
0 200 400 600 800 1000 1200 1400 1600 1800 0 100 200 300 400 500 600 700 800 Overhead (s) Number of jobs n Measures EGEE Model EGEE Measures Grenoble Model Grenoble Measures Sophia Model Sophia
Figure 2. Overhead time vs number of jobs
System A (s/job) B (s) Grid5000 – Grenoble 3.44 0.48 Grid5000 – Sophia 0.74 8.25 EGEE – biomed VO 0.24 351.4
Table 1. Workload management evaluation
discussion. Moreover, it will allow the design of a multi-grids model introduced in section5.
3.4
Median analysis
Nominal overheads (B metric) are growing with the size of the infrastructure. This result is not surprising from a qualitative point of view. Quantitatively, the EGEE system has a very strong nominal overhead. This value, close to 6 minutes (351 s), may come from (i) the size of the in-frastructure, which leads to high communication costs and (ii) its load, which leads to never empty waiting queues and processing delays on the middleware services. This huge nominal overhead is a characteristic of production infras-tructures. On the contrary, the nominal overhead of the Grenoble cluster of Grid5000 is far lower. Accessing the infrastructure requires less than a second. This performance comes from (i) the relative low load of the infrastructure and (ii) the reduced size of the infrastructure that makes com-munication costs lower. The Sophia cluster of Grid5000 is not very far from Grenoble, with an access time of 8.25 sec-onds.
Conversely, the scalability of the systems is improving with their size. The job scalability of the EGEE system constitutes its main advantage. The overhead only grows by 3.5 minutes from the submission of 5 jobs to 1000 jobs and the overhead due to the submission of one extra job is 0.24 second (A metric). Conversely, the scalability of the Grenoble cluster of Grid5000 is weak. Submitting a single extra job leads to an overhead growth of 3.44 seconds. Here
again, the Sophia cluster stands in the middle: its A metric is 0.74 seconds. It is three times weaker than on EGEE and 4.65 better than on the Grenoble cluster.
3.5
Improving scalability
The submission procedure plays a strong role in the growth of the median overhead w.r.t the number of jobs. In-deed, on all the evaluated systems, submission is done from a single entry point (the user interface) to a central workload manager (OAR or RB host) through the network. These two hosts and the network connection may become bottlenecks beyond a critical stressing level.
If we compute again the A metric on the values without submission time, we obtain 0.07 s/job for the EGEE sys-tem, 0.34 s/job for the Sophia cluster and 2.93 s/job for the Grenoble one. Comparing those values to the ones obtained in table1, one can thus conclude that the submission proce-dure respectively leads to a 3.24, 2.15 and 1.18 slow-down ratios on the job scalability.
A solution to improve scalability could therefore be to distribute the submission system, which is a real bottleneck on all the systems studied, as shown above. Many Resource Brokers are available on the EGEE system. Nevertheless, they do not communicate between each others and seri-ous performance drops can be forecasted in the scheduling when the load reaches a critical point. Solutions such as the DIET middleware [2], where many collaborative schedulers (so-called Master Agents) are able to administrate the same pool of resources should thus be studied.
3.6
Analysis of the variability
Variability around the median overhead values is an im-portant parameter as it may strongly influence the validity of experimental measures.
The main factor of variability is the load of the system that can be defined, at a given instant, as the number of jobs being currently handled by the platform. The variability of the overhead may thus come from (i) the amount of jobs submitted by the application itself and (ii) the amount of jobs currently submitted by other users.
To have an idea of the order of magnitude of variabil-ity on the studied systems, we plotted on figure3, for each 3-hours measure, the inter-quartile range (IQR) of the over-head time of the submitted jobs tover.
On the Sophia cluster, the amount of running jobs from other users was stable along the experiment. The evolution of the variability thus strictly comes from the amount of jobs submitted during our experiment. We can see that the variability is growing with the number of jobs. This growth comes from (i) the waiting duration in the OAR queue and
0 50 100 150 200 250 300 350 400 0 100 200 300 400 500 600 700 800 900 1000 IQR (s) Number of jobs n EGEE Sophia Grenoble
Figure 3. IQR of the overhead vs job number
(ii) the submission time. Both of those processes are se-quential and the variability between the first and the last submitted jobs is thus growing with the number of jobs. On the Grenoble cluster, the situation is almost the same, except for two measures done around 80 jobs. Those two measures are clearly outliers. It can be explained by the load coming from other users at that time. On those two last systems, the variability for a low number of submitted jobs remains lower than 15 seconds. Indeed, a few number of processors may always be available and accessible without any delay.
On the EGEE infrastructure, the situation is quite differ-ent. Variability is around 3 minutes, even for a low number of submitted jobs. The order of magnitude of the variabil-ity remains constant for less than 600 jobs. We can thus conclude that this variability mainly comes from the load introduced by other users. Conversely, for more than 600 jobs, the variability is highly growing. This growth may come from the load introduced by our experiment, either on the waiting queues of the system or on the submission pro-cedure. As already mentioned before, the Resource Broker constitutes a critical bottleneck as it sequentially treats the submission requests, thus increasing the variability of the overhead among the jobs.
This high variability, even for a low number of concur-rently submitted jobs leads to a problem specific to large-scale production infrastructures: a single job is likely to penalize the whole application performance if it remains blocked in a waiting queue of the system. We proposed in [4] a probabilistic framework addressing this problem by optimizing the job granularity. We believe that probabilis-tic approaches are suited to cope with this emerging prob-lem and plan to extend this approach to the optimization of other variables such as the timeout value whose determina-tion plays a key role in the limitadetermina-tion of jobs overheads.
4. Data management performances
Experimental setting. To compare the performances of the data management systems of EGEE and Grid5000 in-frastructures, we submitted to the infrastructures a number of jobs doing nothing but transferring a known amount of data on their execution resource. To limit the overhead due to concurrent job submissions, only a few of them (5) were submitted in parallel. To get information about the variabil-ity of the results along time, measures were done on a 3 hours time duration.
Data was made of 7.8MB files that were sequentially transfered to the resource. This granularity corresponds to the size of the images used in our application (see sec-tion6 for details). We measured the median running time of those jobs by subtracting the median overhead measured in section3to the median execution time texecof those jobs,
which includes data transfers.
Results. The results of this experiment are displayed on figure4, where the EGEE system is compared to the Greno-ble cluster of Grid5000. Medians and IQRs segments are plotted. The total number of jobs submitted was 460 for
EGEE and1137 for the Grenoble cluster.
Median performances of both data management systems are quite similar. The mean speed-up of the Grenoble clus-ter data management system with respect to the EGEE one is1.19. This result indicates a good level of performances
for the EGEE data management system as this experiment implied inter-clusters transfers, whereas only intra-clusters transfers were performed on Grid5000.
Here again, the variability of the data transfers time on the EGEE infrastructure is far more important than on the Grenoble one. The mean IQR measured on the EGEE in-frastructure is indeed2059 seconds, whereas it is 214
sec-onds on the Grenoble cluster. This experiment again high-lights the importance of variability around median parame-ters on production grid systems.
5
Multi-grids modeling
Grid5000 and EGEE exhibit different behaviors under load. It is therefore interesting to determine, given a number of jobs to process, the optimal fraction of these jobs that should be submitted to each infrastructure to minimize the total execution time. In this section, we propose a multi-grids model, based on the experiments of section 3. We will show that the analysis of this model also provides new metrics to compare the infrastructures.
0 500 1000 1500 2000 2500 3000 3500 4000 4500 5000 0 200 400 600 800 1000 1200 1400 Running time (s) Data size (MB) Measures EGEE Measures Grenoble
Figure 4. Median running times of data jobs
5.1
Principle
Let us consider two systems and a total number n of jobs to submit in parallel. Let δ ∈ [0, 1] be the fraction of jobs
to submit on the first system. Let t(i)over(n) be the median
overhead time introduced by system i when it deals with the submission of n concurrent jobs. The goal is to minimize the mean overhead time of the submitted jobs which is:
H(δ) = δ.t(1)over.(δ.n) + (1 − δ).t(2)over.((1 − δ).n)
Our problem then resumes to the minimization of H w.r.t
δ. If we consider the linear model presented in section3.3,
H(δ) becomes:
H(δ) = δ(A1.δ.n+ B1) +
(1 − δ)(A2.(1 − δ).n + B2)
where, Ai and Biare the model parameters of the ith
sys-tem. H has a unique minimum reached for the optimal pro-portion of jobs ˆδ to submit on the first system:
ˆ
δ(n) = B2− B1+ 2.A2.n 2.n.(A2+ A1)
(1)
We have to determine when ˆδ(n) is in [0,1]. In the
fol-lowing, we suppose that system 1 is larger than system 2. According to section3.4, it implies that B1> B2. Indeed,
our experimental results showed that the nominal overhead of the largest system is higher than the one of the small-est one. Conversely, A1 < A2 because the scalability of
the largest system is better than the one of the smallest one. In this case, it is straightforward to prove that ˆδ(n) < 1.
This result shows that the proportion of jobs to submit on the smallest infrastructure is never null. Indeed, the small-est but fastsmall-est infrastructure has to be overwhelmed before
starting submitting on the largest one. Moreover, we can show that ˆδ(n) is positive if and only if n ≥ n0 = B2.A1−B2
2 .
This result identifies three phases of job submission. In the first one, when n≤ n0, the number of jobs is low enough
to submit all of them on the smallest infrastructure. This first phase is an initialization one. When n exceeds the crit-ical value n0, the transient phase begins: a proportion ˆδ(n)
of jobs have to be submitted on the largest platform. Dur-ing this second phase, another variable of interest is n0.5,
the number of jobs for which ˆδ(n) is 0.5, thus implying
that the same number of jobs is submitted to both infras-tructures (n0.5 = BA12−−BA21). Beyond this point, the largest
system starts being preponderant. The model finally enters a saturation phase, where ˆδ tends to its asymptotic value ˆ
δ(∞) = A2
A1+A2. This value is inferior to1 and denotes the
remaining proportion of jobs that would always be submit-ted to the largest platform, even if the number of concur-rently submitted jobs becomes very high.
5.2
Application to the studied systems
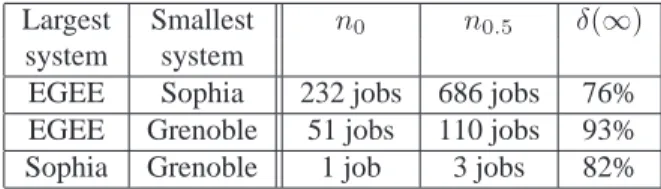
The variables of interest identifying the 3 phases de-scribed in the previous section are displayed, for each pair of systems, in table2. The first line of this table compares EGEE to the Sophia cluster of Grid5000. The value of n0
indicates that there is no need for using EGEE if the number of jobs is less than232. The transient phase starts from this
critical number of jobs. This value is twice as high as the number of processors of the Sophia cluster. On the next line, comparing EGEE to the Grenoble cluster, the critical num-ber of jobs is51, which is 4 times higher than the number of
processors of the Grenoble cluster. Those values of n0are
high, compared to the number of processors of the infras-tructures. They are another way to perceive the difference between a production and an experimental infrastructure.
On the contrary, the last line of this table indicates that the critical number of jobs from which it is necessary to sub-mit on the Sophia cluster rather than only on the Grenoble one is1. Indeed, even if those two clusters differ in their
number of processors, the nominal overhead of Sophia’s cluster has the same order of magnitude as the one of Greno-ble’s cluster. Thus, it is not penalizing to submit jobs on the Sophia cluster even if the Grenoble one is not overwhelmed. The n0.5 value of the same table can lead to similar
in-terpretations. This value corresponds to the abscissa where the lines cross on figure2. We thus can see that the EGEE infrastructure and the Sophia cluster lead to the same over-head if686 jobs are submitted on each infrastructure. This
number of jobs is110 when comparing EGEE to the
Greno-ble cluster and3 for the Sophia versus Grenoble
compari-son.
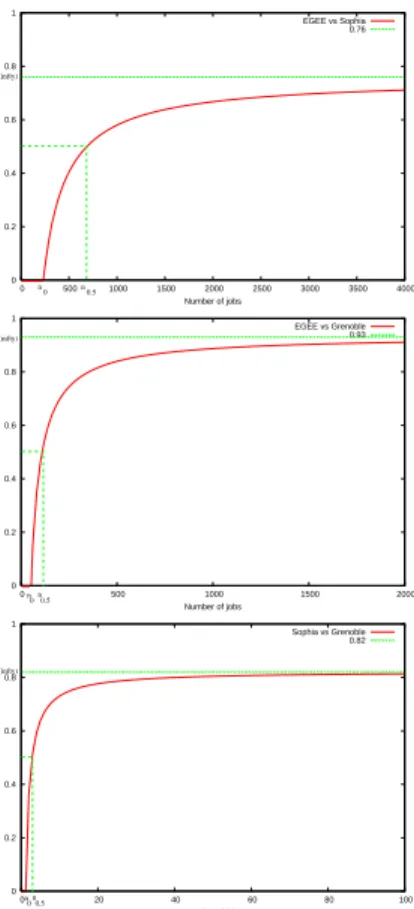
To have an idea of how the proportion of jobs to sub-mit on the largest system grows, we plotted on figure5the
Largest Smallest n0 n0.5 δ(∞)
system system
EGEE Sophia 232 jobs 686 jobs 76% EGEE Grenoble 51 jobs 110 jobs 93% Sophia Grenoble 1 job 3 jobs 82%
Table 2. Variables of the multi-grids model
evolution of ˆδ for each pair of systems. All those curves
are growing with the number of jobs, as it could be pre-dicted from equation 1. The bottom one, comparing the Sophia and the Grenoble clusters, grows rapidly and con-verges to δ(∞) = 82%. This value characterizes the
satu-ration phase. It indicates the proportion of jobs to submit to the Sophia cluster when the total number of jobs to submit is high. This result is close to the proportion of nodes on the Sophia cluster in the total number of nodes on the two systems: 105+20105 = 84%.
Looking at the two upper curves of figure5, we can see that they are growing as rapidly as the difference of scale between the two compared systems is high. Concerning the comparison between EGEE and Grenoble, the curve con-verges to δ(∞) = 93%. This limit is 76% for the
com-parison between EGEE and the Sophia cluster. This result indicates that whatever the number of concurrently submit-ted jobs is, there is no need to submit more than 76% of
them on the EGEE infrastructure.
5.3
Validity of the results
The results presented in the beginning of this section are all inferred from the experiment described in section 3.2, where all the submitted jobs are of identical running time (1 minute). On a real application, execution times may strongly vary among the jobs and they would depend on the performance of the machines, which is not measured here.
Moreover, the multi-infrastructures execution model does not include parameters such as data transfers between infrastructures and variable job times that would appear on a real application. Developping this model is one of our future goals.
6. Real application case
The goal of this section is to see whether the conclusions of the previous sections on controlled experiments still hold on a real application workflow. To better understand the be-havior of the application on each system, we will compare the effects of different kinds of parallelism on the applica-tion execuapplica-tion time.
Our application aims at assessing the accuracy of medi-cal image registration which is a fundamental processing in
0 0.2 0.4 0.6 0.8 1 0 500 1000 1500 2000 2500 3000 3500 4000 Number of jobs EGEE vs Sophia 0.76 n0.5 n0 d(infty) 0 0.2 0.4 0.6 0.8 1 0 500 1000 1500 2000 Number of jobs EGEE vs Grenoble 0.93 d(infty) n0n0.5 0 0.2 0.4 0.6 0.8 1 0 20 40 60 80 100 Number of jobs Sophia vs Grenoble 0.82 d(infty) n 0n0.5
Figure 5. Evolution of ˆδ: from top to
bot-tom: EGEE vs Sophia, EGEE vs Grenoble and Sophia vs Grenoble
medical imaging. It consists in searching a 3D transforma-tion between two images, so that the first one can superim-pose on the second one in a common 3D frame.
The assessment method implemented by this application is the Bronze-Standard [5]. This method computes the ac-curacy of a given registration algorithm by comparing its results to the ones obtained by other algorithms. The more important the number of input image pairs is, the more rele-vant the obtained accuracy results are, as they are based on a statistical analysis. The same computation workflow needs to be processed on large input image databases. This appli-cation is particularly adapted to a grid execution because of its intrinsic data parallelism.
6.1
Experiment
This application was deployed using MOTEUR, a service-based workflow enactor that we previously devel-oped [3]. It is able to optimize the iteration of a single work-flow on a large number of data sets. MOTEUR is run on the application host of figure1.
Three different kind of parallelism are present in such service-based workflows. Workflow parallelism is the first level of parallelism that can be exploited. It is intrin-sic to the workflow and depends on the graph topology.
Yasmina can be executed in parallel. Data parallelism occurs when data sets are processed independently from each other. Therefore, different input data can be processed in parallel on different resources. This kind of parallelism leads to considerable performance improvements. Services
parallelism occurs when the processing of two different
data sets by two different services are totally independent. This pipelining model, very successfully exploited inside CPUs, can be adapted to sequential parts of service-based workflows.
To compare the performances of the Grid5000 and EGEE systems on our application, we executed it on those two platforms with12, 66 and 126 image pairs, respectively
leading to the submission of 72, 396 and 756 jobs. Each image is a 256×256×60 16 bits MRI (7.8MB). The
run-ning time of the jobs of a single service may thus be almost constant (a few minutes for each algorithm).
For each dataset, we also enabled different parallelism configurations, to study the impact of each of them on the execution, with respect to the execution system. In the first configuration (CSP), we enabled service parallelism only.
In the second one (CDP), only data parallelism was present.
And in a third one (CSP+DP), both data and service
paral-lelism were activated. Workflow paralparal-lelism was present in each of the configurations.
Because of the systems variability underlined before, set-ting a timeout value and a retry number is mandatory. For our experiment, we set the timeout value to 3000 seconds and allowed 3 retries.
6.2
Results.
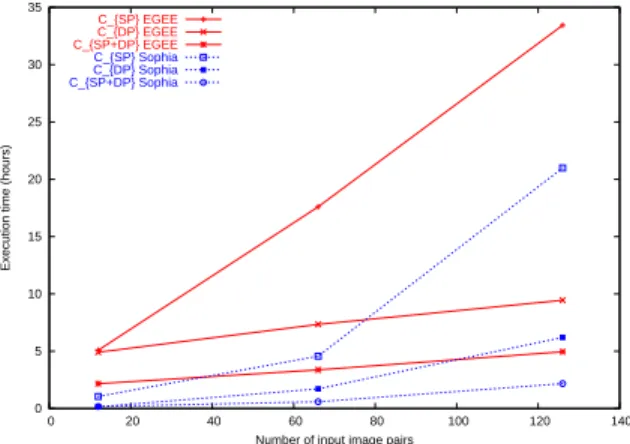
Figure 6 presents the evolution of the application exe-cution time with respect to the size of the input data set for each parallelism configuration and for the EGEE system and the Sophia cluster of Grid5000. A total number of 7350 jobs were submitted for this experiment.
6.3
Discussion
The first striking fact is that for a given configuration, the execution on the Sophia cluster of Grid5000 is always faster than on the EGEE system. Even for126 input image
pairs and in the CDPconfiguration, the execution on EGEE
was slower than on the Sophia cluster. This result means that we never reached the number of jobs from which the proportion of jobs to submit on the EGEE infrastructure is larger than the one to submit on the Sophia cluster.
0 5 10 15 20 25 30 35 0 20 40 60 80 100 120 140
Execution time (hours)
Number of input image pairs C_{SP} EGEE C_{DP} EGEE C_{SP+DP} EGEE C_{SP} Sophia C_{DP} Sophia C_{SP+DP} Sophia
Figure 6. Comparison on our application
The influence of data parallelism can be studied from configurations CSP and CSP+DP. On the Sophia cluster,
data parallelism respectively leads to a6.04, 7.74 and 9.46
speed-ups for 12, 66 and 126 image pairs. On the EGEE
infrastructure, corresponding speed-ups are 2.34, 5.22 and 6.76. It is interesting to notice that for every input data set
size, the speed-up introduced by data parallelism is higher on the Sophia cluster of Grid5000 than on the EGEE sys-tem, whereas this last system offers a number of CPUs highly superior to the one of the Sophia cluster. The rea-son that could explain it is the high variability of the over-head introduced by the EGEE platform, as already sug-gested in section 3.6: outlier jobs strongly penalize the whole application execution. This high variability of the overhead mainly comes from the load introduced by other users which are numerous on EGEE. To cope with this prob-lem, properly setting and dynamically adapting the timeout value and retry number of the jobs is part of our future work. The influence of service parallelism can be studied from configurations CDP and CSP+DP. On the Sophia cluster,
service parallelism respectively leads to a 0.86, 2.9 and 2.86 speed-up for 12, 66 and 126 input image pairs. On
the EGEE infrastructure, corresponding speed-ups are2.26, 2.17 and 1.90.
7. Conclusions
We compared the characteristics of Grid5000 clusters and EGEE infrastructures. Leading experiments on the workload management and the data management systems we experimentally determined parameters matching both systems behavior under load. This analysis shows that the job submission procedure introduces an important penalty on both systems, although they have different saturation lev-els. Distributing the workload management system would lead to a major improvement of the applications execution. For both workload and data management, variability is a
key parameter of production grid infrastructures. Variabil-ity is demonstrated in stress testing condition and it is also underlined by the impact of service parallelism on a real application execution.
We proposed a new multi-grids model based on our pa-rameterization of the infrastructures. It aims at optimizing the applications computing time by determining the propor-tion of jobs to submit on each system.
We finally presented the deployment of the same medical imaging application on the two systems through a unique workflow manager. Even on large input data sets, experi-ments done on this application could not exhibit a case for which execution was faster on the EGEE infrastructure than on the Sophia cluster of Grid5000.
This evaluation led to the total submission of 90, 000
jobs.
8. Acknowledgment
This work is partially funded by the French research program “ACI-Masse de donn´ees” (http://acimd.labri.fr/), AGIR project (http://www.aci-agir.org/). We are grateful to the EGEE European project and the French Grid’5000 pro-gram (https://www.grid5000.fr) for providing the grid in-frastructures and user assistance.
References
[1] N. Capit, G. Da Costa, Y. Georgiou, G. Huard, and C. Marti. A batch scheduler with high level components. In Cluster com-puting and Grid 2005 (CCGrid’05), 2005.
[2] E. Caron and F. Desprez. DIET: A Scalable Toolbox to Build Network Enabled Servers on the Grid. International Journal of High Performance Computing Applications, 2005. [3] T. Glatard, J. Montagnat, and X. Pennec. An optimized
work-flow enactor for data-intensive grid applications. Technical Report I3S/RR-2005-32-, I3S, Sophia-Antipolis, 2005. [4] T. Glatard, J. Montagnat, and X. Pennec. Probabilistic and
dy-namic optimization of job partitioning on a grid infrastructure. In Conf. on Parallel, Distributed and network-based Process-ing (PDP06), Montbliard-Sochaux, feb 2006.
[5] S. Nicolau, X. Pennec, L. Soler, and N. Ayache. Evalua-tion of a New 3D/2D RegistraEvalua-tion Criterion for Liver Radio-Frequencies Guided by Augmented Reality. In Intl Symp. on Surgery Simulation and Soft Tissue Modeling (IS4TM’03), vol-ume 2673 of LNCS, pages 270–283, Juan-les-Pins, 2003. [6] R. Sandberg, D. Goldberg, S. Kleiman, D. Walsh, and
B. Lyon. Design and Implementation of the Sun Network File System. In USENIX Conference, Berkeley, CA, 1985.