HAL Id: hal-03017737
https://hal-cnrs.archives-ouvertes.fr/hal-03017737
Submitted on 1 Dec 2020
HAL is a multi-disciplinary open access
archive for the deposit and dissemination of sci-entific research documents, whether they are pub-lished or not. The documents may come from teaching and research institutions in France or abroad, or from public or private research centers.
L’archive ouverte pluridisciplinaire HAL, est destinée au dépôt et à la diffusion de documents scientifiques de niveau recherche, publiés ou non, émanant des établissements d’enseignement et de recherche français ou étrangers, des laboratoires publics ou privés.
Hybridization of ellipsometry and energy loss spectra
from XPS for bandgap and optical constants
determination in SiON thin films
Joao Resende, David Fuard, Delphine Le Cunff, Jean-Herve Tortai, Bernard
Pelissier
To cite this version:
Joao Resende, David Fuard, Delphine Le Cunff, Jean-Herve Tortai, Bernard Pelissier. Hybridiza-tion of ellipsometry and energy loss spectra from XPS for bandgap and optical constants deter-mination in SiON thin films. Materials Chemistry and Physics, Elsevier, 2020, 259, pp.124000. �10.1016/j.matchemphys.2020.124000�. �hal-03017737�
1
Hybridization of Ellipsometry and Energy Loss Spectra from XPS for
bandgap and optical constants determination in SiON thin films
Joao Resende a, David Fuarda, Delphine Le Cunffb, Jean-Herve Tortaia and Bernard
Pelissiera
a Univ. Grenoble Alpes, CNRS, LTM, F-38000 Grenoble, France b ST Microelectronics, Crolles, France
Corresponding authors: Bernard Pelissier (bernard.pelissier@cea.fr)
1. Abstract
In this study, we first compare the bandgap determination methods in SiON thin films using two established techniques: Ellipsometry and the Energy Loss Spectrum from X-ray Photoelectron Spectroscopy. In the ellipsometry case, we modelled the optical properties using a single Tauc-Lorentz oscillator model, in a range from 1.5 to 6 eV, while for the XPS case, we used the threshold energy of the Energy Loss Spectrum from the O1s and N1s main core levels to determine the bandgap. We observed a consistent difference of the energy bandgap values obtained between the two methods, reaching up to 1.6 eV.
Therefore, we combined the ellipsometry and Energy Loss Spectrum from XPS measurements, creating a hybrid metrology method using a triple Tauc-Lorentz oscillator model. This methodology respected the optical relations of each technique and the complex dielectric constant of the material, creating an overlap of the two measurements between 3.5 and 6 eV. The combination method brings the advantage of a more robust determination of the bandgap in the SiO2-Si3N4 system, while creating a way to measure the refractive index and
2
2. Introduction
Ellipsometry and the energy loss spectrum (ELS) from X-ray photoelectron spectroscopy (XPS) are two techniques traditionally used to determine the bandgap (Eg) of thin films[1,2], as it is a fundamental parameter to understand the optical and electrical properties of different material. Other possible methods to measured bandgap energies are based on absorption spectroscopy[3], reflection electron energy loss spectroscopy (REELS)[4–6] or photoluminescence[7]. Ellipsometry is an optical technique based on the measurement of polarization (amplitude and phase) changes upon reflection or transmission of incident light on a planar sample[2]. This technique is commonly used to determine optical properties as the refractive index (n) and coefficient of extinction (k), roughness and thickness of thin films, by modelling the materials stack, in order to reproduce the experimental ellipsometry angles Ψ and Δ. The optical bandgap is then determined as a function of the model parameters or in direct relation with the coefficient of extinction. Nevertheless, ellipsometry has limitations to determine Eg as this parameter is highly dependent on the model chosen and on the accuracy of
the fit. Moreover, the bandgap must be in the measured energy range, commonly limited to 6-6.5 eV with standard ellipsometer[2] or up to 8 eV using IMPACT ellipsometer.
X-ray photoelectron spectroscopy is widely used for surface analysis, especially for the detection of elements and atomic bonds and the consequent quantification of elements up to 10 nm in depth[8]. Additionally, the use of the energy loss spectrum in certain elements core level can provide a method to determine the bandgap energy, in particular for dielectric materials[1]. The ELS signal is originated from the interactions of the photoelectron during the transport to the surface of the material[1], as the particle suffers inelastic energy losses caused by plasmons and electron-hole band transition excitations[9]. Therefore, the ELS part of the XPS has a direct relation with the electronic band structure, being dependent on the refractive index and the
3
extinction coefficient[10]. In the literature, the measurement of the bandgap is reported using the onset of ELS signal after the main peak of a certain element level[1]. The motivation for this method is based on the relation between the energy loss signal and the photoelectron emission from electrons with the same energy, as the difference between the top of the valence band and the conduction band, thus, the bandgap. This method is similar to what is used in reflection electron energy loss spectroscopy for the bandgap measurements[4–6]. However, the method presents some issues as the impact of the main peak width on the determination of the baseline, which leads to a general overestimation of Eg the value.
In the particular case of the SiO2-Si3N4 system, the bandgap of the material is an
important parameter to be determined as it can provide a direct information about the nitrogen content. Therefore, different studies report a variation of the bandgap in SiON thin films. In the case of pure silicon oxide, SiO2, the energy of the gap varies from 8.3eV measured by
ellipsometry[11], to 8.8 and 8.9eV measured by XPS-ELS[1,10] or REELS[5,12]. For pure silicon nitride, Si3N4, the bandgap energy is reported between 4.55 and 5.30 eV, measured by
reflectance and transmittance spectroscopy[13], 5.1eV by photoluminescence[7], between 4.7 and 5.3 eV by ellipsometry[14,15] and 5.3 eV by XPS-ELS[16]. For the intermixed phase of SiON, the value of the gap depends on the incorporation of nitrogen, ranging from 5.9 to 6.4 eV by reflectance and transmittance spectroscopy[17,18], 5.43 to 5.93 eV by ellipsometry[19] and 4.8 to 7.3 eV by XPS-ELS[20,21]. Thus, the different techniques used show a large variation range for the bandgap values.
In this study, we compare ellipsometry and XPS-ELS techniques for the measurement of the bandgap in SiON thin film. Moreover, we combine the two methods through a triple oscillator Tauc-Lorentz (TL) model to determine the bandgap and thickness of SiON thin films. The study comprehensively compares the bandgap energy values obtained by each technique individually as well as by the two-technique coupling method. Furthermore, the combination
4
model provides a method to determine the refractive index and the extinction coefficient between 1.5 and 30 eV, which corresponds to a wavelength variation from 40 nm to 840 nm.
3. Material and methods
Thin films growth
The growth of SiO2 and Si3N4 were conducted on 200mm Si (100) wafers, previously
cleaned using a Caro solution, a SC1 solution in a megasonic bath and a SC2 solution to eliminate the native SiO2 oxide. The SiO2 thin film was grown by thermal oxidation at 900 °C
for 54 minutes in an O2 and HCl rich atmosphere, aiming for a final thickness of 20 nm. The
Si3N4 was grown by Low Pressure Chemical Vapour Deposition (LPCVD) using ammonia
(NH3) and dichlorosilane (DCS) as gases in a 540/60 ratio at 725 °C for 24 minutes, aiming for
a final thickness of 20 nm. The three samples of SiON were prepared on 300mm Si (100) wafers, where a SiO2 thin film was growth by thermal oxidation followed by a thermal
nitridation at temperatures from 950 to 1150 °C of the SiO2 layer in an NO atmosphere, aiming
for a final thickness of 3.0 nm. The dosage of nitrogen incorporated was then controlled by the duration of the nitridation phase.
Characterization techniques
The ellipsometry measurements were performed using the ellipsometry chamber of IMPACT characterisation cluster. This chamber measures the ellipsometry angles of a sample at a fixed incidence angle (70°) with a VUV spectroscopic ellipsometer UVISEL2 from Horiba. The measured energy range was limited to 1.5-6 eV for validating the hybridization technique with ellipsometers installed commonly in microelectronics facilities. The scanning configurations of this phase modulated ellipsometers are an angle position of the analyser set at 45° and an angle of the modulator set at 0°. The raw measured parameters are Is and Ic, which are linked to ellipsometry angles Ψ and Δ, through the following expression[2]:
5
𝐼𝑠 = sin (2Ψ). sin (𝛥) 𝐼𝑐 = sin (2Ψ) cos (𝛥)
Ψ and Δ are related to the complex Fresnel reflection coefficients, rs and rp through the
expression[2]:
𝜌 =𝑟𝑝 𝑟𝑠
= 𝑡𝑎𝑛(Ψ)𝑒𝑖∆
Finally, the use of algorithms allows the modelling of the ellipsometry response based on the known stack, so, one can determine the optical indexes and thicknesses of the layers by inverse problem solving. Ellipsometry response is sensitive to the complete materials stack, from the substrate to the deposited layers. Conversely, the optical index determined by ellipsometry is also model dependant. The model developed here is described in the following section.
The XPS measurements were performed using two setups, the XPS chamber of the IMPACT cluster with a Theta 300 from Thermo Scientific and a VeraFlex II from Nova, both with an Al Kα1,2 (1486.6 eV) X-ray source in ultra-high vacuum conditions, 10-9 and 10-7 mbar
for the Theta 300 and the VeraFlex II, respectively. The surface of the samples was analysed without any previous ion sputtering cleaning process. The main peaks were analysed using a large energy interval to obtain the ELS signal: O1s between 520 and 580 eV, the N1s between 390 and 440 eV and Si2p between 90 and 150 eV with a step size of 0.1 eV. The determination of the bandgap was obtained by considering the baseline as the minimum value after the main peak and the linear onset at the beginning of the ELS signal. The energy range varied from 9 to 11.5 eV in the SiO2 and SiON cases, while for the Si3N4 case the energy range varied from 7.5
to 11.5eV. Additionally, the XPS analysis also allowed to determine the nitrogen content in the SiON layers, as well as to evaluate the thickness for these films, as they presented a thickness below 10nm. The thickness was measured by an automated algorithm method developed by
6
Truman et al[22], based on the attenuation of photoelectrons from the substrate after passing through the thin film.
Tauc-Lorentz Hybrid Model
As the objective of this study consists in measuring precisely the energy bandgap of SiON materials, the optical model used is a sum of Tauc-Lorentz (TL) oscillators that are mathematically defined using bandgap as parameter[23,24]. Conversely, once the optical index is accurate enough, the bandgap is directly measured without supplementary data treatment. This is an advantage contrarily to the XPS-ELS method of slope determination and threshold intersection that may generate systematic errors. Tauc-Lorentz model calculates the complex dielectric constant ε of a material.
𝜀 = 𝜀1+ 𝑖𝜀2
The imaginary part of the permittivity ε2 is defined here with a sum of three Lorentz oscillators with the relation:
𝜀2(𝐸) = {∑ 1 𝐸 𝐴𝑖 𝐸𝑖𝐶𝑖(𝐸 − 𝐸𝑔) 2 (𝐸2− 𝐸 𝑖2)2+ 𝐶𝑖2𝐸2 3 𝑖=1 𝑓𝑜𝑟 𝐸 > 𝐸𝑔 0 𝑓𝑜𝑟 𝐸 ≤ 𝐸𝑔
E is the energy of the light, Ei the centre of the Lorentz peak (eV), Ci the width of each
Lorentz oscillator i and Ai is a parameter that modulates the strength of the peak. For energies smallest than Eg, the imaginary part is set at zero.
The real part ε1 is calculated using the Kramers–Kronig transformation of ε2:
𝜀1(𝐸) = 𝜀1(0) +2 𝜋𝑃 ∫ 𝜉 𝜀2(𝜉) 𝜉2− 𝐸2 ∞ 𝐸𝑔 𝑑𝜉
7
The TL model intrinsically follows Kramers-Kronig relation leading to a solution that is physically relevant[24]. For one TL oscillator, five parameters are used: ε1(0), Eg, E0, C0 and
A0. Any added TL oscillator will increase the number of parameters by three: Ei. Ci and Ai. We
considered a triple TL oscillator model, as this is the minimum number of oscillators to approximate the broadband optical indices of SiO2 up to 30 eV, as previously reported by Pierce
and Spicer [25].
Finally, the optical index n and k of the material are obtained using the following relations: 𝑛2 =1 2(((𝜀1) 2+ (𝜀 2)2) 1 2+ 𝜀1) and 𝑘2 =1 2(((𝜀1) 2+ (𝜀 2)2) 1 2− 𝜀1)
Once the optical indices were obtained, the ellipsometry signatures (Is, Ic) can be modelled using existing Fresnel algorithm codes. Some inputs are required to model the ellipsometry response of the considered stack. At first, accurate broadband optical indices of the Si substrate as tabulated in Pierce and Spicer [25]. Then, the total number of layers deposited onto the substrate, in our case, only one deposited layer of SiON is considered. An initial guess of the thickness value of this layer is set as an initial condition. Meanwhile, the optical indices of the SiON layer are approximated using the TL model with initial guesses for the model parameters. Both thickness and parameters of the TL models are finally optimized during the inverse problem solving, in order to minimize the root mean square error between the modelled and the experimental signatures. Considering the simplest case of one TL oscillator, 6 parameters are fitted, as the thickness (e) is additionally required, therefore, e, ε1(0), Eg, E0, C0 and A0. The sampling of the ellipsometry scans is sufficiently high to prevent any under determination of the inverse problem solving, as the number of measured wavelength (Nellipso) is above 100.
8
The ELS measurements are modelled using the relation with the electronic band structure. ELS is directly dependent on the dielectric complex constant, and is calculated using the following expression[10]:
𝐸𝐿𝑆 = ℑ (−1 𝜀)
With ℑ the imaginary part operator. Considering n and k, we obtain:
𝐸𝐿𝑆 = 2𝑛𝑘 (𝑛2+ 𝑘2)2
Since the experimental ELS part of the XPS signal is normalized regarding the maximum peak of ELS, we introduced a form factor, α, to respect the agreement between the ellipsometry and XPS-ELS fit in the region of overlap of both tools (3.5 to 6.0eV). Therefore, the following equation will allow us to model the ELS response of the measured samples:
𝐸𝐿𝑆 = 𝛼 2𝑛𝑘 (𝑛2+ 𝑘2)2
Considering the three TL oscillators case, the modelling of the ELS requires 12 parameters (α, ε1(0), Eg, E1-3, C1-3, A1-3). Each ELS scan has a sampling NELS of 300 points, number sufficiently high to prevent any under determination during the inverse problem solving. Consequently, the fusion of XPS-ELS data and the ellipsometry signatures will accurately determine the bandgap energy of the unknown SiON thin film. The code we developed follows the flow chart presented in Figure 1.
9
Figure 1 Flow chart of the code for XPS-ELS and ellipsometry data hybridization
method
In the end, the hybrid model will be dependent on 13 parameters: a triplet of Ei, Ci and
Ai per each oscillator, ε1(0), the bandgap Eg, the thickness e of the film and the form factor α,
for the ELS normalized curve. The model was computed through Python numpy library.
4. Results and Discussion
The amount of nitrogen incorporated in the SiON thin films was quantified by XPS, showing an atomic nitrogen ratio (N/(N+O)) of 4.8%, 7.1% and 12.6% in the thin films. Additionally, the thicknesses of these thinner SiON thin films were also estimated by XPS showing values between 3.4 to 4.6 nm, presented in Table1. The Si3N4 sample showed a
detectable contamination of oxygen at the extreme surface due to the presence of carbon species, C-O and C=O bonds. The oxidation of the Si3N4 was undetected, as the Si2p core level
present a well-defined single peak at 101.95eV as expected for Si-N bond. Therefore, we consider the nitrogen ratio (N/(N+O)) of 100% in this thin film.
10
The measured ellipsometry parameters ∆ and ψ (1.5-6 eV energy range) are displayed on Figure 2a) and b), respectively, for the SiO2, SiON:7.1% and Si3N4 thin films. The
ellipsometry signatures of the other SiON:4.8% and SiON:12.6% samples are not pictured in the Figure 2a) and b) for visibility reason, as they are overlapped with the SiON:7.1% thin film. In the same figure, the ellipsometry signatures modelled using a single Tauc-Lorentz oscillator are represented by a line, while experimental data are pictured as dots. No significant differences between the modelled signatures and the experimental ones can be detected, proving the model shows a good agreement with the experimental data. Thus, the hypothesis of a homogeneous single layer deposited onto the substrate is realistic as any slight of inhomogeneity in the layer is negligible by ellipsometry. The thickness and bandgap values obtained from the single Tauc-Lorentz method are reported in Table 1 and the TL oscillator parameters are reported in Table 2. The ellipsometry model shows accurate thicknesses values, with an error of about 0.2nm. However, this modelling accuracy does not correspond to the trueness of the thickness, especially in ultra-thin films, due to correlation between optical indices and thickness. This implies the need for combination of different techniques to obtain an accurate thickness value. The single Tauc-Lorentz from the ellipsometry results also indicate a decreasing bandgap with the increase of nitrogen content, from 8.5 ± 0.1 eV to 4.6 ± 0.1 eV, from SiO2 to Si3N4. Furthermore, the thickness of the films confirms the deposition differences
between the extreme stoichiometry thin films, SiO2 and Si3N4, with a thickness of around 20nm
and the intermixed phases of SiON with a thickness between 2.8 and 3.0 nm.
The XPS-ELS experimental results of the all SiO2-Si3N4 thin films are presented in
Figure 2c). The SiO2 and SiON spectra are from the O1s core level centred at 533.2 eV, while
the Si3N4 spectrum is from the N1s core level centred at 398.7 eV, in agreement with N1s core
level previously reported[26]. Additionally, the XPS spectra of the SiON thin films showed the presence of the N1s peak, consistent with an N-Si bond centred at 398.7 eV. The bandgap
11
evolution determination from this method showed an energy decreasing with the increase of nitrogen incorporation, similar to the ellipsometry results, presented in Table 1 and reported previously in the literature. Nevertheless, the bandgap values are higher with the XPS-ELS than the ellipsometry method for the same sample. The energy bandgap in XPS-ELS for SiO2 is 8.97
± 0.02 eV, decreasing down to 5.72 ± 0.09 eV for the Si3N4. The two methods show an average
difference of 1.2 eV, reaching up to 1.6 eV for the SiON:12.6% thin film case. This variation between the two techniques has already been observed in the literature values, where the XPS-ELS bandgap[1,10] is always higher than the optical one measured by ellipsometry[11]. This energy shift between the two techniques is a direct consequence of the XPS-ELS determination method, as it is based on the interception of the baseline with the slope of the ELS above the bandgap. This interception method provides a systematically higher bandgap value than the real onset of the absorption in the material by considering the extension coefficient k.
12
Figure 2 Ellipsometry and ELS measurements a) ∆ represents the attenuation ratio and b) ψ represents the phase shift from 1.5 to 6 eV for the SiO2, SiON:7.1% and Si3N4 thin films. Scattered points denote the experimental data and the lines
denote the single oscillator Tauc-Lorentz model. c) XPS-ELS experimental data after the main peak for the SiO2-Si3N4 thin
films. All spectra represent the ELS after the O1s main core peak, except the Si3N4 where the N1s ELS is pictured. Red lines
represent the horizontal baseline and the linearization of the threshold energy from ELS. Red arrows show the energy value of the determined band-gap
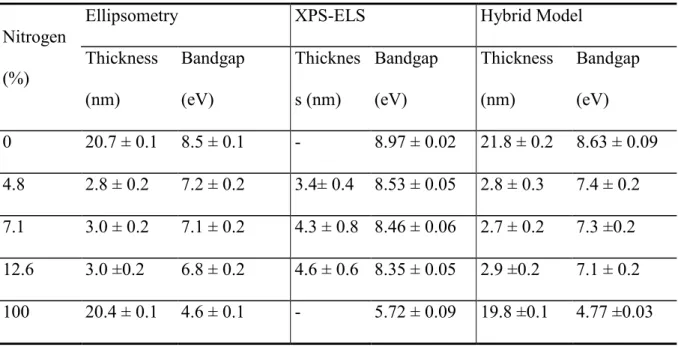
Table 1 Thickness and Band-gap values and associated errors determined by each technique separately, Ellipsometry and XPS-ELS, as well as the hybrid model for the SiO2-Si3N4 thin films
Nitrogen (%)
Ellipsometry XPS-ELS Hybrid Model Thickness (nm) Bandgap (eV) Thicknes s (nm) Bandgap (eV) Thickness (nm) Bandgap (eV) 0 20.7 ± 0.1 8.5 ± 0.1 - 8.97 ± 0.02 21.8 ± 0.2 8.63 ± 0.09 4.8 2.8 ± 0.2 7.2 ± 0.2 3.4± 0.4 8.53 ± 0.05 2.8 ± 0.3 7.4 ± 0.2 7.1 3.0 ± 0.2 7.1 ± 0.2 4.3 ± 0.8 8.46 ± 0.06 2.7 ± 0.2 7.3 ±0.2 12.6 3.0 ±0.2 6.8 ± 0.2 4.6 ± 0.6 8.35 ± 0.05 2.9 ±0.2 7.1 ± 0.2 100 20.4 ± 0.1 4.6 ± 0.1 - 5.72 ± 0.09 19.8 ±0.1 4.77 ±0.03
The data from the two techniques were then coupled and a triple Tauc-Lorentz oscillator model was used to simulate the optical properties and thickness of the SiON thin films. The ellipsometry data was considered using Is and Ic from a photon energy of 1.5 to 6.0 eV, while for the ELS-XPS we consider using the normalized energy loss spectra from 3.5 to 30 eV after the main core level peaks, O1s and N1s. Therefore, the model has an overlap from 3.5 to 6.0 eV for the two techniques. The equations used to optimize the triple Tauc-Lorentz were previously discussed, combining the Is, Ic and ELS dependence on dielectric complex constant, ε.
The fit of the model over the ellipsometry parameters, ψ and ∆, showed a similar agreement with the data as the simple Tauc-Lorentz model shown in Figure 2 a) and b). The fit of the model in the XPS-ELS part is shown in Figure 3 in solid lines, overlapped with the
13
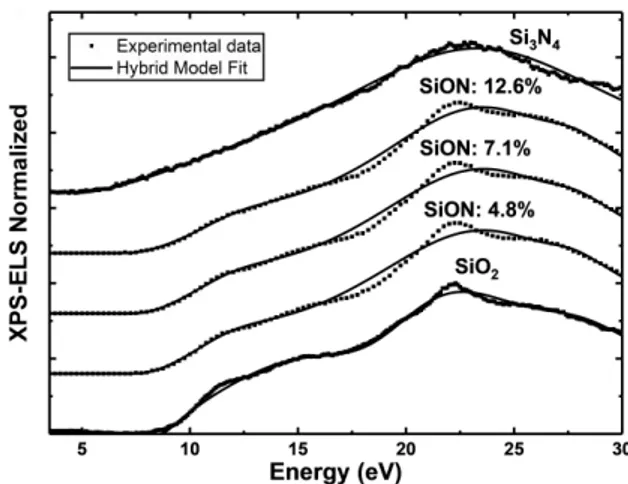
experimental data, represented in dots. The hybrid model reproduces the onset of energy after the bandgap energy, as well as the peaks visible in the ELS measurements.
Figure 3 XPS-ELS experimental and simulated data after the main peak for the SiO2-Si3N4 thin films. Scattered points
denote the experimental data and the lines denote the triple oscillator Tauc-Lorentz model that couples ellipsometry measurements the XPS-ELS data. All spectra represent the ELS after the O1s main core peak, except the Si3N4 where the N1s
ELS is pictured.
The bandgap energy of the three different methods, ellipsometry, XPS-ELS and hybrid model, are presented in Figure 4 and Table 1, for these SiON studied layers. On one hand, the graph shows consistent highest values of bandgap for the XPS-ELS analysis, as the method lacks in precision for the baseline determination, due to the influence of the main core-level peak width. On the other hand, the bandgap from ellipsometry shows the lowest values. One may notice that for four out of the five thin films measured, the bandgap energy value is above the energy limit of the technique of 6 eV. The Tauc-Lorentz model sets the imaginary component of the dielectric constant at zero up to the bandgap, so only the real part of the refractive index will be properly measured when ellipsometry is used alone.
The hybrid model provides bandgap energy values between the two separate techniques, but systematically closer to the ellipsometry values. The combination of the two techniques presents a good agreement with bandgap reference values in the literature: 8.3-8.9eV for the SiO2[1,5,10–12] and 4.5-5.3 eV in the Si3N4 case[13,14,16]. By coupling these two techniques,
14
reduction of dependency for the baseline determination and influence of the main peak width, in the ELS-XPS case, while for the ellipsometry input, the model provides a robust dependency of n and k at an energy region before the bandgap.
Figure 4 Bandgap energy dependency with the nitrogen content in SiO2-Si3N4 thin films. Comparison of each
technique separately (Ellipsometry and XPS-ELS) and the hybrid method for a triple oscillator Tauc-Lorentz model
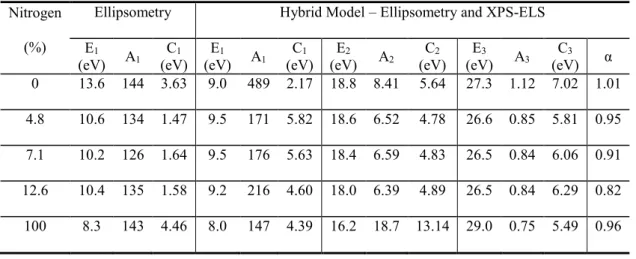
The Tauc-Lorentz parameters for the single oscillator used in the ellipsometry case and the triple oscillator model used for the hybrid case are reported in Table 2.
Table 2 Tauc-Lorentz parameters for the single and triple oscillator model used for ellipsometry and hybrid model, respectively
Nitrogen (%)
Ellipsometry Hybrid Model – Ellipsometry and XPS-ELS
E1 (eV) A1 C1 (eV) E1 (eV) A1 C1 (eV) E2 (eV) A2 C2 (eV) E3 (eV) A3 C3 (eV) α 0 13.6 144 3.63 9.0 489 2.17 18.8 8.41 5.64 27.3 1.12 7.02 1.01 4.8 10.6 134 1.47 9.5 171 5.82 18.6 6.52 4.78 26.6 0.85 5.81 0.95 7.1 10.2 126 1.64 9.5 176 5.63 18.4 6.59 4.83 26.5 0.84 6.06 0.91 12.6 10.4 135 1.58 9.2 216 4.60 18.0 6.39 4.89 26.5 0.84 6.29 0.82 100 8.3 143 4.46 8.0 147 4.39 16.2 18.7 13.14 29.0 0.75 5.49 0.96
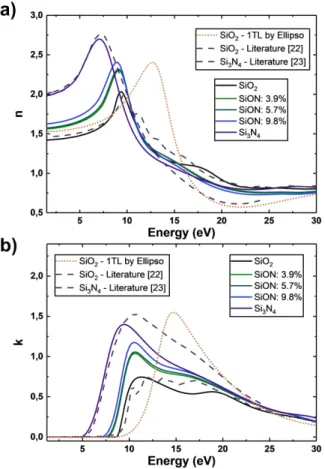
Moreover, the combination of the two techniques allows the determination of n and k, from 1.5 to 30 eV as pictured in the Figure 5. The modelled optical constants show a good agreement with the n and k references SiO2[27] and Si3N4[28]. We also pictured the n and k
15
only on the SiO2 thin film. The curve shows a large disparity with the SiO2 reference presented,
especially for the energy range above 7.5 eV, confirming the advantage of the hybrid model here proposed to determine optical properties above 6 eV. Moreover, the model proposes an n and k for SiON thin films, in a large range of energy, 1.5 to 30 eV or from 41 to 826 nm, covering a range from the Extreme-UV to the Near Infrared.
Figure 5 Modelled optical properties with the energy for the SiO2-Si3N4 thin films between 1.5 and 30 eV. a) Refractive
index, n, and b) coefficient of extension k. Literature curves of SiO2 and Si3N4 are represented with dashed lines. References:
SiO2[27] and Si3N4[28]
The values of refractive index show an increase with the nitrogen content in the visible region, from 1.8 to 3.2 eV, similar to previously reported[17,29], with the peak of n shifting to lower energy values with the higher amount of nitrogen. The sharp edge of the coefficient of extension shows a reduction with the amount of nitrogen, which reflects the reduction of bandgap. The maximum value of the k peaks increases with the nitrogen, while the position shifts to lower energies.
16
5. Conclusions
In conclusion, we compare two different methods for the determination of the bandgap: ellipsometry and ELS from XPS measurements. The bandgap energies in the SiO2-Si3N4 system
point out a large difference on energy value between the two techniques, up to 1.6 eV, due to the limitations of each method. The relation between the fundamental physics associated to these two different techniques led to the development of a hybrid method combining both, using a triple Tauc-Lorentz oscillator model. This results in robust determination of the bandgap energy value, as well as the optical constants n and k in a wide range from 1.5 to 30 eV.
The combination of ellipsometry and ELS from XPS showed a decrease of the bandgap energy with the increase of nitrogen incorporation, ranging from 8.63 ± 0.09 eV in the SiO2
case to 4.77 ± 0.03 eV for Si3N4. The results show an agreement with the literature for the SiO2
and Si3N4 cases, while establishing a way to determine n and k over a wide energy range for
SiON thin films.
This combination method insures a robust optical bandgap determination by overcoming systematic error of ellipsometry and XPS-ELS when used separately. Moreover, the method can be easily implemented in an industrial context as a standard for bandgap determination using two highly available techniques of microelectronics research and industry. The robust bandgap determination of different types of materials, from oxide to nitrides, from extreme thin films to bulk materials can then be addressed. Beyond these advantages, the technique is also a major asset for the determination of high bandgap materials, above 6.0 eV at the limit of the ellipsometric measurements range.
6. Conflicts of interest
17
7. Acknowledgements
This study was supported by the European ECSEL “MadeIn4” project (agreement No 826589) and partially by the EquipEx French Government program “IMPACT” (ANR-10-EQPX-33). The authors would like to thank Camille Petit-Etienne for the growth of the SiO2
and Si3N4 thin films.
8. References
[1] M.T. Nichols, W. Li, D. Pei, G.A. Antonelli, Q. Lin, S. Banna, Y. Nishi, J.L. Shohet, Measurement of bandgap energies in low-k organosilicates, J. Appl. Phys. 115 (2014) 1– 7. https://doi.org/10.1063/1.4867644.
[2] H.G. Tompkins, E.A. Irene, Handbook of Ellipsometry, 2005. https://doi.org/10.1515/arh-2005-0022.
[3] R. López, R. Gómez, Band-gap energy estimation from diffuse reflectance measurements on sol-gel and commercial TiO₂: A comparative study, J. Sol-Gel Sci. Technol. (2012). https://doi.org/10.1007/s10971-011-2582-9.
[4] T. Nagotomi, Z.J. Ding, R. Shimizu, Derivation of new energy-loss functions as applied to analysis of Si 2p XPS spectra, Surf. Sci. 359 (1996) 163–173. https://doi.org/10.1016/0039-6028(96)00366-4.
[5] S.W. King, B. French, E. Mays, Detection of defect states in low-k dielectrics using reflection electron energy loss spectroscopy, J. Appl. Phys. 113 (2013). https://doi.org/10.1063/1.4788980.
[6] D. Tahir, S. Tougaard, Electronic and optical properties of Cu, CuO and Cu₂O studied by electron spectroscopy, J. Phys. Condens. Matter. 24 (2012).
18
https://doi.org/10.1088/0953-8984/24/17/175002.
[7] L. Museur, A. Zerr, A. Kanaev, Photoluminescence and electronic transitions in cubic silicon nitride, Sci. Rep. (2016). https://doi.org/10.1038/srep18523.
[8] B.V. Crist, Handbook of Monochromatic XPS Spectra Volume 1, Elements. 1 (1999). [9] S. Miyazaki, H. Nishimura, M. Fukuda, L. Ley, J. Ristein, Structure and electronic states
of ultrathin SiO₂ thermally grown on Si(100) and Si(111) surfaces, Appl. Surf. Sci. (1997). https://doi.org/10.1016/S0169-4332(96)00805-7.
[10] T. Yamamoto, A. Ohta, M. Ikeda, K. Makihara, S. Miyazaki, Evaluation of Dielectric Function of Thermally-grown SiO₂ and GeO₂ from Energy Loss Signals for XPS Core-line Photoelectrons, ECS Trans. 75 (2016) 777–783. https://doi.org/10.1149/07508.0777ecst.
[11] G.L. Tan, M.F. Lemon, D.J. Jones, R.H. French, Optical properties and London dispersion interaction of amorphous and crystalline SiO₂ determined by vacuum ultraviolet spectroscopy and spectroscopic ellipsometry, Phys. Rev. B - Condens. Matter Mater. Phys. 72 (2005) 1–10. https://doi.org/10.1103/PhysRevB.72.205117.
[12] H. Jin, S.K. Oh, H.J. Kang, M.H. Cho, Band gap and band offsets for ultrathin (HfO₂)x (SiO₂)1-x dielectric films on Si (100), Appl. Phys. Lett. 89 (2006) 89–91. https://doi.org/10.1063/1.2355453.
[13] J. Bauer, Optical properties, band gap, and surface roughness of Si3N4, Phys. Status
Solidi. 411 (1977). https://doi.org/10.1002/pssa.2210390205.
[14] E. Vianello, F. Driussi, L. Perniola, G. Molas, J.P. Colonna, B. De Salvo, L. Selmi, Explanation of the charge-trapping properties of silicon nitride storage layers for NVM devices part I: Experimental evidences from physical and electrical characterizations, IEEE Trans. Electron Devices. 58 (2011) 2483–2489.
19
https://doi.org/10.1109/TED.2011.2140116.
[15] C.J. Krückel, A. Fülöp, P.A. Andrekson, V. Torres-Company, Bandgap engineering in nonlinear silicon nitride waveguides, in: 2017 Opt. Fiber Commun. Conf. Exhib. OFC 2017 - Proc., 2017.
[16] A. Iqbal, W.B. Jackson, C.C. Tsai, J.W. Allen, C.W. Bates, Electronic structure of silicon nitride and amorphous silicon/silicon nitride band offsets by electron spectroscopy, J. Appl. Phys. 61 (1987) 2947–2954. https://doi.org/10.1063/1.337842.
[17] F. Rebib, E. Tomasella, V. Micheli, C. Eypert, J. Cellier, N. Laidani, Effect of composition inhomogeneity in a-SiOxNy thin films on their optical properties, Opt.
Mater. (Amst). 31 (2009) 510–513. https://doi.org/10.1016/j.optmat.2007.10.025. [18] F. Rebib, E. Tomasella, J.P. Gaston, C. Eypert, J. Cellier, M. Jacquet, Determination of
optical properties of a-SiOxNy thin films by ellipsometric and UV-visible spectroscopies,
J. Phys. Conf. Ser. 100 (2008) 082033. https://doi.org/10.1088/1742-6596/100/8/082033.
[19] M. Modreanu, M. Gartner, N. Tomozeiu, J. Seekamp, P. Cosmin, Investigation on optical and microstructural properties of photoluminescent LPCVD SiOxNy thin films, Opt.
Mater. (Amst). 17 (2001) 145–148. https://doi.org/10.1016/S0925-3467(01)00038-6. [20] H.P. Ma, H.L. Lu, J.H. Yang, X.X. Li, T. Wang, W. Huang, G.J. Yuan, F.F. Komarov,
D.W. Zhang, Measurements of microstructural, chemical, optical, and electrical properties of silicon-oxygen-nitrogen films prepared by plasma-enhanced atomic layer deposition, Nanomaterials. 8 (2018). https://doi.org/10.3390/nano8121008.
[21] C.J. Yim, D.H. Ko, S.H. Park, W.J. Lee, M.H. Cho, Effect of incorporated nitrogen on the band alignment of ultrathin silicon-oxynitride films as a function of the plasma nitridation conditions, J. Korean Phys. Soc. 58 (2011) 1169–1173.
20
https://doi.org/10.3938/jkps.58.1169.
[22] J.K. Truman, E. Gurer, C.T. Larson, D. Reed, In-line compositional and thickness metrology using XPS for ultra-thin dielectric films, in: AIP Conf. Proc., 2005. https://doi.org/10.1063/1.2062945.
[23] G.E. Jellison Jr, F.A. Modine, Parameterization of the optical functions of amorphous materials in the interband region, Appl. Phys. Lett. 69 (1996) 371–373.
[24] H. Chen, W.Z. Shen, Perspectives in the characteristics and applications of tauc-lorentz dielectric function model, Eur. Phys. J. B. 43 (2005) 503–507. https://doi.org/10.1140/epjb/e2005-00083-9.
[25] D.T. Pierce, W.E. Spicer, Electronic Structure of Amorphous Si from Photoemission and Optical Studies, Phys. Rev. B. 5 (1972) 3017–3029. https://doi.org/10.1103/PhysRevB.5.3017.
[26] P.M. Sylenko, A.M. Shlapak, S.S. Petrovska, O.Y. Khyzhun, Y.M. Solonin, V. V. Atuchin, Direct nitridation synthesis and characterization of Si3N4 nanofibers, Res. Chem.
Intermed. (2015). https://doi.org/10.1007/s11164-015-2011-8.
[27] L. V. Rodríguez-de Marcos, J.I. Larruquert, J.A. Méndez, J.A. Aznárez, Self-consistent optical constants of SiO2 and Ta2O5 films, Opt. Mater. Express. 6 (2016) 3622.
https://doi.org/10.1364/ome.6.003622.
[28] H.R. Philipp, Silicon nitride (Si3N4) (noncrystalline), Handb. Opt. Constants Solids. 1
(1985) 771–774. https://doi.org/10.1016/B978-0-08-054721-3.50042-3.
[29] F. Rebib, E. Tomasella, M. Dubois, J. Cellier, T. Sauvage, M. Jacquet, Structural and optical investigations of SiOxNy thin films deposited by R.F. sputtering, Surf. Coatings