HAL Id: hal-02176599
https://hal.archives-ouvertes.fr/hal-02176599
Submitted on 8 Jul 2019
HAL is a multi-disciplinary open access
archive for the deposit and dissemination of
sci-entific research documents, whether they are
pub-lished or not. The documents may come from
teaching and research institutions in France or
abroad, or from public or private research centers.
L’archive ouverte pluridisciplinaire HAL, est
destinée au dépôt et à la diffusion de documents
scientifiques de niveau recherche, publiés ou non,
émanant des établissements d’enseignement et de
recherche français ou étrangers, des laboratoires
publics ou privés.
Building Typologies for Urban Fabric Classification:
Osaka and Marseille Case Studies
Joan Perez, Giovanni Fusco, Alessandro Araldi, Takashi Fuse
To cite this version:
Joan Perez, Giovanni Fusco, Alessandro Araldi, Takashi Fuse. Building Typologies for Urban Fabric
Classification: Osaka and Marseille Case Studies. International Conference on Spatial Analysis and
Modeling (SAM), Sep 2018, Tokyo, Japan. �hal-02176599�
Building Typologies for Urban Fabric Classification:
Osaka and Marseille Case Studies
Joan Perez
1, Giovanni Fusco
2, Alessandro Araldi
2,Takashi Fuse
1 1 The University of Tokyo, Regional Planning and Information Laboratory, Tokyo, Japan2
Université Côte-Azur, CNRS, ESPACE, Nice, France [email protected]
{alessandro.araldi,giovanni.fusco}@unice.fr [email protected]
Abstract.
Around the world, cultural and societal differences have a non-negligible impact on the way cities are built and especially on building’s physical shapes. In a transnational context, detailed expert knowledge is not always available, hence the need of identifying typologies of buildings. This paper presents the application of a Bayesian clustering protocol to buildings from two metropolitan areas located in countries with marked cultural and societal differences: Osaka-Kobe in Japan and Marseille-Provence in France. Six indicators related to building characteristics are calculated and used to perform the clustering: Footprint surface, Elongation, Convexity, Number of Adjoining Neighbors, Height and Specialization. Cluster results are then extracted, detailed and analyzed. The building families obtained through clustering show these two coastal metropolitan areas are made up of apparently similar “ingredients” (very similar typologies are found at the relatively coarse level of detail of our study), but with different weights. Small low-rise and massive high-rise as well as low-rise buildings are more common in Osaka-Kobe. Mid-sized and mid-rise buildings are more important in Marseille-Provence, where a distinctive class of adjoining mid-sized buildings is a common mark of traditional European cities. These preliminary results are a good entry point to lead to a better understanding of the link between building families, urban development periods and urban functions.
Keywords: Building · Classification · Clustering · Geoprocessing - Multiple
Fabric Assessment
Acknowledgements. This research was carried out thanks to a Grant-in-Aid
for Scientific Research from the Japan Society for the Promotion of Science (JSPS). This study is supported by Joint Research Program No. 774 at CSIS, UTokyo (Zmap TOWN II 2013/14 Shapefile Osaka prefecture).
1.
Introduction
In transnational contexts, urban spaces seem more and more similar from one country to another. In addition, urban sub-spaces can be more or less integrated into the world economy (Harvey, 2005), the latter acting as enhancer or inhibitor of urban dynamism. Since urban environments and globalization promote and maximise interactions, construction models can indeed be easily internationally transposed in this modern era of rapid changes. Yet, despites the existences of strong structural invariants that make what a global city essentially is; such
as elevated central business districts, peripheral industrial areas, central square locations, etc. the existence of local specificities both in urban morphologies and cities functioning can be striking. It appears that despites the increasing functional similarities of worldwide metropolitan cities (e.g. Sassen, 2005), urban planning appears to adopt more and more bottom-up perspectives (Batty 2005), a dynamic highlighting an increasing local apprehension of urban systems. Regardless of the recent urban planning trends, some spaces seem to be and to have always been hardly comparable between one another. Mention can be made of endless North-American single-family homes suburbs, walled medina quarters in North African cities, squared former colonial quarters in central Africa, poor suburbs made of large rent-controlled buildings (HLM) in France and Eastern Europe, etc. The fact that history, cultural and societal differences have a non-negligible impact on the way we build cities and on building’s characteristics is nothing new, especially in architecture and urban design studies. Yet, these disciplines are mostly focused at the scale of a given project: building, streets or neighborhoods, thus lacking of a deeper comprehension of the complexity of the urban forms within wider urban spaces.
This paper contributes to the wider research objective of identify typical urban fabrics in different metropolitan contexts, worldwide. Urban fabrics (Conzen 1969, Caniggia and Maffei 2008) are to be understood as typical arrangements of the components of the physical form of a city at a relatively fine grain of analysis (a street, an urban block, an urban fragment). A new geocomputational method, Multiple Fabric Assessment (MFA) has been proposed and first tested on the French Riviera Metropolitan area (Araldi and Fusco 2017). Geostatistical analysis of building types is an important phase of the MFA protocol, together with similar analyses of street network characteristics and building/street relations. In the French Riviera case study, building types are solely based on building footprint surface classes, linked to expert knowledge of the more or less strict correspondence of surface classes with building types in the study area.
In a transnational context this expert knowledge is not always available, hence the need of identifying typologies of buildings. This can for example be done through automatic segmentation of large datasets describing buildings in official standardized geographic databases. Building footprint surface should be seen as one of several descriptors of building types. The aim of this paper is precisely to offer a methodological solution to this problem and to test it on two real-world case studies, the coastal metropolitan areas of Osaka-Kobe (Japan) and Marseille-Provence (France).
The proposed method is using an extremely simplified morphological description of buildings and is producing a coarse classification of building types. At a later stage of the research, results are going to be used input of subsequent geostatistical treatment and combination with descriptors of street network and building/street relationships in order to identify typologies of urban fabrics. By using the same Bayesian clustering approach as Araldi and Fusco (2017), we will eventually show how a relatively a-spatial clustering of building types could be needed in order to implement the spatial clustering of urban fabrics of the MFA protocol.
However, the results of the building clustering at a metropolitan scale and in a transnational approach can have interests on their own. If some families are unique to predefined geographic contexts (specific case studies), then cultural and societal characteristics should be used to explain them. Identifying endemic building families can then be considered as a first step enabling questioning in a later stage the appearance of more globalized building types and their spatial distribution within the metropolitan space. Ultimately, this research should lead to a better understanding of the link between building families, urban development periods and urban functions.
The paper is organized as follows. First, the literature related to building and urban forms classifications in general is reviewed, with a peculiar focus on the use of data mining techniques such as multivariate classifications, automated segmentations, etc. A close attention is given to researches coming from urban geography, architecture and planning. Section 3 is the methodological section and presents the two case studies, the data sources and the indicator constitutions. Another sub-section presents the Bayesian segmentation protocol applied in this research. Section 4 introduces and details the building typologies identified in the two case studies. A final section concludes the paper through discussion and future work.
2.
Theoretical Form of Buildings and Urban Classifications
There is an impressive amount of academic work related to classifications of urban spaces and buildings using manual or automated techniques. Most of these researches come from, in order of frequency; architecture, urban geography and planning, archaeology and ethnology. As regards to theoretical forms, architecture is without surprises the leading discipline. Historically, sheltering against weather was the main element affecting the built forms with for example large roofs to provide larger shadows in warm locations, airtight structures in cold spaces, etc. Above this universally accepted fact, finding a favorably received theory about an archetype of building appears to be an impossible challenge. For instance, no consensus emerges perhaps due to the excessive wide range of schools, opinions and preferences that come into play when a matter such as building design is related to individual perception. Moreover, mechanization, technological innovations and new paradigms such as green construction are constantly multiplying and expanding the design possibilities; in return affecting everyday life (Giedion 1948). Local climates have for example less and less impacts upon building designs. Yet, design theory for building type has always been and remains a trendy topic in architecture. However, theories in literature seems organized into sub-categories such as families of building characteristics, design style in ethno-linguistic areas and historical periods, or directly on some sub-families of given building types (industrial, residential, schools, etc.).
The work of Cambridge Centre for Land Use and Built Form Studies published during the 60s and 70s on the factors influencing archetypal forms shall nonetheless not been overlooked since it inspired generation of architects and designers. In these researches, urban design was always correlated with town organization in order to, for example, access environmental performance (Martin and March 1972; etc.). Brown and Steadman (1991a; 1991b) analyzed the morphology of British housing using dimensional, functional and topological characteristics. Steadman et al., (2000) further extended these lines of works by extracting “primary forms” through a decomposition process of the city blocks, followed by a classification applied using the outputs of surveys performed on these primary forms. A recent book in two volumes sums up Steadman (2014) researches on both history of building types and on building forms cataloging. In order to reduce the scope of literatures only relevant to the objectives of this research, the following section will mostly focus on inductive automatic classifications. Indeed, researches using manual classifications such as supervised decision tree, are ruled out due to the lack of inductive thinking. Second, since this research is looking forward to the acquisition of a first classification, researches already possessing a benchmark about built forms and/or trying to further classify or hierarchize an existing benchmark are also excluded.
In urban geography, mention can be made of Haggag and Ayad (2002) that adopted an ecosystem approach to classify what they named ‘urban structural units’ in Alexandria, of the urban typo-morphology of city blocks using k-means segmentation and block and street physical characteristics as inputs (Gil et al. 2012), of “Spacematrix”; a method focusing on the identification of urban environment by using a set of four density indices (Berghauser-Pont and Haupt, 2010), etc. As are the aforementioned researches, urban geography work
related to typo-morphologies are usually performed at a larger scale than the building unit, with researches that mostly make use of city-blocks, pre-defined areas of aggregations, administrative perimeters, etc. In addition, a non-negligible part of these researches, although data-driven, are diverging from the standpoint of this research which was defined as a focus on physical features and characteristics of buildings. Indeed, numerous researches also make use of spatial, network or socio-demographic related data such as the identification of street patterns morphotypes in Oporto’s (Serra et al. 2013), the classification of Indian districts according to their urbanity degree (Fusco and Perez 2015), the clustering of census block groups to detect area under gentrification in New York (Royal and Wortmann 2015), etc.
Finally, and although slightly different from our research objectives, mention shall nonetheless be made of a few studies using automatic classification and building as scale of analysis. Hanna (2007) developed for example a method generating archetypal building layouts using different dimension-reduction and machine learning methods (PCA followed by SVM, neural networks, etc.) trained on real-world data of building layouts described through the eigenvectors and eigenvalues of space syntax axial graphs. Reffat (2008) investigated the physical specificities of the Saudi Arabia architecture using different clustering methods on a set of nine indicator families including external (façade, building form, etc.) and internal (structure, circulation, etc.) characteristics. Sokmenoglu et al., (2011) also used different data mining techniques on a set of inputs related to micro-scale building features (floors, room, etc.).
Unlike Stedman’s, these works rely on machine learning and/or on more classical clustering algorithms. Identifying building types becomes thus (at least partially) a computer-based automated process. Nevertheless, like Steadman’s works, they need detailed information on the building interior layout, roof coverage, façade, etc. often linked to cultural specificities of the case studies. They could thus not be applied to large-scale transnational analyses, covering the whole building stock of large metropolitan areas in different cultural contexts.
3.
Methodology
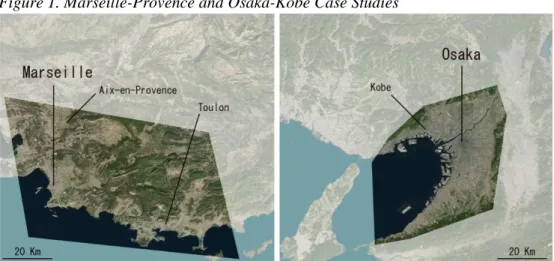
3.1 Case StudiesTo reach the objectives of this research, two emblematic coastal metropolitan areas located in countries with strong cultural and societal differences have been selected; Osaka-Kobe in Japan and Marseille-Provence in France. These areas are fast-evolving spaces characterized by a strong heterogeneity at the intra-urban level. Marseille-Provence and Osaka-Kobe selected areas of analysis (Fig.1: highlighted spaces) are respectively made of 4,300 km² for 3 million inhabitants (2013) and 2,500 km² for around 10 million inhabitants (2011).
Figure 1. Marseille-Provence and Osaka-Kobe Case Studies
The dichotomy mentioned in the first section between similar global cities and hardly comparable local spaces appears to be especially relevant for these two case studies. Indeed, everything seems to oppose these two spaces, from construction to socio-demographic and economic models. Here are a few examples; (1) Japanese cities in general are referred to as entities evolving within a post-growth economy and demography, while European cities are characterized by slow economic and demographic growth but not yet as in a “post-growth” stage. (2) The Japanese middle class is strong and well implemented all over the Osaka-Kobe metropolitan area while Marseille-Provence is considered as having the highest levels of inequality in France (OECD 2013). (3) Most of the time, buildings, city blocks and streets are renovated or rehabilitated in France while in Japan, whole city blocks and buildings are demolished to make way to new urban projects. (4) Within the Osaka-Kobe metropolitan area, strong density brings a space with three times the population and the building number of Marseille-Provence living on half of the surface. Moreover, no large natural spaces or green “holes” are found within the central space of Osaka-Kobe while Marseille-Provence are mostly composed of natural spaces and hills separating the main urban centers of the metropolitan area (Marseille, Toulon and Aix-en-Provence, see Figure 1). But, in the other hand, both metropolitan areas (1) sustained strong migrations waves during the 20th century; North Africans, Comorians, Armenians, etc. in the case of
Marseille-Provence; internal migrations related to rural exodus for Osaka-Kobe, (2) have a demographic growth that is nowadays slow and driven by the suburban areas and (3) are historically organized around a collection of multiple centers that grown together from multiple cores.
3.2 Data: Sources and Description
For both case studies, data about building coverage (GIS layers) have been made available through academic partnerships (see. Acknowledgments section) that led to the acquisition of the 2013/14 private Zmap-TOWN II for Osaka-Kobe (ZENRIN Residential Maps) and of the 2011 French BD TOPO® (French National Geographic Institute: IGN) for Marseille-Provence. In term of digitization, both layers are strictly similar and of high quality (small units of few m² are recorded in both cases). Both datasets possess several attribute data. Yet, as discussed below, only two attribute variables are used in this research, height and specialization. Once the GIS masks (Figure 1) are applied to filter the inputs selection, Osaka-Kobe and Marseille-Provence datasets are ultimately and respectively made of 3,457,515 and 915,964 input features.
3.3 Indicator Calculation
The following 6 indicators related to building features and characteristics have been calculated/gathered in both cases: building footprint surface, elongation, compactness,
number of adjoining neighbors, height and specialization. The first three are continuous variables; number of neighbors and height (expressed in number of building floors) are numeric discrete variables. Specialization is a qualitative variable.
Table 1. List of Selected/Calculated Indicators
Indicator Name Formula Abbrv. Unit Notes
Footprint Surface
Ground-floor surface of the
target building S m2 -
Elongation
Ratio between the building perimeter and the one of the circle of equivalent surface
E Ratio -
Convexity
Ratio between the building footprint surface and the area
of the minimal convex hull
C Ratio -
Number of Adjoining Neighbors
Count of the adjoining buildings with respect to the
target building Nb
Count -
Height
Eave height of buildings (France) or number of floors
(Japan)
H Meter / Floors
French eave heights have been transformed in
number of floors
Specialization - SPE Binary
Slightly different according to case study.
cf. text below
Together, they represent a kind of minimal description of building morphologies as made possible by official region-wide geographic databases, informing on a simplified 3D description of the building, and ignoring any details of style, façade, roof coverage and, above all, internal layout.
First, Footprint Surface (S) is the descriptor used in the first MFA analysis of urban fabrics (Araldi and Fusco 2017) and is of paramount importance in typo-morphological analysis. Second, “Elongation” (E) has been calculated to detect both blocks of residential flats (modern side-lit strips in Steadman 2000) but also some office premises and public buildings possessing peculiar structures. It should be noted that a low value of Elongation provides a measure of how the building departs from the most compact equivalent shape, the circle. Third, Convexity (C) provides information about the construction density (in terms of floor coverage) by comparing the building envelop to the building real constructed surface. A high value indicates tangled or holed structures while a low value indicated dense and compact buildings. By focusing on two different but complementary aspects, Elongation and Convexity describe together the compacity of the building footprint. “Number of Adjoining Neighbors” (Nb) informs on the typical relations of buildings to their neighbors, which play an essential role in building typology thus allowing distinguishing free-standing detached buildings, semi-detached buildings, row-houses, multiply-adjoining buildings, etc. Height (H) is the main descriptor of the vertical dimension of the building. Expressed in number of floors it becomes a discrete variable allowing the differentiation between low-rise, mid-rise and high-rise buildings. Eave height expressed in meters within the BD TOPO® has been transformed in number of equivalent floors while for the ZENRIN map, the number of floors is directly provided. Finally, literature on typo-morphological analysis (Caniggia and Maffei 2008) highlights how specialized buildings (industrial, commercial, public, etc.) have often different types than ordinary residential or mixed buildings. It is not our purpose to analyze the functions within each building, but just to differentiate the ordinary or specialized character of a building. This precise distinction is straightforward in the BD-TOPO for Marseille-Provence, while for Osaka-Kobe the distinction is made between what is purely residential and all the other categories (industrial, public, commercial, mixed, etc.), which is less appropriate from the point of view of our research.
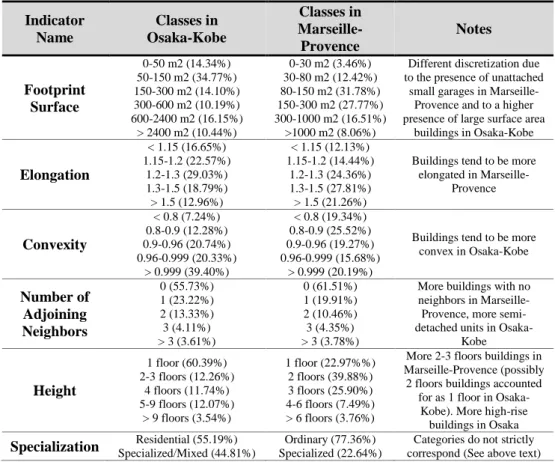
The clustering algorithm used within our research framework (see further) is particularly apt at mixing numeric and qualitative variables. Discretization of continuous (and sometimes even of discrete variables) is nevertheless necessary and allows the introduction of specific knowledge on the case studies, derived both from the observation of the statistical distribution of the variables, and from basic expert knowledge (Table 2).
Table 2. Discretization of the six indicators in Osaka-Kobe and Marseille-Provence.
Indicator Name Classes in Osaka-Kobe Classes in Marseille-Provence Notes Footprint Surface 0-50 m2 (14.34%) 50-150 m2 (34.77%) 150-300 m2 (14.10%) 300-600 m2 (10.19%) 600-2400 m2 (16.15%) > 2400 m2 (10.44%) 0-30 m2 (3.46%) 30-80 m2 (12.42%) 80-150 m2 (31.78%) 150-300 m2 (27.77%) 300-1000 m2 (16.51%) >1000 m2 (8.06%)
Different discretization due to the presence of unattached
small garages in Marseille-Provence and to a higher presence of large surface area
buildings in Osaka-Kobe Elongation < 1.15 (16.65%) 1.15-1.2 (22.57%) 1.2-1.3 (29.03%) 1.3-1.5 (18.79%) > 1.5 (12.96%) < 1.15 (12.13%) 1.15-1.2 (14.44%) 1.2-1.3 (24.36%) 1.3-1.5 (27.81%) > 1.5 (21.26%)
Buildings tend to be more elongated in Marseille-Provence Convexity < 0.8 (7.24%) 0.8-0.9 (12.28%) 0.9-0.96 (20.74%) 0.96-0.999 (20.33%) > 0.999 (39.40%) < 0.8 (19.34%) 0.8-0.9 (25.52%) 0.9-0.96 (19.27%) 0.96-0.999 (15.68%) > 0.999 (20.19%)
Buildings tend to be more convex in Osaka-Kobe Number of Adjoining Neighbors 0 (55.73%) 1 (23.22%) 2 (13.33%) 3 (4.11%) > 3 (3.61%) 0 (61.51%) 1 (19.91%) 2 (10.46%) 3 (4.35%) > 3 (3.78%)
More buildings with no neighbors in
Marseille-Provence, more semi-detached units in
Osaka-Kobe Height 1 floor (60.39%) 2-3 floors (12.26%) 4 floors (11.74%) 5-9 floors (12.07%) > 9 floors (3.54%) 1 floor (22.97%%) 2 floors (39.88%) 3 floors (25.90%) 4-6 floors (7.49%) > 6 floors (3.76%)
More 2-3 floors buildings in Marseille-Provence (possibly
2 floors buildings accounted for as 1 floor in
Osaka-Kobe). More high-rise buildings in Osaka
Specialization Specialized/Mixed (44.81%) Residential (55.19%) Specialized (22.64%) Ordinary (77.36%) correspond (See above text) Categories do not strictly
3.4 Segmentation Protocol: Bayesian Classifier
There are a lot of methods able to cluster instances into groups, from the most traditional ones such as hierarchical clustering, k-means, etc. to more sophisticated ones such as Bayesian network, neural network, etc. From our experience, Bayesian Networks have a non-negligible advantage since they can identify subsets of records presenting a precise pattern on a limited number of features whereas other methods usually look for homogeneous behavior of records on all features (Fusco and Perez, 2018). Bayesian clustering has also been applied successfully in several researches related to urban form (Shoultz et al., 2007; Perez and Fusco, 2014; Fusco 2016) and more precisely within the MFA protocol for the identification of urban fabrics (Araldi and Fusco 2017).
Another advantage of the Bayesian Networks is that all probabilities are defined on a finite probability space. Thus, it is possible to calculate the joint probability to sum all the parameters of the model i.e. all the marginal probability distributions (for the independent variables) and all the conditional probability distributions (for the dependent variables). On a set of variables 𝑥1, 𝑥2, … , 𝑥n the joint probability distribution is given by:
𝑃(𝑥
1, 𝑥
2, … , 𝑥
n) = ∏ 𝑃(𝑥
𝑖∣ ∏
𝑋𝑖) (1.0)
𝑛The most famous and used protocol for Bayesian clustering is an inductive algorithm proposed by Duda and Hart (1973) and called Naive Bayes or Bayesian Classifier. A network is built in a supervised manner between all the indicators and a newly implemented non-observable node that will play the role of a class variable. An oriented arc is thus found between the class variable and each individual indicator. In such networks, each indicator becomes independent of the value of every other indicator, hence the name “naïve”. Within the class variable, a probabilistic summary is stored for each class which is made by both the conditional probability tables of each indicator given the class and the probability of the class (Langley et al., 1992). These properties are computed through the naive Bayes Equation (2.0), directly derived from the joint probability distribution Equation (1.0):
𝑃(𝐶 ∣ 𝑥
1, 𝑥
2, … , 𝑥
𝑛) = 𝛽𝑃(𝐶) ∏ 𝑃( 𝑥
𝑖∣∣ 𝐶 ) (2.0)
𝑛𝑖=1
In the above Equation (Ruz and Pham, 2009), C is the class variable and the only vector for which the values are unknown. The conditional probability tables linking the class variable to each indicator are determined through an Expectation-Maximization algorithm (Dempster et al. 1977). These probabilistic parameters are recursively used to attribute each given record to a most probable cluster. Two different schemes can guide the EM algorithm. The easiest one consists in predetermining the number of clusters required, as in k-means clustering. The EM algorithm is here guided by likelihood maximization of the clustering model, given the data. By repeating the clustering algorithm for different number of clusters we can obtain a series of optimal solutions. A more computational intensive scheme consists in a random walk among all possible solutions considering different number of clusters. The EM algorithm will here be guided by a Minimal Description Length score (Rissanen 2007) combining clustering likelihood and a penalization factor for the number of clusters of the model (in order to avoid overfitting) and will result in a unique optimal solution.
Both methods are relatively robust to initialization since training instances order have little effect on the clustering results (Langley et al., 1992) but the random walk scheme needs a longer search sequence. The Naïve Bayesian classifier has been criticized for being blind to the values of the other indicators but it has also proven to be as competitive as more sophisticated models (e.g. Russell and Norvig, 2003; Langley et al., 1992).
4.
Results
The search for the best clustering followed both a random walk for the optimal cluster number and a deeper search within this class of solutions. These protocols have been applied for both case studies. The best solution was found at 8 classes for Marseille-Provence. For Osaka-Kobe, the size of the dataset suggested to limit the automatic search to the best possible solutions to 7, 8 and 9 clusters, respectively. In both cases, the records were weighted according to the footprint surface. Furthermore, a minimal number of inputs per cluster has been imposed so as each cluster should possess at least 4% of the dataset total footprint surface. By so doing, the kind of solution sought for was intentionally a limited set of broad families of building types, rather than a more accurate differentiation (for which more precise descriptors were missing). Within this paper we limited ourselves to briefly present preliminary clustering results for the two case studies, leaving a more detailed interpretation in terms of Bayesian probabilities for a later stage of the research.
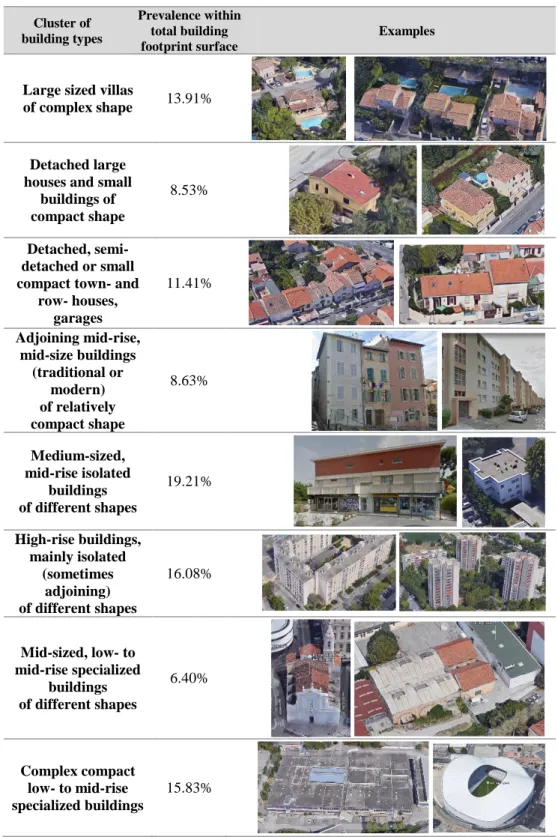
The best solution found for Marseille-Provence metropolitan area is made of 8 clusters of building types (Table 3). The contingency table fit of this clustering solution is relatively high (60.03%) thanks to the extremely informative role of the Surface indicator (60.04% of mutual information with the Class variable), as well as to the important contribution of variables Specialization (24.93%) and Height (14.44%).
The first three classes, accounting for roughly a third of the total building footprint surface in the study area, correspond to clusters of residential individual houses (large sized villas of complex shape, large compact houses, small houses and row-houses), with a few small compact buildings assimilated to large houses. A specific cluster of adjoining mid-rise compact buildings is to be found both in the traditional city-centers and in areas of more modern developments. Mid-rise isolated buildings make up 19.21% of the total built-up surface, slightly more than the cluster of high-rise buildings. The latter characterize many modern neighborhoods of social housing, but can also be found as mid- to high-rise adjoining buildings within more central areas.
Two final clusters group the specialized buildings. Mid-sized, low- to mid-rise buildings can have very different shapes, as they correspond to mid-sized stores, churches, workshops, small schools, etc. whose footprints are usually less than 1000 m2. Complex relatively compact low- to mid-rise specialized buildings group big factories, shopping malls, stadiums, warehouses, conference centers, etc. and, although few in number, account for almost 16% of the total built-up surface.
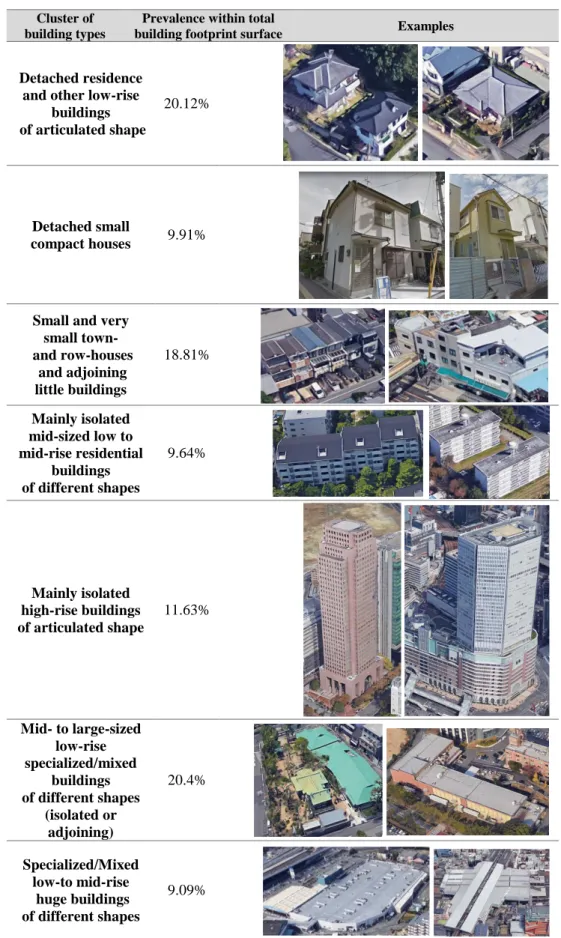
The best solution found for the Osaka-Kobe metropolitan area is made of 7 clusters of building types (Table 4), with a contingency table fit of 56,77% and a particularly important role of variables Surface (56.23% of mutual information), Number of Adjoining Neighbors (20.56%) and Specialization (15.33%). There is a striking correspondence between the cluster content of building types in the two case studies, with the notable exception of the lack of a cluster of adjoining mid-rise mid-sized buildings in Osaka-Kobe. This doesn’t mean that such buildings are completely absent in the Japanese metropolitan area, maybe there are too few of such to be recognized as an independent cluster with the 4% applied threshold. This building typology is at the heart of traditional European urbanization and is even produced in some modern areas of development.
Many small differences characterize the cluster contents in Marseille-Provence and Osaka-Kobe. For example, detached houses can be found in both case studies, but the separation between buildings can be extremely small (even less than 1 m in Osaka-Kobe), whereas it is of several meters in Marseille-Provence, both laterally and in the backyards. The most remarkable contrast is nevertheless the different weight of the corresponding building types in the two case studies. The presence of large villas/Japanese houses and town-houses is more important in Osaka-Kobe (20% and 19% vs. 14% and 11.4% in Marseille-Provence, respectively), confirming the importance of individual low-rise housing typical of Japanese urbanization. Medium-sized and mid-rise buildings are a more common feature in Marseille-Provence (19.2% vs 11.6%). High-rise buildings seem to be more common in the French case study (16% vs 11.6%); nevertheless high-rise starts at 7 floors in Marseille-Provence but at 10 in Osaka-Kobe (Table 2). It is also worth mentioning the extremely important presence of mid- to large-sized low-rise buildings in Osaka-Kobe (20.4% vs. 6.4%) and the fact that the class of the biggest buildings is defined using almost exclusively buildings of more than 2400 m2 of footprint surface (a size of buildings which is not specifically accounted for in Marseille-Provence) highlighting an important presence of modern complexes in Osaka-Kobe. Globally, high-rise and massive specialized or mixed buildings characterize Osaka-Kobe much more than Marseille-Provence.
Table 3. Clustering results for buildings in Marseille-Provence (France).
Cluster of building types Prevalence within total building footprint surface ExamplesLarge sized villas
of complex shape 13.91%
Detached large houses and small
buildings of compact shape
8.53%
Detached, semi-detached or small compact town- and
row- houses, garages 11.41% Adjoining mid-rise, mid-size buildings (traditional or modern) of relatively compact shape 8.63% Medium-sized, mid-rise isolated buildings of different shapes 19.21% High-rise buildings, mainly isolated (sometimes adjoining) of different shapes 16.08% Mid-sized, low- to mid-rise specialized buildings of different shapes 6.40% Complex compact low- to mid-rise specialized buildings 15.83%
Table 4. Clustering results for Osaka-Kobe (Japan).
Cluster of building types
Prevalence within total
building footprint surface Examples
Detached residence and other low-rise
buildings of articulated shape
20.12%
Detached small
compact houses 9.91%
Small and very small town- and row-houses and adjoining little buildings 18.81% Mainly isolated mid-sized low to mid-rise residential buildings of different shapes 9.64% Mainly isolated high-rise buildings of articulated shape 11.63% Mid- to large-sized low-rise specialized/mixed buildings of different shapes (isolated or adjoining) 20.4% Specialized/Mixed low-to mid-rise huge buildings of different shapes 9.09%
5.
Discussion and Future Work
The inferential bottom-up building typology carried out in this work remains a coarse one, whose goal was to identify broadly defined families of buildings in order to subsequently study their spatial distribution and contribute identifying urban fabrics and morphological regions (Conzen 1969). In today’s urbanized world, defining a city by its physical boundaries has become a very difficult task. Building families and the existence of cluster in specific areas only can provide useful insight to understanding the link between city functionalities and boundaries.
Detailed information on building internal layout, façades, functions and roof coverages are needed to arrive to more precise building typologies. Our approach is nevertheless appropriate for the automated processing of large building datasets having basic building description and covering large metropolitan areas. Bayesian clustering has the advantage of clustering buildings on the basis of a few shared characteristics, without forcing the similarity on all the morphological indicators. The transnational comparison between Marseille-Provence and Osaka-Kobe shows these two coastal metropolitan areas are made up of apparently similar “ingredients” (very similar typologies are found at the relatively coarse level of detail of our study), but with different weights. Small low-rise and massive high-rise as well as low-rise buildings are more common in Osaka-Kobe. Mid-sized and mid-rise buildings are more important in Marseille-Provence, where a distinctive class of adjoining mid-sized buildings is a common mark of traditional European cities.
The next step within our research will be to integrate the prevalence of these coarse building typologies within the MFA protocol, to identify typologies of urban fabrics based on building types, street network characteristics and building-street relations.
Future perspectives are also the analysis of building typologies on the same case studies over several decades, to study the evolution of types over time in connection to global trends in building practice and urban planning. Performing the clustering on other case studies with different specificities (vertical cities, slums, etc.) in different geographical context should also enrich the transnational comparison.
References.
Araldi A, Fusco G (2017) Decomposing and Recomposing Urban Fabric: The City from the Pedestrian Point of View, in O. Gervasi et al. (Eds.) Computational Science and Its Applications - ICCSA 2017, Proceedings, Part IV, Lecture Notes in Computer Science, vol 10407, p. 365-376.
Batty M (2005) Cities and Complexity: Understanding Cities with Cellular Automata, Agent-Based Models, and Fractals. The MIT Press, 592 p.
Berghauser Pont MY, Haupt, P (2010) SPACEMATRIX, Space, Density and Urban Form. Rotterdam: NAi Publishers, 279 p.
Brown FE, Steadman JP (1991a) The morphology of British housing: an empirical basis for policy and research. Part 1: functional and dimensional characteristics, Environment and Planning B: Planning and Design, 18, pp. 277-299.
Brown FE, Steadman JP (1991b) The morphology of British housing: an empirical basis for policy and research. Part 2: topological characteristics, Environment and Planning B: Planning and Design, 18, pp. 385-415.
Caniggia G, Maffei, GL (2008) Lettura dell'edilizia di base. Alinea (second ed.), Florence. Conzen MRG (1969) Alnwick, Northumberland: a study in town-plan analysis. Institute of
British Geographers Publication 27 (second edition). London
Dempster AP, Laird NM, Rubin DB (1977) Maximum Likelihood from Incomplete Data via the EM Algorithm. Journal of the Royal Statistical Society, Series B. 39 (1): 1–38
Duda RO, Hart PE (1973) Pattern classification and scene analysis. New York, NY: John Wiley & Sons.
Fusco G, Perez J (2015) Spatial Analysis of the Indian Subcontinent: the Complexity Investigated through Neural Networks, CUPUM 2015 Proceedings, Paper 287.
Fusco G (2016) Beyond the Built-up Form / Mobility Relationship: Spatial Affordance and Lifestyles, Computer Environment and Urban Systems, 60, p. 50-66
Fusco G, Perez J (2018) Bayesian, SOM and Hierarchical Clustering under the Test of Indian Districts, Submitted, 22 p.
Giedion S (1948) Mechanization Takes Command, A Contribution to Anonymous History. Oxford University Press
Gil J, Beirao JN, Montenegro N, Duarte J (2012) On the discovery of urban typologies: Data mining the many dimensions of urban form, Urban morphology, 16(1), 27 p.
Haggag MA, Ayad HM (2002) The urban structural units method: a basis for evaluating environmental prospects for sustainable development, Urban Design Int., 7, pp. 97-108. Hanna S (2007) Automated Representation of Style by Feature Space Archetypes:
Distinguishing Spatial Styles from Generative Rule, International Journal of Architectural Computing, 5, pp. 2-23.
Harvey D (2005) Spaces of neoliberalization: towards a theory of uneven geographical development. Franz Steiner Publication.
Langley P, Iba W, Thompson K. (1992) An Analysis of Bayesian Classifiers, Proceedings of the Tenth National Conference on Artificial Intelligence, San Jose, pp. 223-238. Martin L, March L (1972) Urban Space and Structures. Cambridge University Press, 282 p. OECD (2013) Vers une croissance plus inclusive de la métropole Aix-Marseille : Une
perspective internationale. OECD report, 221 p.
Pearl J (1985) Bayesian networks: A model of self-activated memory for evidential reasoning, Proceedings of the 7th Conference of the Cognitive Science Society, University of California, pp. 329-334.
Perez J, Fusco G. (2014) Inde rurale, Inde urbaine: qualification et quantification de l’aptitude au changement des territoires indiens. Conference proceedings: At the Frontiers of Urban Space, Vol: Small towns of the world: emergence, growth, economic and social role, territorial integration, governance, Avignon, pp. 316-339.
Reffat R (2008) Investigating Patterns of Contemporary Architecture using Data Mining Techniques, 26th eCAADe Proceedings, pp. 601-608.
Rissanen J (2007) Information and Complexity in Statistical Modeling. Springer.
Royall RA, Wortmann T (2015) Finding the State Space of Urban Regeneration: Modeling Gentrification as a Probabilistic Process using k-Means Clustering and Markov Models, CUPUM 2015 Proceedings, Paper 275.
Russell SJ Norvig P (2003) Artificial Intelligence: A Modern Approach. Prentice Hall (2nd ed), 1080 p.
Ruz GA, Pham DT (2009) Building Bayesian network classifiers through a Bayesian complexity monitoring system, proceedings of IMechE, 223(C3), 2009, pp. 743-755. Sassen S (2005) The global city: introducing a concept, Brown Journal of World Affairs, 11
(2), pp. 27-43.
Serra M, Lopes Gil JA, Pinho P. (2013) Unsupervised classification of evolving metropolitan street patterns, Proceedings of Ninth International Space Syntax Symposium, Paper 46. Sokmenoglu A, Cagdas G, Sariyildiz S (2011) Application of Data Mining in Micro-scale
Urban Feature Analysis, Proceedings of GeoComputation 2011, pp. 154-160.
Shoultz G, Givens J, Drane W (2007) Urban Form, Heart Disease, and Geography: A Case Study in Composite Index Formation and Bayesian Spatial Modeling, Population Research and Policy Review, 26(5-6), pp. 661-685.
Steadman P, Bruhns HR, Holtier S, Gakovic B (2000) A classification of built forms, Environment and Planning B: Planning and Design, volume 27, pp. 73-91.