HAL Id: hal-01150946
https://hal.inria.fr/hal-01150946
Submitted on 21 May 2015
HAL is a multi-disciplinary open access
archive for the deposit and dissemination of
sci-entific research documents, whether they are
pub-lished or not. The documents may come from
teaching and research institutions in France or
abroad, or from public or private research centers.
L’archive ouverte pluridisciplinaire HAL, est
destinée au dépôt et à la diffusion de documents
scientifiques de niveau recherche, publiés ou non,
émanant des établissements d’enseignement et de
recherche français ou étrangers, des laboratoires
publics ou privés.
Graph-Based Inferences in a Semantic Web Server for
the Cartography of Competencies in a Telecom Valley
Fabien Gandon, Olivier Corby, Alain Giboin, Nicolas Gronnier, Cecile Guigard
To cite this version:
Fabien Gandon, Olivier Corby, Alain Giboin, Nicolas Gronnier, Cecile Guigard. Graph-Based
In-ferences in a Semantic Web Server for the Cartography of Competencies in a Telecom Valley. 4th
International Semantic Web Conference, ISWC 2005, Galway University, DERI, Nov 2005, Galway,
Ireland. pp.15. �hal-01150946�
Graph-based inferences in a Semantic Web Server for the
Cartography of Competencies in a Telecom Valley
Fabien Gandon, Olivier Corby, Alain Giboin, Nicolas Gronnier, Cecile Guigard INRIA, ACACIA, 2004 rt des Luciole, BP93, 06902 Sophia Antipolis, France
Fabien.Gandon@sophia.inria.fr http://www-sop.inria.fr/acacia/
Abstract. We introduce an experience in building a public semantic web server
maintaining annotations about the actors of a Telecom Valley, i.e. a concentra-tion of high tech businesses and instituconcentra-tions of Telecoms. We then focus one in-ference used in building one type of cartography of the competences of these economic actors. We detail how it exploits the graph model of the semantic web using ontology-based metrics and conceptual clustering. We prove its characteristics and we give the associated interpretations.
1 Semantic Annotation of Competencies
In knowledge-based solutions, user interfaces have the tricky role of bridging the gap between complex knowledge representations underlying collective applications and focused views tuned to day-to-day uses. For this reason, we believe that interface design and knowledge representation must be tackled in parallel. In this paper, we describe and analyze an experience in simulating the inferences done by economists and management researchers in building a cartography of the competences of the economic actors of a region. The implementation is now part of a public semantic web server maintaining annotations about the actors of a telecom valley. This paper explains how we designed such an interface using ontology-based metrics defined above the graph structure of the semantic web annotations statements, but before we go in such details we need to introduce the overall project: the Knowledge manage-ment Platform (KmP1) of the Telecom Valley of Sophia Antipolis2.
The goal of KmP was the elaboration of a public repository supporting three appli-cation scenarios: (1) promoting the Scientific Park of Sophia Antipolis and its inter-national development by providing the local institutions with a pertinent and up-to-date snapshot of the park; (2) facilitating partnerships between different industrial firms of the park; (3) facilitating collaboration on projects between industrial partners and the different research institutes. The steering committee is composed of eleven pilot companies involved in the specifications of the application and the population of
1 http://www-sop.inria.fr/acacia/soft/kmp.html 2 http://www.sophia-antipolis.org/index1.htm
the ontologies: Amadeus, Philips Semiconductors, France Telecom, Hewlett Packard, IBM, Atos Origin, Transiciel, Elan IT, Qwam System and Cross Systems.
KmP is a real world experiment on the design and usages of a customizable se-mantic web server to generate up-to-date views of the Telecom Valley and assist the management of competencies at the level of the organizations (companies, research institute and labs, clubs, associations, government agencies, schools and universities, etc.). This platform aims at increasing the portfolio of competences of the technologi-cal pole of Sophia Antipolis by implementing a public knowledge management solu-tion at the scale of the Telecom Valley based on a shared repository and a common language to describe and compare the needs and the resources of all the organiza-tions. It resulted in a portal3 that relies on a semantic web server publicly available for
all the actors of the value chain of the Telecom Valley of Sophia Antipolis.
Ontologies were built from models provided by domain experts [7] and end-users: models of competencies, models of the telecom domains (networks, computer sci-ence, etc.), task models, value chain of the telecom valley, etc. The implementation merges the frameworks of the semantic web (RDF, RDFS), the classic web (HTML, CSS, SVG) and the structured web (XML, XSLT) to integrate data coming from very different sources, allow queries from different viewpoints, adapt content to users, analyze, group, infer and render indicators of the Telecom Valley situation. KMP relies on the integration of multiple components: databases for back-end persistence, web servers with JSP and servlets to provide front ends, and the CORESE semantic web server [2] to provide semantic web processing capabilities. Databases are used to store the different ontologies (e.g. ontology of technologies, of actions, of deliver-ables, of markets, of cooperation, etc.), the models (e.g. value chain of a telecom valley), and the users' data (e.g. descriptions of firms, research centers, competences, projects, etc.). Direct accesses and modifications of ontologies and other data are managed directly at the database level. Wrappers extract the relevant and authorized data from the databases and export them in RDF/S to feed CORESE as needed.
The platform integrates contributions coming from the whole Telecom Valley: • several ontologies are populated and validated by multiple actors using interviews
and brainstorming sessions animated by the local government administration4.
• several sources of data are integrated: models provided by practitioners and re-searchers in management, descriptions of firms using industrial and economic mar-kets vocabulary, description of research institutes using academic terms, etc.
The whole system relies on RDF/S and production rules [2] to describe the models and actors of the Telecom Valley. Exploiting this semantics the platform is able to: • apply rules to enrich the different contributions and bridge the different viewpoints
allowing a broad variety of queries and analysis to be run e.g. a set of rules general-ize and group identical competences detailed in the profiles of the actors to provide statistics to researchers in management;
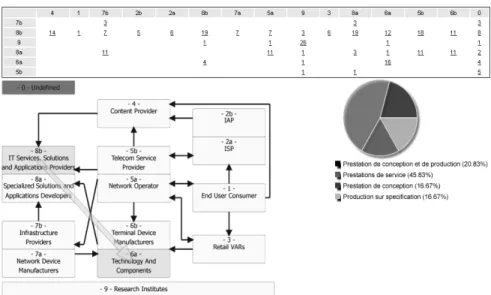
• exploit underlying models to propose graphic views of the Telecom Valley using XSLT to produce SVG rendering and combining on-the-fly models defined by the economists with data entered by the different actors; e.g. figure 1 shows an SVG
3 http://beghin.inria.fr/
interface to browse the value chain of the Telecom Valley and obtain statistics on the exchanges by clicking on the arrows. To each arrow is attached a query that CORESE solves against the RDF/S annotations of the Telecom Valley. For instance the screenshots shows statistics on the exchanges between two segments of the value chain (8b and 6a) and the distribution of these exchanges over the disjoint sub-classes of exchanges;
• apply complex query constructors to find partners, build consortiums, extract indi-cators, build statistics, sort and group results, find approximate answers, etc.; • apply clustering algorithms and produce graphic representations in SVG to allow
institutional and industrial actors to get abstract views of the cartography of compe-tences in the Telecom Valley.
Fig. 1. SVG view of exchanges on the value chain of the Telecom Valley of Sophia Antipolis
In this paper we focus on this last point. It is an inference supported by the graph models underlying this semantic web repository: an ontology-based conceptual clus-tering providing a customizable and up-to-date cartography of competences available in the telecom valley. Section 2 briefly introduces an extract of the domain models and the users' requirements. Section 3 details the inferences underlying this represen-tation, in particular the ontology-based metrics exploiting the semantic web graph structures. Section 4 concludes with the evaluation of this representation.
2 Model-based Automated Cartography of Competencies
The first requirement and scenario of KmP is "to acquire and give a broader visibility
of the community of the technological pole". As part of its answers, the platform
pro-vides a dynamic up-to-date cartography of the competencies available in the techno-logical park and grouped in clusters.
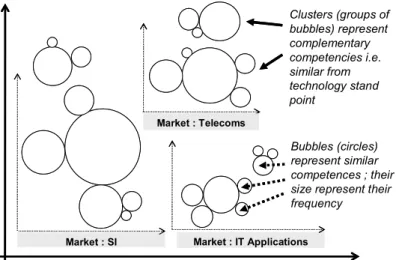
In KmP, the overall design methodology was oriented toward use and users. We relied on participatory design involving end-users, domain experts, information man-agement experts and knowledge modeling experts. A large part of the specifications relied on mock-ups of interfaces built from the visual representations the users are used to. In particular, figure 2 shows a draft made by users when making explicit their notion of competences; it shows what they called a "readable representation of the
clusters of competencies in the technological pole".
The first consequence of such a readability requirement is a set of expressivity re-quirements on the ontology. The current model used in the project relies on an ontol-ogy that consists of more than a thousand concept types and a hundred relations. Central to the modeling is the concept of "competence" used by the organizations when describing their profiles or the profile of the partners they are looking for. The model proposed by researchers in management and economics [7] uses four facets to describe a competence and each facet is formalized in a part of the ontology. For instance, the competence "designing microchips for the 3G mobile market using
GSM, GPRS and UMTS" is decomposed into four elements: an action (design); a deliverable (microchip); a market (3G mobile technology); a set of resources (GSM,
GPRS, UMTS).
Market : SI Market : IT Applications
Clusters (groups of bubbles) represent complementary competencies i.e. similar from technology stand point Bubbles (circles) represent similar competences ; their size represent their frequency
Market : Telecoms
Market : SI Market : IT Applications
Clusters (groups of bubbles) represent complementary competencies i.e. similar from technology stand point Bubbles (circles) represent similar competences ; their size represent their frequency
Market : Telecoms
Fig. 2. Draft of a representation of clusters of competences
The second consequence of the readability requirement is the need to simulate the inferences mobilized by the users when building this representation. The branch or the level of the ontology used to describe the situation is not always the same as the
one used to display inference results. For instance, different users (e.g. industrialists vs. economists) may enter and use knowledge at different levels. In simple cases, we use rules close to Horn clauses to bridge these gaps. For the inferences behind the representation in Figure 2, the algorithm is much more complex and is a matter of conceptual clustering usually performed by economy and management analysts: 1. Analysts chose a market to which the analysis will be limited; all sub-types of this
market will be considered, all ancestors or siblings will be discarded.
2. In this market, analysts group competences according to the similarity of their resources; a competence may have several resources (e.g. java, c, c++, project management) and one is chosen as the most representative (e.g. programming). This first grouping represents a cluster.
3. In each cluster, analysts group competences according to the similarity of their action (e.g. design) to form bubbles.
On the one hand we use ontology-based modeling to provide meaningful and dy-namic representations (clusters as core competences of the technological pole) and on the other hand we need ontology-based inferences to automate this clustering (clus-ters as emergent structures in knowledge analysis). Questions associated to this prob-lem include: what are the inferences underlying this representation? How can they be linked to semantic web models of the Telecom Valley? How can we ensure that the clustering will be meaningful to the users?
In literature, the work on the formal side of the semantic web is largely influenced by the fact that logic-based languages are the most frequently used implementation formalisms. However, entailment is not the only product one should expect from a knowledge-based system, and the conceptual structures of the semantic Web can support a broad variety of inferences that goes far beyond logical deduction even in its simplest forms (RDF/S). Let us take the example of the class hierarchy which is considered to be the backbone of the RDFS schemata. The interpretation of the sub-sumption link is that the extension of a concept type (e.g. laptop) is a subset of the extension of another concept type (e.g. computer). What this logical implication hides is a graph structure that links the concept types through their genus and differentia. The graph structure of the semantic web formalisms supports inferences that go far beyond the set inclusion. The rest of this article shows how we designed such infer-ences to recreate the representation drafted in Figure 2 and how this specific example illustrates the richness of the underlying graph model of the semantic web.
3 Semantic Metrics to Visualize Knowledge
3.1 Semantic Metrics on the Ontological SpaceThe idea of evaluating conceptual relatedness from semantic networks representation dates back to the early works on simulating the humans’ semantic memory [8] [1]. Relatedness of two concepts can take many forms for instance, functional comple-mentarity (e.g. nail and hammer) or functional similarity (e.g. hammer and screw-driver). The latter example belongs to the family of semantic similarities where the relatedness of concepts is based on the definitional features they share (e.g. both the
hammer and the screwdriver are hand tools). The natural structure supporting seman-tic similarities reasoning is the concept type hierarchy where subsumption links group types according to the characteristic they share. When applied to a concept type hier-archy, the relatedness calculated by a spreading algorithm gives a form of semantic distance e.g. the early system of [9] defined a distance counting the minimum number of edges between two types.
We can identify two main trends in defining a semantic distance over a type hier-archy: (1) the approaches that include additional external information in the distance, e.g. statistics on the use of a concept [10] [6] (2) the approaches trying to rely solely on the structure of the hierarchy to tune the behavior of the distances e.g. [9][12]. Including external information implies additional costs to acquire relevant and up-to-date information and furthermore, this information has to be available. Thus in a first approach we followed the second trend.
In the domain of Conceptual Graphs [11], where the graph structure of knowledge representation is a core feature, a use for such a distance is to propose a non binary projection, i.e. a similarity S:C²→[0,1] where 1 is the perfect match and 0 the abso-lute mismatch. We used the CORESE platform provided by [2] to build our system. It is provided with an implementation of a depth-attenuated distance allowing approxi-mate search. The distance between a concept and its father is given in (1):
)) ( ( 2 1 )) ( , ( t father depth t father t dist = (1)
where depth(t) is the depth of t in the ontology i.e. the number of edges on the short-est path from t to the root. In the rshort-est of the article we will only consider tree struc-tures (not lattices in general) and therefore there will be one and only one directed path between a concept and one of its ancestors; thus the distance is:
1 ) ( 1 ) ( 2 )) , ( ( 2 1 1 2 1 2 2 1 2 1 2 1 ) ,
(t t = depthLCSTt t − − deptht − − deptht −
dist (2)
where LCST(t1,t2) is the least common supertype of the two concept types t1 and t2.
3.2 Ontological Granularity & Detail Level
The representation in Figure 2 shows that the way market analysts usually group the competences correspond to what is called a monothetic clustering algorithm, i.e. the different features of the competence are not combined in one distance but considered sequentially: first they chose the market sector they will limit their analysis to; second they chose the level of detail at which the competences are to be grouped based on the resources they mobilize and form clusters; finally they chose a level of detail for the actions and in each of the clusters previously obtained they group competences by types of actions to form bubbles in the clusters.
Limiting the competences to a given market sector is directly done by using the graph projection algorithm provided by CORESE: when one projects a query graph with a given market sector, by subsumption, only those competences with this market
sector or a subtype of it will be retrieved. However the two other features (resources and action) require the ability to cluster competencies and to control the level of detail of this clustering. The field of Data Clustering [5] studied this problem in great detail and the typical structure built to control clustering details is a dendrogram: cutting a dendrogram at a given height provides a clustering at a corresponding granularity.
We already have a tree structure (the hierarchy of concepts) and a similarity meas-ure (semantic similarities). However, the construction of a dendrogram relies on an ultrametric and the similarity measure defined between the classes does not comply with the definition of an ultrametric. Indeed, an ultrametric is a metric which satisfies a strengthened version of the triangle inequality:
dist(t1,t2) ≤ max(dist(t1,t'), dist(t2,t')) for any t'
Figure 3 gives a counter example where the distance defined in (2) violates this inequality. thing car document note report technical report activity report 1 1 0.5 0.5 0.25 0.25 t1="technical report" t2="car" dist(t1,t2)=2,75 t'="document"
dist(t1,t')=0,75 and dist(t2,t')=2 dist(t1,t2)≤ Max(dist(t1,t'), dist(t2,t'))
Fig. 3. Counter example for the metric defined in (2) to be an ultrametric
The problem we then considered was a transformation of the ontological distance that would provide an ultrametric and transform the ontological tree into a dendro-gram used to propose different levels of detail in clustering the semantic annotations on competencies. A simple transformation would be to use a maximal distance that would only depend on the least common supertype of the two types compared:
)) , ( ( ) , ( 2 1 2 1 2 1 2 1 )) ( , ( ( max ) , ( t t LCST depth t t LCST t MH t t distt ST t dist = = < ∀ (3) where ST(t) is the supertype of t
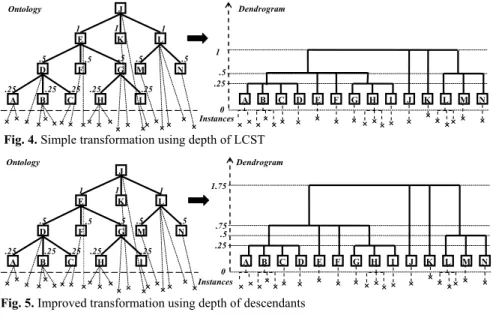
As shown in Figure 4, this transformation provides a dendrogram with levels of clustering that directly correspond to the levels of the ontology and therefore brings no added value compared to the direct use of the ontology depth to control the level of detail. In order to provide the users with a better precision in choosing the level of detail we needed a criterion to differentiate the classes and order their clustering. The distance given in (4) takes into account the depth of the hierarchy below the least common supertype.
(
)
(
1 2)
1 2 ) , ( 2 1, ) max , ( , ) when ( 2 1 t t t t LCST st dist t t dist t t LCST st CH =∀≤ ≠ 2 1 2 1, ) 0 when (t t t t distCH = = (4) where st ≤ LCST(t1,t2) means that st is a subtype of the least common supertype ofThis allows us to differentiate between classes that already gather a number of lev-els of detail and classes with a shallow set of descendants. Figure 5 shows the result of this transformation using the same ontology as Figure 4; we see a new level appear that differentiates the classes L and E based on the level of detail they gather.
A B C D H I G F E M N L K J 1 1 1 .25 .5 .5 .5 .5 .5 .25 .25 .25 .25 .25 .5 1 Ontology Dendrogram Instances0 A B C D E F G H I J K L M N
Fig. 4. Simple transformation using depth of LCST
A B C D H I G F E M N L K J 1 1 1 .25 .5 .5 .5 .5 .5 .25 .25 .25 .25 A B C D E F G H I J K L M N .25 .5 .75 1.75 Instances0 Ontology Dendrogram
Fig. 5. Improved transformation using depth of descendants
To be precise, distMH takes its values in (5):
{ }
0 0 ; 2 1 ∪ ≤ < = n D EMH n (5)where D is the maximal depth of the ontology.
Therefore the maximum number of levels in the dendrogram of distMH is
Card(EMH)=d+1 . In comparison, distCH takes its values in (6):
{ }
0 0 ; 2 1 ∪ ≤ ≤ < =∑
= D n m E n m i i CH (6) Thus, at a given depth d the maximum number of levels is recursively defined byNL (d) = NL(d-1) + d because an additional depth possibly adds one more arc to any
path from the root. Since NL(0)=1, we can deduce that:
(
)
1 2 2 ² 1 2 1 1 ) ( ) ( 1 + + = + + = + = =∑
= D D D D n D NL E Card D n CH (7) Therefore, for a given maximal depth D we have(
1)
0sinceD 1 2 2 2 ² ) ( ) (E −Card E =D −D=D D− > > Card CH MH (8)Thus distCH generates more levels than distMH and the difference is upper-bounded
by the square of D. Now we need to prove that distCH is an ultrametric:
(a) By definition distCH(t,t) =0 see (4)
(b) Let us show that distCH(t1,t2) = distCH(t2,t1)
(
)
(
, ( , ))
max(
(
, ( , ))
)
( , ) max ) , (1 2 (, ) 1 2 ( ,) 2 1 2 1 1 2 2 1 t t dist t t LCST st dist t t LCST st dist t t distCH =∀st≤LCSTtt =∀st≤LCSTtt = CHThis is because LCST(t1,t2)=LCST(t2,t1) i.e. the least common supertype of t1 and
t2 is also the least common supertype of t2 and t1.
(c) Let us show that distCH (t1,t2) = 0 ⇒ t1=t2 : if t1≠t2 we have
(
)
(
, ( , ))
(
, ( , ))
(
, ( , ))
0 max ) , ( 1 2 1 1 2 2 1 2 ) , ( 2 1 2 1 > + ≥ = ≤∀ distst LCSTt t distt LCSTt t distt LCSTt t
t t dist t t LCST st CH
So the only way to have distCH(t1,t2) =0 is when t1=t2
(d) Let us show that ∀t' distCH(t1,t2) ≤ max(distCH(t1,t'), distCH(t2,t')) (strengthened
triangle inequality)
If t1=t2 then distCH(t1,t2) =0 and the inequality is verified.
If t' ≤ t1 and t1≤ t2 and t' ≤ t2 then
(
)
(
, ( ,' ))
max(
(
, ( , ))
)
max ) ,' ( 1 2 ) , ( 2 ) ,' ( 2 2 1 2 t t LCST st dist t t LCST st dist t t dist t t LCST st t t LCST st CH =∀ ≤ =∀≤since if t' ≤ t1 then LCST(t',t2)=LCST(t1,t2) or more generally the least common
su-pertype for t1 and t2 is the same as the one of the subtypes of t1 and t2 since we are
in a tree.
If t' ≤ t2 and t2≤ t1 and t'≤ t1 the same reasoning applies mutatis mutandis.
If t1 ≤ t2 and t' ≤ t2 then LCST(t',t2)=t2 and LCST(t1,t2) =t2 so distCH(t2,t')=
distCH(t1,t2). If t2≤ t1 and t'≤ t1 the reasoning is, mutatis mutandis, the same.
If t'≤ t2 and t'≤ t1 then LCST(t1,t2) ≤ LCST(t',t1) or LCST(t1,t2) ≤ LCST(t',t2)
other-wise we would have LCST(t1,t2)>LCST(t',t1) and LCST(t1,t2)>LCST(t',t2) and since
t1≠ t2, t' ≤ t2 and t' ≤ t1, it would require t' or one of its ancestors to have two
fa-thers which is impossible in a tree. So if LCST(t1,t2) ≤ LCST(t',t1) then
distCH(t1,t2) ≤ distCH(t1,t') since {st ; st ≤ LCST(t1,t2)} ⊂ {st ; st≤ LCST(t',t1)}.
Like-wise if LCST(t1,t2) ≤ LCST(t',t2) then distCH(t1,t2) ≤ distCH(t2,t') since {st ;
st≤LCST(t1,t2)} ⊂ {st ; st≤ LCST(t',t2)}. Thus, in both cases the inequality is
veri-fied. Therefore, we covered all the cases and distCH is an ultrametric that can be
used to produce a range of levels of detail exploitable in widgets for interfaces. The maximal distance distMax between two sister classes of depth d in an ontology
of maximal depth D is D d d D d d D d d D i i d D d i i Max d D dist 2 1 2 1 2 1 1 2 1 2 1 2 1 1 2 1 2 1 2 1 2 1 ) , ( 1 1 2 2 2 2 0 1 1 − = − = − × = = = − + + − + − − + − = − − =
∑
∑
The minimal distance between two sister classes of depth d is distMin(d)= 1/2 d-1.
Therefore distMax(d+1)< distMin(d) i.e. the clustering of classes respects the ontology
hierarchy and a class cannot be clustered before its descendants. However between two sister classes, the children of a shallow class will be grouped before the children of a class with a deep descendant hierarchy. Finally since the clustering follows the class hierarchy, a name can be given to every cluster Cl and it is very important to produce a meaningful clustering: Name(Cl) = Name (LCST({t ; type t ∈ Cl}))
3.3 Ontology-based queries to form clusters
Using our transformation of an ontological distance into an ultrametric, we create two dendrograms respectively for the ontology of resources and the ontology of actions. Each dendrogram supports a widget (e.g. scrollbar) allowing the user to choose a level of detail for clustering respectively the resources and the actions.
To choose the levels / heights at which the dendrograms are cut amounts to select a number of classes that can be used to differentiate competences during the clustering: every class visible at this level may be used to describe a competence. Therefore the two levels of detail chosen for resources and actions result in two sets of classes of resources and actions that have to be considered. Based on these sets and the market sector the user chose, we generate all the combinations of queries that cover all the combinations of resources and actions; thus each one of these queries corresponds to a potential bubble, and the bubble will be shown if there is at least one answer to this query. To consider a competence once and only once, the queries exclude the sub-classes that have not been collapsed i.e. the subsub-classes that are above the detail level and for which there will be a dedicated query. Each query is submitted to the CORESE search engine to retrieve and count instances of competences falling in the corresponding bubble.
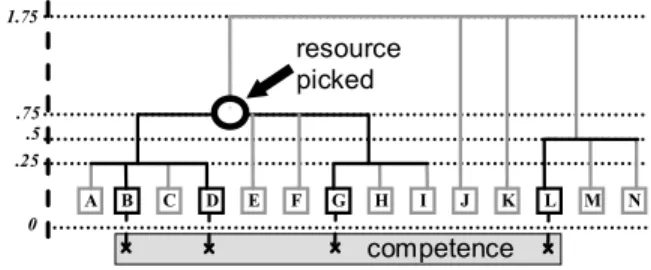
As we mentioned, there might be several resources for a competence and the ana-lyst chooses the most representative one. For each competence, this inference is simu-lated by considering the classes of resources available at the chosen level of detail and by sorting them according to the number of instances of resources they cover for this competence. For instance if a competence uses java, c, c++, and project
man-agement as resources and the level of detail include classes like manman-agement theory, programming language and mathematic models, these classes will be sorted as
fol-lows: programming language (3 instances), management theory (1 instance),
math-ematic models (0 instance). Therefore the most representative resource type picked
will be programming language and this competence will be counted in a cluster on
programming language. This process is illustrated in figure 6.
A B C D E F G H I J K L M N .25 .5 .75 1.75 0 competence resource picked
Fig. 6. Choosing the most representative resource
The final result is a list of bubbles grouped in clusters. The last problem is the dis-play of these bubbles and clusters in an intelligent and intelligible fashion.
3.4 Conceptual Classification & Spatial Grouping
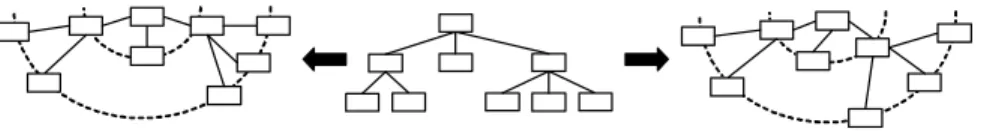
Users are interested in two aspects when comparing clusters: the size of the cluster and the type of resources used by the competences of this cluster. They combine these two dimensions to obtain what they called a "radar view" of the technological pole that they draft in Figure 2. The radar view uses angular coordinates: the angle is de-rived from the place of the resource classes in the ontology and the radius is dede-rived from the size of the cluster. Figure 7 shows two opposite approaches in using the ontology for angular positions: a top-down division where the children equally share the angle allocated to their parent (left part of the figure); a bottom-up merging where leaves equally share the available angle and parents get the sum of the angles of their children (right part of the figure).
Fig. 7. Using the ontology for angular positions
Here the initial angle was 180°. On the left (top-down division) it was divided into three for the first level of children (60° each) and then the first and last thirds were respectively divided into two (30°) and three (20°) for the second descendants. On the right (bottom-up merging), the 180° were divided into 6 for the leaves of the tree (30° each) then the nodes of the first level are respectively allocated angles of 60°, 30° and 90°. The top-down division maintains the equality between brothers and favors the structure of the upper modules while the bottom-up merging maintains the equality between leaves and favors the detailed branches.
In our case the top-down division was more interesting since it divides the space equally between the main domains of resources and, as shown in Figure 8, the ontol-ogy is much more detailed in some parts (e.g. the computer resources) than in some others (e.g. management resources). On such an ontology, bottom-up merging would bias the view while the top-down division applied on 360° in Figure 8 maintains an equal angle for brothers; this is used to have an egalitarian positioning of the clusters based on their representative resource. Figure 9 shows the result of this approach applied to the list of clusters obtained with the inference previously described: the angular position is given by the place of the representative resource in the ontology, and the radius corresponds to the size of the cluster. As a result we can see that the activity of the technological pole is primarily focused in a given sector on which Figure 10 provides a partial zoom.
Fig. 8. Top-down division of the ontology applied on 360°
Fig. 9. Radar view of the clusters on 180°
4 Evaluation and Conclusions
Two types of evaluations were carried out: (1) usage; (2) complexity and response time. The evaluation of usage triggered several evolutions of the interfaces (including two major reengineerings) using different techniques (thinking aloud, video analysis, questionnaires, etc.). Examples of usage issues are:
• Users require simple widgets to select the levels of detail. The ability to choose with great precision the levels of detail of a clustering beforehand appeared not to be natural and it was replaced by a simplified choice (e.g. Detailed / Normal / Ab-stract). The ability to precisely choose the level of detail would make more sense if the controlling widget and the clustering view were displayed at the same time and the users could see in real time the result of their actions.
• Grouping the core competencies in the centre of the radar view may not be the best choice as it tends to clutter the centre of the representation while it contains some important information.
• The use of the ontology in interfaces to formulate annotations or queries remains a problem and we are testing generic widgets to propose different ways to navigate and choose concepts in the ontology.
• Users want to be able to customize graphical elements of the interface, not only colors but also, for instance, the angle associated to a domain in order to expand a part they are interested in. We are also experimenting with short-cuts in ontology distances using the "seeAlso" property. Labels of concepts were criticized and mul-tiple labeling is an issue.
• Users asked for the ability to post-process the results i.e. to reuse results from clus-tering and queries to run new inferences, filters and queries on them.
• Users want to capture the dynamics of competences and, for instance, build a his-tory of the evolution of the clusters or make previsions.
• Users wanted to have an idea of the time it will take to compute a clustering view. We also abstracted a methodology to involve users and keep them involved in the design of an ontology-based application [4].
The last usage issue motivated the study of complexity and response time. There are two phases in the inference we detailed here: the initialization of the dendrograms and tree of angles (which is done once) and the calculation of the clusters and their position (which is done each time a user submits a query). The complexity of the algorithm for the initialization of the dendrograms and tree of angles breaks down as follows, where n and m are the number of classes respectively in the ontologies of resources and actions: Parsing the schema to build the tree: O(n+m) ; Initializing the depth and angular distribution: O(n+m) ; Sorting the dendrogram: O(n×log(n)+
m×log(m))
The size of the set of queries produced to build the clusters depends on the level of detail chosen by the users. For two levels of detail n' and m' respectively chosen in the dendrograms of resources and actions we have to solve n'×m' queries and so the worse case is n×m queries. We carried out a number of real time tests using a small configuration (Pentium 4 M / 1.7GHz / 512 Mb running Windows XP Pro):
• The average minimum time (for n'=1 and m'=1 and thus 1 query/potential cluster) is 86 milliseconds.
• The average maximum time (n'=596 and m'=118 thus 70 328 queries/potential clusters) is 11 minutes.
• The average typical time (n'=109 and m'= 9 thus 981 queries/potential clusters) is 9 298 milliseconds i.e. roughly 9 seconds.
The notion of typical query is due to the fact that the level of detail used by users of the radar view is much lower than the level of detail provided by the ontology and used by the end-user companies to describe themselves. For instance when market analysts are interested in activities of the Telecom Valley that involve programming in general, they do not want to differentiate between java, c++, c#, etc.
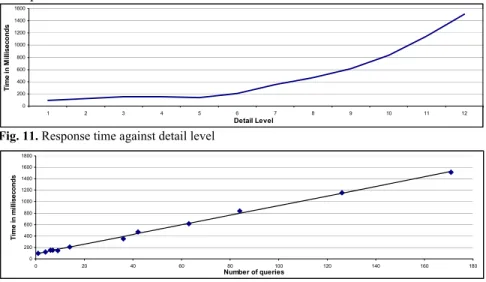
Figure 11 shows the behavior of the response time against the level of detail pro-vided by the possible combinations of n' and m' and Figure 12 shows the behavior of the response time against the actual value of n'×m' that is to say the number of gener-ated queries. The linear regression of Figure 12 approximately corresponds to y= x×
8.42+89.24 and it has two very useful applications: (a) it provides a very simple and
rapid way to foresee and warn the users about the time a clustering request will take to be solved before they actually submit it, and (b) it predicts the level of detail above which it is better to rely on a reporting functionality that prepares a set of views in batch mode rather than relying on a real-time calculation; typically above 15 seconds of response time i.e. above n'×m'=2000 in our case.
0 200 400 600 800 1000 1200 1400 1600 1 2 3 4 5 6 7 8 9 10 11 12 Detail Level T im e in M illis ec on ds
Fig. 11. Response time against detail level
0 200 400 600 800 1000 1200 1400 1600 1800 0 20 40 60 80 100 120 140 160 180 Number of queries T im e in m illi se co n d s
Fig. 12. Response time against number of queries
KmP now includes a set of views and analysis tools as the radar view we detailed in this article. This semantic Web portal provides indicators for institutional organiza-tions to understand the landscape of the technological park, and for actors to find opportunities, niches, partners, etc. The acceptance of KmP by users is real and we are now moving from a group of 20 pilot user companies to a set of 70 user compa-nies and more and more public research centers are describing themselves, while the project is entering an industrialization phase.
By detailing the work done on one RDFS-based graph inference, we showed how the graph structure of semantic web formalisms can be exploited in new inferences to support intelligent interfaces in bridging the gap between the complexity of these underlying conceptual models and the ergonomic constraints of end-users' interfaces and daily concerns. The inferences at play here are domain-independent and can be reused to support other functionalities and of course other inferences exist on these graph structures. The algorithm has already been reused to produce other clustering view such as the identification of competency poles, another type of representation used by economists. Here, we proved the characteristics of the metrics and inferences we proposed and we illustrated the interpretation that can be associated with their results. In parallel we are conducting an experiment to evaluate and compare these simulated metrics with the ones humans naturally use in handling information [3].
References
1. Collins, A., Loftus, E.: A Spreading Activation Theory of Semantic Processing. Psychologi-cal Review, vol. 82, (1975) 407–428
2. Corby, O., Dieng-Kuntz, R., Faron-Zucker, C.: Querying the Semantic Web with the Corese Search Engine, European Conference on Artificial Intelligence, IOS Press (2004) 705–709 3. Gandon F., Corby O., Dieng-Kuntz R., Giboin A.: Proximité Conceptuelle et Distances de
Graphes, Raisonner le Web Sémantique avec des Graphes, Plate-forme AFIA, Nice (2005) 4. Giboin A., Gandon F., Gronnier N., Guigard C., Corby, O.: Comment ne pas perdre de vue
les usage(r)s dans la construction d’une application à base d’ontologies? Retour d’expérience sur le projet KmP, Ingénierie des Connaissances, AFIA (2005) 133–144 5. Jain, A.K., Murty, M.N., and Flynn, P.J.: Data Clustering: A Review, ACM Computing
Surveys, Vol 31, No. 3, (1999) 264–323.
6. Jiang, J., Conrath, D.: Semantic Similarity based on Corpus Statistics and Lexical Taxon-omy, International Conference on Research in Computational Linguistics, Taiwan (1997) 7. Lazaric N., Thomas C.: The coordination and codification of knowledge inside a network, or
the building of an 'epistemic community': The 'Telecom Valley' case study, Reading the Dynamics of a Knowledge Economy, Edward Elgar Publishing (2005)
8. Quillian, M.R.: Semantic Memory, Minsky M. (ed.), Semantic Information Processing, M.I.T. Press, Cambridge (1968)
9. Rada, R., Mili, H., Bicknell, E., Blettner, M.: Development and Application of a Metric on Semantic Nets, IEEE Transaction Systems, Man, and Cybernetics, vol. 19(1), (1989) 17–30 10. Resnik, P.: Semantic Similarity in a Taxonomy: An Information-Based Measure and its
Applications to Problems of Ambiguity in Natural Language. In Journal of Artificial Intelli-gence Research, vol 11, (1995) 95–130
11. Sowa., J.F.: Conceptual structures: Information Processing in Mind and Machine. Addison-Wesley, Reading, Massachusetts (1984)
12. Wu Z., Palmer M.: Verb Semantics and Lexical Selection, 32nd Annual Meeting of the Association for Computational Linguistics, Las Cruces, New Mexico (1994)