HAL Id: tel-02100593
https://tel.archives-ouvertes.fr/tel-02100593
Submitted on 16 Apr 2019
HAL is a multi-disciplinary open access archive for the deposit and dissemination of sci-entific research documents, whether they are pub-lished or not. The documents may come from teaching and research institutions in France or abroad, or from public or private research centers.
L’archive ouverte pluridisciplinaire HAL, est destinée au dépôt et à la diffusion de documents scientifiques de niveau recherche, publiés ou non, émanant des établissements d’enseignement et de recherche français ou étrangers, des laboratoires publics ou privés.
potential-based brain computer interfaces
Nathalie Gayraud
To cite this version:
Nathalie Gayraud. Adaptive machine learning methods for event related potential-based brain com-puter interfaces. Signal and Image processing. Université Côte d’Azur, 2018. English. �NNT : 2018AZUR4231�. �tel-02100593�
Méthodes adaptatives
d'apprentissage pour des
interfaces cerveau-ordinateur
basées sur les potentiels évoqués
Nathalie Thérèse Hélène
GAYRAUD
INRIA Sophia Antipolis – Méditerranée, Équipe-Projet Athéna
Présentée en vue de l’obtention du grade de docteur en STIC d’Université Côte d’Azur
Dirigée par : Maureen Clerc Soutenue le: 11/12/2018
Devant le jury, composé de : Maureen Clerc, Inria Sophia-Antipolis Marco Congedo, GIPSA Lab, Grenoble Nicolas Courty, Université Bretagne Sud Moritz Grosse-Wentrup, University of Munich Alain Rakotomamonjy, Université de Rouen Michael Tangermann, University of Freiburg
Jury :
Rapporteurs :
Marco Congedo, GIPSA Lab, Grenoble
Michael Tangermann, University of Freiburg
Examinateurs :
Nicolas Courty, Université Bretagne Sud
Moritz Grosse-Wentrup, University of Munich
Alain Rakotomamonjy, Université de Rouen
Méthodes adaptatives d'apprentissage
pour des interfaces cerveau-ordinateur
basées sur les potentiels évoqués
Adaptive Machine Learning Methods for
Event Related Potential-Based Brain
RÉSUMÉ
Les interfaces cerveau machine (BCI pour Brain Computer Interfaces) non invasives permettent à leur utilisateur de contrôler une machine par la pensée. Ce dernier doit porter un dispositif d’acquisition de signaux électroencéphalo-graphiques (EEG), lesquels sont par la suite traités et transformés en commandes. Cependant, les signaux EEG sont dotés d’un rapport signal sur bruit très faible ; à ceci s’ajoute l’importante variabilité que l’on trouve tant à travers les sessions d’utilisation qu’à travers les utilisateurs. Par conséquent, la calibration du BCI, pendant laquelle l’utilisateur est amené à effectuer une tâche prédéfinie, doit sou-vent précéder son utilisation. Le sujet de cette thèse est l’étude des sources de cette variabilité, dans le but d’explorer, concevoir, et implémenter des méthodes d’autocalibration. Nous nous intéressons en particulier aux interfaces cerveau machine qui utilisent des potentiels évoqués comme marqueur neurophysiologique (ERP-based BCI), que nous introduisons dans la première partie.
La deuxième partie de cette thèse porte sur l’analyse des sources de variabilité que l’on rencontre dans ce type d’interface cerveau machine. Nous effectuons une étude bibliographique de la variabilité des potentiels évoqués, en nous in-téressant particulièrement au potentiel tardif connu sous le nom de P300. Nous réalisons aussi une analyse de la variabilité du signal EEG sur deux bases de don-nées qui proviennent d’expériences de BCI avec potentiel évoqué. Après avoir évalué les sources de variabilité de manière quantitative, nous nous penchons sur les méthodes adaptatives d’apprentissage automatique, notamment, les méthodes d’apprentissage par transfert. Ces méthodes permettent aux algorithmes de classifi-cation de généraliser malgré la variabilité, et donc de ne pas avoir besoin d’être calibrés avant chaque utilisation du BCI. Nous analysons sur trois méthodes en particulier pour décrire à quel type de variabilité elles sont le mieux adaptées : la géométrie riemannienne, le transport optimal, et l’apprentissage ensembliste. Puis
nous proposons un modèle du signal EEG généré pendant l’utilisation d’un BCI qui tient compte de la variabilité. Les paramètres résultants de nos analyses nous permettent de calibrer ce modèle et à simuler une base de données, qui nous sert à évaluer la performance de ces méthodes d’apprentissage par transfert. Les résultats de cette analyse démontrent que ces méthodes sont adaptées à certains types de variabilité ; cependant, aucune de ces méthodes ne s’affranchit de toutes les sources de variabilités présentes dans les données EEG.
La troisième partie de cette thèse porte sur l’application de ces méthodes à des données expérimentales et à la conception de méthodes dérivées de celles-ci. Nous proposons une méthode de classification basée sur le transport optimal dont nous évaluons la performance. Ensuite, nous introduisons un marqueur de séparabilité qui nous permet d’évaluer un ensembles de vecteurs de caractéristiques, particulièrement dans le cadre de la géométrie riemanniene. Ce dernier nous permet de concevoir une méthode qui réunit géométrie riemannienne, transport optimal et apprentissage ensembliste. Nos résultats témoignent que la combinaison de plusieurs méthodes d’apprentissage par transfert nous permet d’obtenir un classifieur qui s’affranchit des différentes sources de variabilité du signal EEG de manière efficace. Enfin, nous proposons une méthode de calibration non supervisée pour le cas particulier d’un BCI spécifique : le clavier virtuel P300 . La thèse se conclut par une discussion générale, ainsi que nos contributions additionnelles.
Mots-clés
ABSTRACT
Non-invasive Brain Computer Interfaces (BCIs) allow a user to control a ma-chine using only their brain activity. The BCI system acquires electroencephalo-graphic (EEG) signals using an EEG acquisition device. The signals are subse-quently processed and transformed into commands. However, EEG is characterized by a low signal-to-noise ratio and an important variability both across sessions and across users. Typically, the BCI system is calibrated before each use, in a process during which the user has to perform a predefined task. This thesis studies of the sources of this variability, with the aim of exploring, designing, and implement-ing zero-calibration methods. In particular, we are interested in Event Related Potential-based BCI (ERP-based BCI), which we introduce in the first part.
The second part of this thesis deals with the analysis of the sources of variability encountered in ERP-based BCI. We review the variability of the event related potentials, focusing mostly on a late component known as the P300. We also perform an analysis on two databases containing EEG signals that were generated during ERP-based BCI experiments. This allows us to quantify the sources of EEG signal variability. Our solution to tackle this variability is to focus on adaptive machine learning methods, such as transfer learning , which allow classification algorithms to generalize. We focus on three methods in particular and describe which type of variability they are the most suited for: Riemannian geometry, optimal transport, and ensemble learning. Then, we propose a model of the EEG signal generated during the use of an ERP-based BCI that takes variability into account. The parameters resulting from our analyses allow us to calibrate this model in a set of simulations, which we use to evaluate the performance of the aforementioned transfer learning methods. The results of this analysis demonstrate that these methods generalize under certain types of variability; however, none of these methods can cope with all the sources of variability that are present in the EEG
signal.
The third part of this thesis deals with the application of these methods to experimental data and the design of methods derived from their combination. We first propose a classification method based on optimal transport which we evaluate in terms of classification performance. Then, we introduce a separability marker that can be applied to evaluate training sets, especially under the framework of Riemannian geometry. We use the separability marker to design a method that com-bines Riemannian geometry, optimal transport and ensemble learning. Our results demonstrate that the combination of several transfer learning methods produces a classifier that efficiently handles multiple sources of EEG signal variability. Finally, we propose an unsupervised calibration method for a specific BCI: the P300 Speller. The thesis concludes with a general discussion, as well as our other contributions.
Keywords
ACKNOWLEDGEMENTS
To my grandfather Giannis Στον παππού μου το Γιάννη
Three years and three months have passed, and the journey came to an end. And what a journey it was. Full of all kinds of lessons, enriching and wholesome, but also hard and full of storms and trials. A true odyssey. The time has come for me to thank all those who accompanied me in this journey and helped me complete it, one way or another. Forgive me in advance if I have forgotten someone, I have so many things to be grateful for!
Maureen, I would like to thank you first, for giving me this amazing opportunity. Without you none of this would’ve been possible. You stood by me all these years, providing wise council. I would like to especially thank you for your immeasurable support during the time I was writing my thesis. You made easier one of the hardest moments in a PhD student’s life and I cannot thank you enough for that. Rachid, I cannot thank you enough either, for you have put together a team of remarkable people in every way, something only a remarkable person can do. Your warmth and kindess matched by Efi’s made so much easier for me to not feel homesick.
Guillermo, we started this together and we finished it together. No words can accurately describe my gratitude to you, and anyway we’ve said them all for the past four years. I enjoyed a truly perfect friendship with you, which led to a beautiful collaboration too, so I have been doubly blessed. Let me add simply this: thank you for being my christian moral compass all this time ;) Marco, I am so glad I met you my friend, so glad for all those beautiful memories of emptying wine bottles together while philosophising about life, or partying with you and Guillermo. Without you and Guillermo, my life would’ve been bland, deprived of that beautiful spirit of yours.
Of course, I was able to go through all that because I had the best officemates EVER. Lavinia, your friendship has been so precious to me, we helped each other through hard moments, but your kindness gave me the will to overcome all of them. Along with Guille, Marco, Luna, Samira and Fatmanur, it is not at all an exaggeration to say that I have been blessed to have met you all and spent these moments with you. One of the things that made me the happiest was finding a group of friends to share amazing times with. It also makes me sad now because we are about to take different trajectories in life. But that is life, right? So, thank you for all these moments, all that you did for me, the small and the big things: the gifts, the staying with me at the hospital, the apéros, the dinners, the trips, the friendship.
Federica, thank you for the amazing collaboration, it was so fulfilling and interesting. I hope it will be the first of many. I will definitely miss your sweet sweet person and will always remember the fun we’ve had in and out of the office, with you, Isa and Antonia. Isa, Antonia, you truly are amazing people, I love you girls! Kostya, you have been the best colleague ever. I look forward to many more Dota games with you, Samuel, Marco and Guille, so that I may keep my sanity as I did during the last days of my PhD. Last days that would’ve been much much harder if I hadn’t met my gaming partner and wonderful friend Chris in an unlikely turn of events. Thank you so much for all that motivation you gave me when I felt like giving up.
Athenians, past and present, visiting and permanent, you are all amazing people and skilled scientists. Let me mention those I haven’t yet, and thank you all for every moment: Theo, Ragini, Demian, Marco, Rutger, Brahim, Kai, Nathanael, Amandine, Mauro, Patryk, Abib, Matteo, Ivana, Sara, Romain, It’s been an honor and a pleasure. Jelena, I mention you especially because you were my first true friend when I came back to France. Thank you for putting up with me all this years and for relentlessly motivating me. I’d like to also thank each and every person implicated in the BCI-Lift project, to which I owe this PhD and numerous collaborations. Sebastien, j’ai vraiment apprecié nos collaborations, et j’espère bien qu’il en aura encore dans le futur.
I would like to especially mention a beautiful soul that I met and became friends with during these three years. Agnes, nos chemins vont se séparer, mais je n’oublierais jamais ta gentillesse et je prie pour que tu en sois récompensée,
ix
parce que tu ne mérites que le meilleur. Δήμητρα, ΄Ελενα, Χρήστο, Χριστίνα,
Κωνσταντίνε και λοιποί έλληνες της Côte d’Azur, σας ευχαριστώ πολύ για όλα
όσα κάνατε για μένα, και πάνω από όλα για τη φιλία σας. Περάσαμε πολλά μαζί
αλλά τα καταφέραμε και θα συνεχίσουμε έτσι. Je remercie aussi Eli, Philippe,
Fanny, Jean Paul, les pasteurs Thibaud et Patrick, et tous mes frères et soeurs en Christ de l’église d’Antibes και της Ελλάδας. Vos prières m’ont amené jusqu’ici et je prie que Dieu puisse vous bénir tous. Un grand merci pour tout ce que vous avez fait pour moi, tant spirituellement que par vos actes.
Κορίνα, Φωτεινή, Μαρία, ΄Εφη, είστε η οικογένεια που διάλεξα και ξέρω ότι δε χρειάζεται να σας πω πολλά. (Σαν) Αδερφές μου όλα αυτά τα χρόνια, είμαστε πλάι η μία στην άλλη (ακόμα και νοητά, δεν έχει σημασία) στα δύσκολα και στα εύκολα μαζί, κάτι που δε θα ήθελα ποτέ να τελειώσει, μία φιλία που δε θέλω να την καταστρέψει ο χρόνος και η απόσταση και θα κάνω τα πάντα για αυτό. Σας ευχαριστώ που με αγαπάτε όπως είμαι και που με διορθώνεται όταν δεν είμαι αυτό που θα έπρεπε να είμαι. Μαρίνα μου, γλυκούλα μου, τι να πρωτοαναφέρω, τις συνεργασίες μας, το ότι ήμασταν μαζί όταν έμαθα τα νέα ότι θα έρθω Γαλλία, ή το ότι μετά από τόσα χρόνια η σχέση μας δεν έχει αλλάξει καθόλου··· Σάγαπώ πολύ και σε ευχαριστώ για όλα. Τέλος, ένα μεγάλο σας αγαπώ και σας ευχαριστώ θα πω στην οικογένειά
μου. D’abbord à mes parents, Pascal et Calypso, qui ont tant donné pour moi. Á
mon frere Anthony qui est le meilleur frères du monde. Je suis tellement heureuse d’avoir pu accomplir tout cela, που σας έκανα περήφανους. Πως να ανταποδώσω την αγάπη σας· Το αφήνω στα χέρια του Θεού αυτό γιατί θα μου ήταν αδύνατο. A mon papi et ma mamie et toute ma famille en france. Στην γιαγιά μου, και στον παππού μου που τόσο θα χαιρόταν αν με έβλεπε, και που για το λόγο αυτό του αφιερώνω τη διατριβή αυτή. Σε όλη μου την οικογένεια στην ελλάδα.
To God, I give grace in the name of Jesus, who blessed me with everything.
TABLE OF CONTENTS
Abstract - French iii
Abstract - English iv Acknowledgements vii Table of Contents x General Introduction xv Notations xx
I
Background
1
1 ERP-based Brain Computer Interfaces 3
1.1 Introduction . . . 3
1.2 Brief History of ERP-based BCI . . . 4
1.3 The BCI System . . . 5
1.3.1 The Interface . . . 5
1.3.2 EEG Acquisition and Processing . . . 5
1.3.3 Extracting Information from the EEG signal . . . 7
1.3.4 System Update . . . 8
1.4 System Calibration . . . 9
II
Variability in ERP-based BCI
11
2 Sources of Variability in ERP-based BCIs 13
2.1 Introduction . . . 13
2.2 Variability of ERP Components . . . 15
2.2.1 The P300 Component . . . 15
2.2.2 The P3a Component . . . 18
2.2.3 Sensory Evoked Potentials . . . 19
2.3 Analysis on Experimental Datasets . . . 19
2.3.1 Dataset description . . . 19
2.3.2 Analysis. . . 21
2.4 Conclusion . . . 26
3 Transfer Learning Methods 27 3.1 Introduction . . . 27
3.2 Background . . . 28
3.2.1 Definition and Notations . . . 28
3.2.2 Transfer Learning in ERP-based BCI . . . 29
3.3 Tackling ERP-based BCI Variability . . . 31
3.3.1 Invariant Features using Riemannian Geometry . . . 31
3.3.2 Solving Covariate Shift with Optimal Transport . . . 34
3.3.3 Ensemble Learning: Bagging Classification . . . 38
3.4 Conclusion . . . 39
4 Evaluation on Simulated Experiments 41 4.1 Introduction . . . 41
4.2 Modeling EEG recordings . . . 42
4.2.1 Source Analysis in EEG . . . 42
4.2.2 Existing EEG Signal Models and Beyond . . . 43
4.2.3 Modeling Trial-to-Trial Variability . . . 44
4.2.4 An EEG Model for ERP-Based BCI . . . 46
4.3 Simulation of a P300 Speller Experiment . . . 47
4.3.1 Neural Source Simulation and Experiment Parameters . . 47
4.3.2 Simulating Variability . . . 49
TABLE OF CONTENTS xiii
4.4.1 Classification Pipelines and Performance Measures . . . . 51
4.4.2 Amplitude variability . . . 52
4.4.3 Latency variability . . . 53
4.4.4 Background activity and noise variability . . . 54
4.5 Discussion and Conclusion . . . 55
III
Contributed Methods
59
5 Optimal Transport 61 5.1 Introduction . . . 615.2 Optimal Transport as a Transfer Learning Method . . . 62
5.2.1 Regularized Discrete Optimal Transport . . . 62
5.2.2 Method 1: Optimal Transport in the Feature Space . . . . 64
5.2.3 Method 2: Optimal Transport as a Classification Method . 66 5.3 Application to P300-Speller Data . . . 67
5.3.1 Experiment Description . . . 67
5.3.2 Classification Pipeline . . . 69
5.4 Results. . . 70
5.4.1 Feature Transportation Example . . . 70
5.4.2 Cross Session Offline Experiments . . . 73
5.4.3 Cross Subject Offline Experiments . . . 73
5.5 Discussion. . . 73
5.6 Conclusion . . . 74
6 Riemannian Features: Assessing Classification Confidence 75 6.1 Introduction . . . 75
6.2 Geometrical and Statistical Properties . . . 77
6.2.1 Theoretical Assumptions on the Feature Space . . . 77
6.2.2 Gaussian Distributions in High Dimensional Spaces . . . 78
6.2.3 Geometric Properties of the Riemannian Manifold . . . . 79
6.2.4 The Separability Marker . . . 80
6.3 Application to P300-Speller Data . . . 82
6.3.1 Geometrical Analysis . . . 82
6.4 Results. . . 89
6.5 Discussion. . . 89
6.6 Conclusion . . . 90
7 Unsupervised Learning 93 7.1 Introduction . . . 93
7.2 Unsupervised P300-Spelling: A Proof of Concept . . . 94
7.2.1 Flashing Strategies in a P300-Speller experiment . . . 94
7.2.2 Feature Extraction . . . 95
7.2.3 Experiment Description . . . 96
7.3 Results. . . 96
7.4 Discussion and Conclusion . . . 97
IV
Conclusion
99
General Discussion 101
Bibliography 108
List of Publications 120
Appendix
GENERAL INTRODUCTION
Mankind has long been on a quest to understand the mind, source of human thought. This pursuit has led us into one of the most intricate organs of the human body: the brain. In ancient Greece, Hippocrates was the first to proclaim that the brain was the seat of intelligence, the source of our thoughts and sensations. Fast forward to the end of the 19th century, when Spanish anatomist Santiago Ramón y Cajal introduces the neuron to the scientific world. This discovery made him one of the pioneers of neuroscience and marked the beginnings of the neuroscience field. In 1924, for the first time, Hans Berger produces a human electroencephalographic recording. Forty nine years years later, Jacques Vidal publishes a study on
direct brain-computer communication [Vidal,1973].
The Brain Computer Interface field is born.
Context
Brain Computer Interfaces (BCIs) are conceived with an aim to provide an
alternate means of communication to people with severe motor disabilities [Wolpaw
et al.,2002]. A BCI system reads and deciphers electroencephalographic activity. Electroencephalography (EEG) measures the scalp electric potentials produced by
electrical activity in neural cell assemblies [Baillet et al.,2001]. The discovery of
significant correlations between spatiotemporal variations of the EEG signal and specific mental tasks has made it possible to use EEG to decipher a person’s
inten-tions [Wolpaw et al.,2002;Cabestaing and Derambure,2016]. Neurophysiological
markers such as event related synchronization/desynchronization (ERD/ERS) al-low to identify imagined movements. Sensory evoked potentials (SEP) and event
related potentials (ERP) elicit distinct responses to stimuli, which we can extract and convert into commands.
In this thesis, we study a particular type of BCI, namely based BCI. ERP-based BCI are non-invasive, EEG-ERP-based, reactive BCI. Non-invasive, because the signal is acquired through sensors that are placed on the scalp. EEG-based, because these sensors record EEG activity. Reactive, because the user controls the BCI by
choosing to pay attention (or to not pay attention) to a stimulus [Cabestaing and
Derambure,2016].
The stimuli of an ERP-based can be visual, auditory, or tactile. Therefore, the communication provided by ERP-based BCI does not depend on a particular sensory input. This makes them an attractive framework for people who suffer from serious motor disorders that lead to a locked-in syndrome, such as Amyotrophic Lateral Sclerosis (ALS). This was precisely the motivation of Farwell and Donchin,
who in 1988 introduced the first ERP-based BCI application [Farwell and Donchin,
1988]. Today, ERP-based BCI are used for spelling [Blankertz et al.,2011;Guy
et al., 2018], moving on-screen objects [Iturrate et al.,2015] and even gaming [Barachant and Congedo,2014].
Objective
ERP-based BCI systems operate by recording EEG activity, from which features are extracted and classified. Upon classification, the user receives feedback. A feedback example for a visual ERP-speller is the display of the selected letter on the screen. If the classification result is correct, the feedback will correspond to the user’s intention. Therefore, the performance of the classifier is highly important for a BCI. However, a major drawback of EEG-based applications is the low Signal-to-Noise Ratio (SNR) of the EEG signal. As a result, advanced signal processing and machine learning techniques need to be employed to enhance the classification accuracy. Moreover, as the variability of the EEG signal is very high, BCI sessions usually include a preliminary system calibration. Calibration describes a process during which the user has to perform a specific task without feedback. This process
can be lengthy, and is generally dull and tiresome for the user [Clerc et al.,2016].
The goal of this thesis is to propose adaptive machine learning methods which take explicitly into account the various types of EEG variability and the low SNR of the
General Introduction xvii
signal.
Contributions
In this thesis, we focus on the performance of various adaptive machine learning in terms of EEG signal variability. The contributions of our work are detailed below.
A Model of EEG variability We perform a detailed study of EEG signal
vari-ability. Our first contribution is a review of the existing literature on ERP variability, coupled with an analysis on two experimental datasets. We propose a model of the EEG signal which includes the various types of variability that arise from this study.
Transfer Learning Methods Against Variability Using our EEG signal model,
we generate simulated EEG signals and use them to evaluate three transfer learning frameworks: Riemannian geometry; optimal transport; and ensemble learning. In particular, we propose to interpret how each one deals with variability and we compare them between each other. In the final chapters, we propose classification methods that combine these three frameworks.
Optimal Transport Applied to ERP-based BCI We introduce a transfer
learn-ing framework based on optimal transport theory. We propose two methods that make use of this framework in the classification pipeline. The first one acts on the feature extraction step while the second acts on the classification step.
Separability in the Riemannian manifold of Symmetric Positive Definite
Matrices We provide a theoretical analysis of the Riemannian manifold of
Sym-metric Positive Definite matrices based on high dimensional geometry and statistics. This analysis leads to a marker of separability that can be applied to binary classifi-cation problems. We use this separability marker to assess the classificlassifi-cation results in an ensemble classifier.
Unsupervised Classification We introduce an unsupervised classification method
ac-count the structure of ths particular BCI system and of the vectors in the feature space. We present preliminary results that provide a proof of concept of our method.
Structure
The thesis is structured in the following way:
Chapter 1 In the first chapter, we introduce ERP-based BCI. We provide a
brief history and detail the BCI system and its components. Finally, we focus our attention on calibration and introduce our proposed solution, which is the use of adaptive machine learning methods.
Chapter 2 The second chapter starts a review of the bibliography on ERP
component variability. Then, we perform an analysis of the EEG variability of two experimental datasets. The first dataset includes EEG recordings from healthy users and the second contains EEG recordings from ALS patients.
Chapter 3 We begin chapter 3 with a short review of transfer learning and its
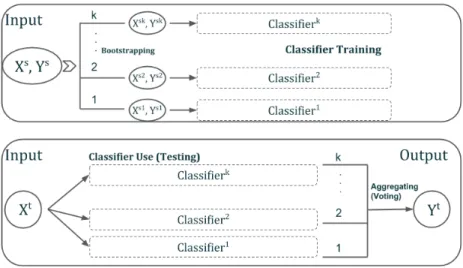
previous applications to ERP-based BCI. Then, we present three transfer learning frameworks. The first one is the Riemannian geometry framework, in which features are covariance matrices of the segmented EEG signal. The second one is based on optimal transport theory, whose aim is to compute an optimal transport plan that moves probability masses while minimizing a cost. The third is ensemble learning, which trains multiple classifiers and aggregates their decisions to provide a single classification result.
Chapter 4 In the fourth chapter, we introduce our EEG signal model, which
takes into account our experimental analysis of variability (chapter 2). We use this model to simulate a BCI experiment and generate EEG signals. These simulated signals are used to study how each transfer learning method in chapter 3 deals with each type of variability analyzed in chapter 2. We present the results of our study and discuss them.
General Introduction xix
Chapter 5 Chapter 5 provides a detailed description of the optimal transport
framework. We introduce the problem and provide the theoretical background of discrete regularized optimal transport. We propose two methods that use optimal transport. The first one applies it in the feature space as a domain adaptation tool. The second one applies optimal transport to derive a new classification method. Then, we combine these methods to ensemble learning. We perform experiments on experimental data to assess the performance of the two methods and of the ensemble learning framework. We conclude this chapter with a discussion.
Chapter 6 In the sixth chapter, we conduct a geometrical analysis of the
Rieman-nian space of symmetric positive definite matrices. First, we recall some known geometrical and statistical properties on high-dimensional spaces and provide the theoretical framework of our analysis. Then, we introduce the Separabiliy Marker, a marker of class separability for binary classification problems under the Rieman-nian geometry framework. Then, we propose an ensemble learning method that make use of the Separability Marker and combines the transfer learning methods of chapter 3. We discuss our results and conclude this chapter.
Chapter 7 In chapter 7, we propose a proof of concept for a novel unsupervised
method applied to the P300-Speller. We introduce our method and provide prelim-inary results that prove its feasibility. We discuss those results and conclude the chapter.
Finally, we conclude this thesis with a general discussion on our results and future perspectives.
NOTATIONS
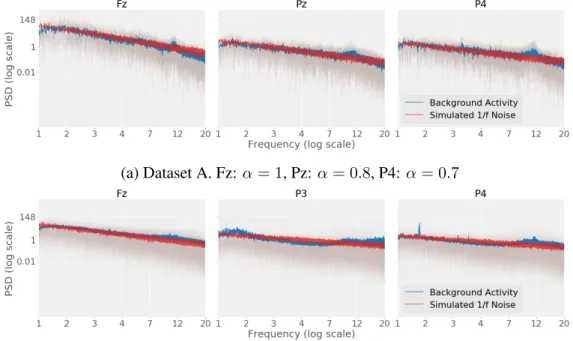
α Parameter of the pink noise process . . . 26
¯ Σ Riemannian mean. . . 80 ¯ δN Expected value of δNi . . . 82 ¯ δT Expected value of δTi . . . 82 ¯
snp Average ERP peak amplitude . . . 44
∆ Set of time sample differences denoting peak latency variability . . . 44
δN Probability distribution of the distance of a nontarget feature vector to the
nontarget class center. . . 81
δT Probability distribution of the distance of a target feature vector to the target
class center. . . 81
δC Average distance between a feature and its class center. . . 79
δI Average distance between two same-class features. . . 79
δi Dirac distribution at location i . . . 35
dE Euclidean distance . . . 80
dR Riemannian distance . . . 32
γ0 Transport plan, optimal transport solution . . . 35
ˆ
XNl Proxy narget average . . . 95
ˆ
| Matrix transpose . . . 21
1I I-dimensional vector of ones. . . 35
dκ Vector that contains the non-zero elements of matrix ˜Dtfor the κ
thtarget
stimulus . . . 45
J Set of stimulus onset time samples. . . 44
S Feature vectors and labels of a BCI session . . . 35
X Sample of feature vectors . . . 28
Y Sample of labels . . . 28 M Riemannian manifold . . . 80 B Set of couplings . . . 35 D Domain . . . 28 Ds Sourcedomain . . . 28 Dt Targetdomain . . . 28
Ic Set of feature vector indices corresponding to class c . . . 35
T Classification task . . . 28
Ts Sourceclassification task . . . 28
Tt Targetclassification task. . . 28
X Feature space. . . 28
Y Label space . . . 28
µs, µt Empirical measures of source and target probability distributions . . . 35
σb Standard deviation of the distribution used to model Nb. . . 49
NOTATIONS xxiii
ΣAt Covariance matrix of the archetype target (P300) signal . . . 21
σadd Standard deviation of the distribution used to model Na. . . 50
σamp Standard deviation of the distribution from which a
κare drawn . . . 49
σlat Standard deviation of the distribution from which δ
κare drawn . . . 49
ΣX Covariance matrix of the EEG signal. . . 21
P(·) Probability distribution . . . 28 ˜
J Set of stimulus onset time samples with peak latency variability . . . 44
˜
Σi Extended covariance matrix. . . 34
˜
Dt Diffusion matrix of target response with peak latency variability . . . 44
˜
Xi Extended trial . . . 34
A Set of aκ. . . 46
d First column of a Distribution matrix . . . 25
Dt Diffusion matrix of target response including both peak latency and
ampli-tude variability . . . 46
gi Source signal contribution to sensor i . . . 42
Gl Set of stimulus indices where the flashing group contains l . . . 95
nb Pink noise process of a single source. . . 49
pi Probability vector . . . 8
s Source signal vector. . . 44
s(t) Source signal vector at time t. . . 42
sf Sensory archetype response of a single source . . . 49
st Target archetype response of a single source . . . 49
xi Feature vector . . . 8
XlN Proxy nontarget trials . . . 95
XlT Proxy target trials . . . 95
aκ Contribution of the average ERP peak amplitude to the κ-th stimulus. . 44
Af Archetype sensory response EEG signal. . . 44
An Archetype nontarget EEG signal. . . 25
At Archetype target (P300) EEG signal . . . 21
C Cost matrix . . . 35
D Distribution matrix modeling the distribution of stimuli in time. . . 25
d Dimensionality of feature space . . . 35
Dn Distribution matrix modeling nontarget stimuli . . . 25
Dt Distribution matrix modeling target stimuli . . . 25
G Gain matrix / Forward model . . . 43
I Identity matrix . . . 50
IN Number of instances of the nontarget response . . . 33
Is Cardinality of the source dataset. . . 35
IT Number of instances of the target response . . . 25
It Cardinality of the target dataset . . . 35
Ic Number of sensors . . . 8
If Dimension of spatially projected signal . . . 8
NOTATIONS xxv
In Number of feature vectors in X . . . 28
Is Number of brain activity sources . . . 42
It Number of time samples . . . 21
Iw Number of time samples in signal segment . . . 8
jκ Indices of nonzero elements of d, κ ∈ {1, ..., I
T
} . . . 25
KC Sectional curvature of M. . . 79
l Keyboard character . . . 95
N Noise matrix . . . 43
Na Noise uncorrelated to source activity. . . 46
Nb Background brain activity . . . 46
np Time sample of the peak latency . . . 44
Pn(R) Set of n × n Symmetric Positive Definite matrices . . . 31
S Signal matrix of source brain activity . . . 43
Sf Sensory archetype response in source space . . . 46
Sn Nontarget archetype response in source space . . . 46
St Target archetype response in source space . . . 46
SM Separability marker . . . 81
T pM Tangent space of manifold M at point p. . . 79
V Spatial projection matrix. . . 8
X EEG signal . . . 8
Xi EEG signal time segment (Trial). . . 8
INl Cardinality of XlN . . . 95
ITl Cardinality of XlT. . . 95
PART I
CHAPTER 1
ERP-BASED BRAIN COMPUTER INTERFACES
This chapter provides a background on ERP-based BCI. We first introduce the ERP-based BCI system and provide a short history of its conception and evolution. We then proceed to detail the system and provide state-of-the art references for each component. We detail the issue of BCI calibration and briefly mention some of the existing solutions. We conclude by presenting our approach towards zero-calibration BCI, which is the the main objective of this thesis.
1.1 Introduction
An ERP-Based BCI is a system composed of several components. During each session, these components interact with each other and with the user in a closed loop. In general, a BCI session refers to the continuous use of a BCI during which the user does not remove the EEG acquisition device. Each one of these components can be seen as pipeline which comprises different subcomponents. A set of functions and parameters are linked to each subcomponent. In a state-of-the art system for a visual P300-Speller, we identify four main components: (i) interface (ii) acquisition
(iii) information extraction (iv) system update. These are outlined in figure1.1.
Note that this particular taxonomy can be generalized to different ERP-based BCI as well.
This thesis focuses on the sources of EEG variability. In particular, we are interested to detail how this variability affects the system performance and what parameters can be modified or adapted to resolve the issues that arise because of that variability. The design of an adaptive ERP-Based BCI necessitates a solid understanding of how each system component is designed and how it interacts
organized in the following way. First, we provide a brief history of ERP-Based BCI.
We the detail the system components presented in figure1.1one by one. Finally,
we expose and discuss the pre-BCI use calibration issue.
1.2 Brief History of ERP-based BCI
The first BCI to use ERPs was detailed in 1988 by Farwell and Donchin [Farwell
and Donchin,1988]. Its objective is to allow the user to spell words by means of an on-screen grid-like keyboard, whereby rows or columns are flashing. The user has to attend the screen and concentrate on the character they wish to spell, disregarding the rest of the characters on the keyboard. This task can be viewed as a covert discrimination task between two types of occurrences: either the row or column flashing contains the desired character, or not. This BCI paradigm relies on the elicitation of a well-studied ERP component, known as the P3b, the late positive complex, or simply, the P300.
Donchin et al. proved the feasibility of this ERP-based speller [Donchin et al.,
2000], which has since been studied and used extensively under the name
P300-Speller. Recent studies focus on achieving better performances by either optimizing
the signal processing and classification framework [Blankertz,2004;Guger et al.,
2009b; Rivet et al.,2009;Blankertz et al.,2011; Kindermans et al.,2012a], or by modifying the decision process and the way items are presented on-screen. [Townsend et al.,2010; Thomas et al., 2014; Mattout et al., 2015]. The P300 component has also been used in a BCI gaming application, presented by Congedo
et al. [Congedo et al.,2011], in which the user is playing a P300-based BCI version
of the arcade game “alien invaders”.
Other ERP components have been used in BCI besides the P300. The N400, a negative component which is related to recognition of meaningful stimuli, has
been used in a P300-Speller-like BCI by Kaufmann et al. in [Kaufmann et al.,
2011]. The authors propose to replace flashing keys with familiar faces, which
elicit the N400 component and facilitate trial classification. The Error Potential, a component elicited not by a conventional stimulus but by the recognition of a mistake, has also been used in a number of BCI paradigms. Mattout et al. use the
Error Potential as a spelling correction tool in a P300-Speller [Mattout et al.,2015].
ERP-based Brain Computer Interfaces 5
control an on-screen item.
In the remainder of this thesis, we are mainly considering the P300-Speller paradigm. In the following section, we detail the four main components of a
P300-Speller system, depicted in figure1.1.
1.3 The BCI System
1.3.1 The Interface
The interface is the point where the user and the system immediately interact. The interface component receives constant updates from the system update com-ponent. According to that information, it generates stimuli or provides feedback to the user. The user generates EEG signal which is subsequently recorded by the acquisition component. Hence, the interface encloses everything that is related to the task and the user. Task-related parameters include the choice of the paradigm and the strategy that should be employed by the user to achieve the desired result. These are often selected by the experimenter. In a P300-Speller, the screen displays a keyboard on which groups of characters are flashing. The user is asked to count incrementally every time he sees a flash on the character he wishes to spell. The interface holds parameters such as the groups of characters that flash and the interval between two flashes.
In ERP-based BCI, user-specific mental states and characteristics, such as arousal levels, mood and mental workload directly affect the temporal pattern of
the ERP [Polich and Kok,1995;Polich,2009;Jeunet et al.,2016;Mladenovic et al.,
2018]. Moreover, they are subject to a high amount of variability across different
users [Lotte and Jeunet,2015;Jeunet et al.,2016]. This has a direct impact on the
rest of the system. In particular, the information extraction component needs to be adjusted accordingly to deal with the resulting variability in the EEG signal.
1.3.2 EEG Acquisition and Processing
The acquisition component is responsible for recording the EEG signal, pre-processing it and transmitting it to the information extraction component. Parameter choices typically concern the equipment used (EEG acquisition device, amplifier),
Figure 1.1: The four sy stem components of as tate-of-the-ar tP300-Speller ,divided into subcomponents. The data goes through the inter face component, the acq uisition component, the inf or mation extraction component, the sy stem update component and bac k to the inter face component in a closed loop. Ho w ev er ,additional interactions can tak e place betw een components that are not in the main loop. For ex ample, the inter face can directl y communicate stimulus times to the inf or mation extraction component.
ERP-based Brain Computer Interfaces 7
the choice of electrodes, and their positioning. During a non-invasive EEG-based BCI experiment, the EEG signal is acquired on the scalp through electrodes that record the electrophysiological activity that is generated from cortical neuronal
activity and transmitted through the skull and scalp [Niedermeyer et al.,2005].
EEG recordings have a very low amplitude, which is on the order of µV. Therefore the EEG measurements need to be processed by an amplifier. Typically, digital amplifiers are employed for this task which provide one discrete signal per sensor. Most amplifiers offer a sampling frequency that can range between 100 and 1000Hz. The EEG signal has the advantage of having a high temporal resolution in contrast to its poor spatial resolution, which is restricted by the number of electrodes. The number of electrodes varies with respect to the paradigm: it can range from a few electrodes up to 128 electrodes. (Note that BCI experimenters avoid using more than 64 electrodes, since the process of placing them on the scalp is lengthy and tiresome for the user.) In addition, EEG measurements have a very low Signal-to-Noise Ratio. Therefore, before extracting features of interest,the EEG signal goes through a pre-processing pipeline. Since the physiological markers of interest in ERP-based BCI live in low frequency components, the raw signal is bandpass filtered so that only those frequencies of interest are kept in the signal. Often, the signal goes through an additional downsampling step. Note that some amplifiers provide built-in signal pre-processing methods.
1.3.3 Extracting Information from the EEG signal
The information extraction components is responsible for extracting relevant information from the pre-processed EEG signal. It is often represented as a pipeline of two subcomponents which perform feature extraction and classify the resulting feature vector. For example, visual P300-Spellers rely on the detection of the P300 component, which should be elicited every time the user’s character of interest flashes. The pre-processed EEG signal is thereby given as input to the feature extraction subcomponent, along with information concerning the timing of the flashes. Its aim is to output one feature vector per flash in a way that ensures high inter-class separability and Signal-to-Noise Ratio (SNR). Each feature vector is subsequently transmitted to the classification subcomponent, which decides whether the stimulus associated to a feature vector was a target stimulus or a
nontarget stimulus and transmits the resulting vector of probabilities to the system update component. Target stimuli correspond to groups of characters that contain the character that the user wishes to spell, as opposed to nontarget.
Due to the high amount of variability in the signal and to the low SNR, advanced signal processing, feature extraction, and classification methods have been employed and incorporated within BCI systems. In ERP-based BCI, the pre-processed EEG signal X is segmented into trials of a specific duration, starting from stimulus offset. The number of time samples should be chosen so that the relevant information is contained within the time segment. Each trial can be represented as a matrix
Xi ∈ RIc×Iw, where I
c denotes the number of electrodes and Iw the number of
time samples. These trials can be converted directly into spatiotemporal features
xi ∈ RIc·Iw, where vector xi contains the rows of matrix X
i.
Alternatively, the trials are projected onto a lower dimensional subspace through
some spatial projection matrix V ∈ RIf×Ic, where I
f denotes the number of
com-ponents, i.e. the new spatial dimensionality of the signal. These spatial projection matrices are often referred to as spatial filters, since they modify the spatial di-mension of the signal. The new subspace often has a property that enhances some
relevant characteristic, such as class separability [Lotte and Guan,2011] or SNR
[Rivet et al.,2009]. These projected trials are also converted into spatiotemporal
features xi
∈ RIf·Iw.
The resulting feature vectors are given to the classifier component. The
classi-fication output usually takes the form of a vector pi
= (pi1, pi2,· · · , piIl), where p
i l
denotes the probability that the ithfeature vector belongs to class l and I
ldenotes
the number of classes. State-of-the-art classifiers for ERP-based BCI include
lin-ear classifiers such as Linlin-ear Discriminant Analysis (LDA) [Panicker et al.,2010;
Blankertz et al.,2011;Gayraud et al.,2017] and Support Vector Machines (SVM) [Rakotomamonjy and Guigue,2008]. For an extensive review of BCI classification
methods, we refer the reader to [Lotte et al.,2007,2018]
1.3.4 System Update
The system update component holds the parameters related to the decision process. In particular, given the previous state of the system and a new probability vector, it decides on the new state of the system and transmits the decision to the
ERP-based Brain Computer Interfaces 9
interface. In a P300-Speller, the system states include whether the system should continue flashing groups of characters, or if a character has been found and can be displayed on the screen. For example, the P300-Speller system designed by Thomas
et al. [Thomas et al.,2014] accumulates evidence for each character in the keyboard
and uses an early stopping criterion to decide when the evidence accumulation has converged and a character can be selected. The same criterion is applied in the work of Mattout et al., who also incorporate an error detection strategy in which the information process module has the additional task of detecting an Error Potential
at the end of each sequence of flashes [Mattout et al.,2015]. If an error has been
detected, the system update corrects the character by choosing the second most probable character.
1.4 System Calibration
In a process that precedes BCI use, the system goes through a calibration which aims to tune its parameters. These parameters typically concern the spatial filter coefficients and classification weights within the information extraction component,
as described in section1.3.3. Each BCI paradigm has its own calibration strategy.
For example, during the calibration of a P300-Speller, the system tries to extract a template of the ERP that should be generated by the user when the character he desires to spell is flashing. Therefore, the user is asked to focus on specific characters. This allows the BCI to gather labeled data and train the system pipeline. The process may last between 5 and 10 minutes, depending for example on the
quality of the acquired signals or the classifier scores [Lotte and Congedo,2016b].
While the reported performances of BCI applications have been satisfactory, state-of-the art feature extraction and classification methods have been unable
to generalize across different sessions and different subjects [Clerc et al.,2016].
This means that the system must be calibrated before each session. Regarding the classification process in particular, the high amount of variability in the EEG signal combined to the low SNR lead to changes in the feature domain. The broad use of BCIs greatly depends on discarding the need for calibration sessions. BCI users should not have to undergo the tedious calibration process each time they want to use a BCI.
learning approach is increasing in popularity in the BCI domain [Barachant et al., 2010;Kindermans et al.,2014;Barachant and Congedo,2014;Gayraud et al.,2017]. Transfer learning approaches allow for the combination of acquired knowledge, which can take the form of multiple training set or multiple classifiers. Hence, it can enable us to efficiently use information from previously acquired data to calibrate the BCI, without having to ask the user to perform an additional calibration session. Ideally, a global solution would take the form of a transfer learning method that deals with the all of the sources and types of variability in BCI simultaneously. To do that, it is imperative that we understand the variability in the EEG signal and how various transfer learning methods deal with its sources.
1.5 Conclusion
BCI are intricate systems, so the choices made for each component are directly affected by other parts of the system, and in turn affect other component choices as well. It is therefore imperative to understand how these interactions take place. For example, choosing to detect a neurophysiological marker such as the P300 component implies that the user has to perform a task that necessitates attention; that the system will present some kind of stimulus to elicit the P300; and that it will have to search for the temporal pattern that characterizes this particular component.
Calibrating the system is not a trivial task, on account of both the system complexity and the variability of EEG signals and ERP components. In spite of this variability, we aim for BCI that do not need calibration before usage. Throughout the rest of this thesis, we focus on how the variability that stems from the interfaces affects system performance and in which way the information extraction component can adapt to it. In order to render our results interpretable, we will be assuming that the acquisition and system update parameters are fixed. These parameters will be detailed when necessary. In particular, we analyze the sources of EEG variability and investigate selected adaptive machine learning methods that adjust to this variability in terms of classification performance. Finally, we assess whether this approach suffices to design zero-calibration ERP-based BCI.
PART II
CHAPTER 2
SOURCES OF VARIABILITY IN ERP-BASED BCIS
In the previous chapter, we described the ERP-based BCI system and discussed the interactions between system components. In par-ticular, we are interested in how the EEG signal variability affects system performance. Our goal is to quantify variability. In par-ticular, we are interested in retrieving parameters that allow us to determine which adaptive machine learning methods are robust to that variability. In this chapter we analyze the sources of variability in ERP-based BCI. First, we review the existing bibliography on the variability of ERP components and propose categorizations of ERP variability. Then we perform an analysis on two experimen-tal datasets. This analysis provides us with a way to parameterize EEG variability and gives us insight on the relationship between the sources of variability and their effect on the EEG signal.
2.1 Introduction
ERPs are comprised of a group of components presumed to be involved in human information processing, reflecting factors such as stimulus registration,
attention and evaluation [Michalewski et al.,1986]. The sources of ERP variability
have been the center of extensive research [Michalewski et al.,1986;Polich and Kok,
1995;Polich,2009]. Regarding the EEG signal generated during an ERP-based BCI session, we distinguish between three primary sources.
The first is the inherent variability of the ERP components. ERP variability is typically measured in terms of peak amplitude, peak latency, and scalp topography,
i.e., the amplitude change over EEG electrodes [Polich,2009]. While the variability
the same cannot be said of the P300 [Michalewski et al.,1986;Jung et al.,2001; Dalebout and Robey,1997].
The second source of variability is noise. This noise contains physiological arti-facts, such as blinks and muscle movement, technical artiarti-facts, but also background
brain activity that is unrelated to the task [Clerc et al.,2016]. EEG signals have a
very low SNR ratio, which makes ERP extraction a difficult task
The third source of variability is scalp topography, which we have already mentioned as a source of ERP variability. We put it here in a larger context which includes all factors that contribute to scalp topography variability. EEG recordings are prone to spatial variability related to the location of the sources of activity in the brain, the (dipole) orientation of the sources of activity, the location of the electrode
on the scalp, and the conductivities of the intermediate layers [Bledowski,2004;
Papageorgakis,2017]. ERPs that arise from stimulus discrimination tasks comprise other components that are related to sensory processing, namely, the sensory evoked N1, P1, N2 and P2 components. Similar to the P300, they are named after their peak latency, that is, the peak negative or positive polarity observed at a specific time after stimulus onset. The contribution of these sensory components depends on the paradigm, whether for instance the presented stimuli are auditory, or visual [Michalewski et al.,1986;Saavedra and Bougrain,2012].
The aforementioned sources of variability can occur either across different sessions, or within the same session. For the most part, variability analyses across sessions extract ERPs by averaging multiple trials. Therefore, they study the variability of the average ERP. On the other hand, single trial analyses, otherwise known as trial-to-trial analyses, reveal the variability within the same session, which is often referred to as across-trial variability. The cross-session approach provides more information on the correlation of the sources of variability (e.g. task relevance, attention) to their quantitative effects on the signal (e.g. average peak amplitude variability). Trial-to-trial analyses provide a more detailed view on these effects and allow us to have a better insight on the noise that is present in the signal, since no averaging is performed.
In the following sections, we review the different variability sources for various ERP components, such as the P300, the Novelty P3 and the N1, P1, N2 and P2 components. Then, we perform a trial-to-trial and a cross-session variability analysis on two experimental datasets.
Sources of Variability in ERP-based BCIs 15
2.2 Variability of ERP Components
2.2.1 The P300 Component
The P300 component, otherwise known as P3b or late positive component, was
first reported in 1965 by Sutton et al. [Sutton et al.,1965]. It has been observed to
arise during auditory and visual stimulus discrimination tasks. It is characterized by a recorded positive amplitude peak around 300 milliseconds after stimulus onset, which is most prominent on the middle parietal, central and frontal electrodes (Pz, Cz, Fz). Further research showed that it is elicited most strongly under the “oddball” paradigm, in which a frequently presented stimulus is interweaved by a less frequent
one. Usually, the user is asked to take notice of the latter [McCarthy and Donchin,
1976;Donchin et al.,1978;Pritchard,1981]. The P300 component is associated
with attention and memory operations [Polich,2009].
P300 variability is affected by a number of physiological and environmental
sources. Table2.1summarizes the sources of variability and the affected component
characteristics, namely peak amplitude, peak latency and scalp topography. Isreal
et al. [Isreal et al.,1980] demonstrate the effect of introducing a second task at
the same time as target-nontarget stimulus discrimination. The subjects are asked to discriminate between auditory stimuli while at the same time performing a tracking task. In this task, they were asked to correct the position of a moving cursor using a joystick with their right hand. The correct position was in the center of a screen. They show that, while the introduction of the second task decreases the peak amplitude of the P300, increasing the tracking task difficulty does not affect the waveform. A review of the sources of P300 variability was provided by
Polich et al. in 1995 [Polich and Kok,1995]. In this research, the sources of P300
variability are grouped into natural factors, which include circadian and ultradian rhythms, seasonal variations, and menstrual cycle; and environmentally induced factors, such as exercise, fatigue levels, sleep deprivation, and drug intake.
In particular, Katayama et al. [Katayama and Polich,1999] assess the variability
of the P300 (termed P3b) between auditory and visual paradigms in a 3-stimulus paradigm. Their findings demonstrate a clear difference between peak amplitude and peak latency for the two modalities. Visual stimuli generate higher peak amplitude and latency values that those generated by auditory stimuli. Nevertheless,
Table 2.1: Sources of var iability and their effects on peak amplitude; peak latency ;and scalp topog raph y of the P300 component. V ariability Sour ce Modulates P eak Am plitude Modulates P eak Latency Modulates Scalp T opograph y Ultradian Rh ythm (90 min) Yes, 12-27 µ V [ Polic h and K ok , 1995 ] Yes, 320-385 ms [ Polic h and K ok , 1995 ] -Circadian Rh ythm (Indirect) N o [ Polic h and K ok , 1995 ] 220-380 ms, cor related with body temperature and hear trate [ Polic h and K ok , 1995 ] -Food intak e Yes, 8-18 µ V [ Polic h and K ok , 1995 ] N o [ Polic h and K ok , 1995 ] -Tar get-to-Tar get Inter val, Tar get Stimulus probability Yes, 6-15 µ V (auditor y), 10-25 µ V (visual) [ Gonsal vez et al. , 2007 ; Polic h , 2009 ] -Task difficulty N o [ Isreal et al. , 1980 ] N o [ Isreal et al. , 1980 ] -Second task Yes, depending on the task [ Isreal et al. , 1980 ] N o [ Isreal et al. , 1980 ] -A uditor y vs V isual Stimulus Yes [ Kata yama and Polic h , 1999 ; Yagi et al. , 1999 ; Gonsal vez et al. , 2007 ; Polic h , 2009 ] Yes [ Yagi et al. , 1999 ; Kata yama and Polic h , 1999 ] N o [ Kata yama and Polic h , 1999 ] Task type Yes [ Polic h , 2009 ] Yes [ Polic h , 2009 ] Yes [ Polic h , 2009 ] Ex ercise Yes, 6-15 µ V (auditor y), 10-18 µ V (visual) [ Yagi et al. , 1999 ; Polic h and K ok , 1995 ] Yes, 340-380 ms (auditor y), 380-420 ms (visual) [ Yagi et al. , 1999 ; Polic h and K ok , 1995 ] -A ge Yes, <30 µ V [ Dinteren et al. , 2014 ; W alho vd and Fjell , 2002 ] Yes, 250-500 ms [ Dinteren et al. , 2014 ; W alho vd and Fjell , 2002 ; Polic h , 2009 ] -Cognitiv e per for mances Yes [ Polic h and K ok , 1995 ] Yes [ Polic h and K ok , 1995 ] -Dr ug intak e (Caffeine, Nicotine, Alcohol) Affected by Caffein and Alcohol intak e [ Polic h and K ok , 1995 ] Yes [ Polic h and K ok , 1995 ] -Fatigue Yes [ Polic h and K ok , 1995 ] Yes [ Polic h and K ok , 1995 ] -Sleep depr iv ation Yes,<18 µ V [ Polic h and K ok , 1995 ] Yes [ Polic h and K ok , 1995 ] -Sensor Position -Yes [ Clerc et al. , 2016 ]
Sources of Variability in ERP-based BCIs 17
the scalp topography appears unaffected. These findings are in accordance with
the results of Yagi et al. [Yagi et al.,1999], who also show that physical exercise
affects both P300 peak amplitude and latency.
Age is another source of variability, which is demonstrated to affect both peak
amplitude and latency [Walhovd and Fjell,2002;Dinteren et al.,2014]. According
to the findings of Dinteren et al., [Dinteren et al.,2014], who performed a meta
analysis on 75 studies, peak amplitude increases until late adolescence and gradually decreases after that, while peak latency until early adulthood and increases thereafter.
Finally, in an review on ERP components, Polich et al [Polich,2009] note the effect
of Target-to-Target interval on peak amplitude and peak latency (in accordance
with Gonsalves et al. [Gonsalvez et al.,2007]) as well as the importance of arousal
and attention. They also note that ERP components are genetically transmitted: P300 components are similar among members of the same family.
The above researches largely focus on the variability of the average ERP across
different experiments. However, as noted by Makeig et al. [Makeig et al.,2004], the
ERP average can differ significantly from the single trials it is derived from. Further research has investigated trial-to-trial variability within the same experiment to assess the degree of change in the peak amplitude and latency of single trials. In their work, Michalewski et al. study ERP components in an auditory paradigm, in order to determine the effects of latency variation on the ERP grand average [Michalewski et al.,1986]. They reported peak latency varies between 177 and 363 ms at the Pz electrode, while the peak amplitude varies between approximately 10 and 25 µV, which shows the magnitude of trial-to-trial variability. Jung et al., in results obtained in a visual 2-stimulus experiment, reveals an important amount of peak latency variability across trials in the same session, which appears to be
correlated to Response Time [Jung et al.,2001]. These results are corroborated by
Gramfort et al. [Gramfort et al.,2010].
Physiological and environmental sources of ERP variability contribute to dif-ferent types of EEG variability. EEG variability can be investigated according to two different taxonomies. First, whether it is the same individual using the BCI or not, in which case we define intra-individual variability and inter-individual
variability [Clerc et al.,2016]. Then, variability can also be studied across different
BCI sessions, or within the same session, in which case we talk about inter-session and intra-session variability. While inter-individual variability by definition refers
to different sessions, intra-individual variability can occur either across different
sessions, or within the same session. On table2.2, we propose an classification of
the sources of P300 variability presented in table2.1according to both taxonomies.
Note that, unsurprisingly, inter-individual variability gathers the largest amount of sources. Regarding intra-session variability, we assume that changes in the amount of tasks, in the task difficulty or the stimulus probability can occur within the same session.
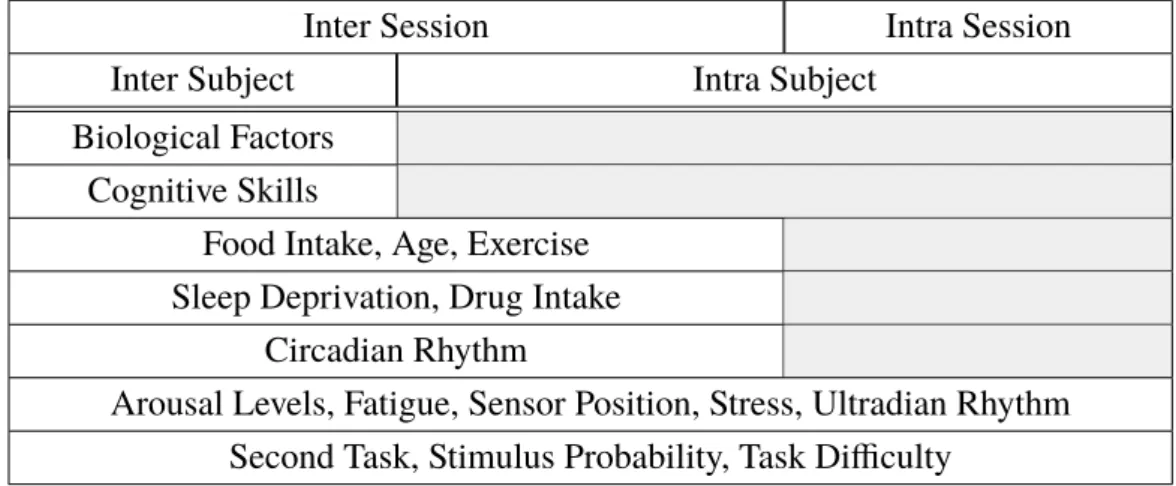
Table 2.2: A categorization of the various sources of ERP variability according to two
different taxonomies: (i) whether they occur across different sessions or within the same session; and (ii) whether they occur across different subjects or for the same subject.
Inter Session Intra Session
Inter Subject Intra Subject
Biological Factors Cognitive Skills
Food Intake, Age, Exercise Sleep Deprivation, Drug Intake
Circadian Rhythm
Arousal Levels, Fatigue, Sensor Position, Stress, Ultradian Rhythm Second Task, Stimulus Probability, Task Difficulty
2.2.2 The P3a Component
The P3a Component or “no-go” component [Polich,2009] is elicited by
dis-tractor targets, in contrast to the P300 which is related to information processing
operations. Regarding P3a variability, Polich et al [Polich and Kok,1995] note that
the P3a is more sensitive to inter-individual variability than the P300, but also point out the fact that latency variability, otherwise known as latency jitter, can affect the observations related to peak amplitude. The sources of the P3a component are found to be more central/frontal than those of the P300, suggesting that the two
components have a distinct topography [Polich,2009]. Bledowski et al locate P3a
generators in the precentral sulcus and anterior insula [Bledowski,2004].
Sources of Variability in ERP-based BCIs 19
particular ERP component, which is more prominent in the frontal lobe, is elicited by novelty targets. Its peak latency is similar to the P3a, but its peak amplitude
decreases over time due to habituation [Polich,2009].
2.2.3 Sensory Evoked Potentials
Sensory evoked potentials are low-amplitude positive and negative peaks that are generated within 200 ms after stimulus onset. These components however do not vary to the same degree as the P300 component. Michalewski et al. study the variability of the auditory N1, P1 and P2 components, which is indeed found to be
less important than the P300 component [Michalewski et al.,1986]. These results
are also corroborated by the findings of [Jung et al.,2001] and [Makeig et al.,2004].
In the same study, Michalewski et al. investigate the intertemporal relationships between the aforementioned components. The temporal correlation between them is mostly found to be low, indicating that the processes that generated them are independent.
2.3 Analysis on Experimental Datasets
2.3.1 Dataset description
We study the EEG signal and ERP variability in two experimental datasets that contain EEG signal recorded during P300-Speller calibration sessions. In these sessions, the screen displayed a keyboard on which groups of letters were flashing. More specifically, for each letter, the user was asked to focus on a particular letter, while counting incrementally the number of times it flashed. The flashing strategy consists of groups of letters flashing in specific patterns, as described in the work
of Thomas et al. [Thomas et al.,2014]. The flash ratio of target letters (that the
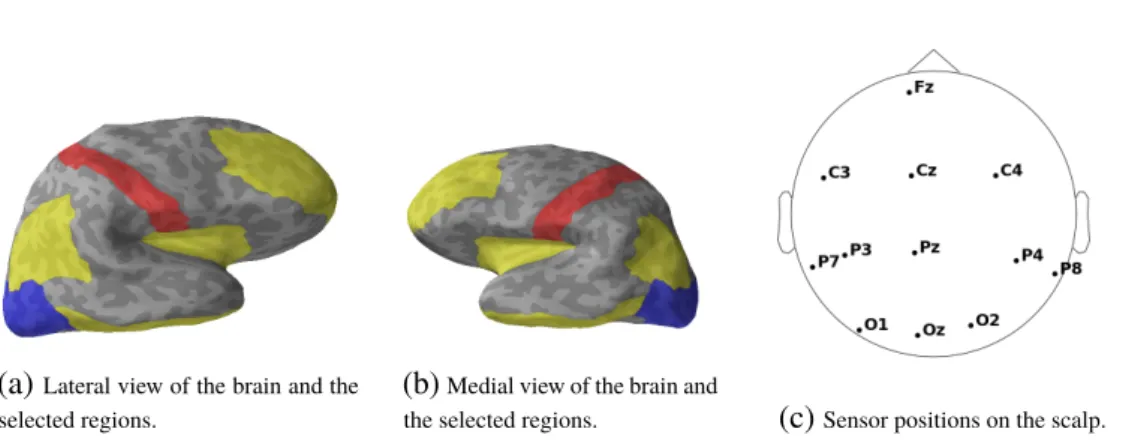
subject was asked to focused on), versus nontarget letters was set equal to 1/5. The interval between consecutive flashes was set to 300ms. The interval between two consecutive letters was set to 2s. No feedback was presented during calibration, i.e. the user did not receive any information from the system on their performance. In both experimental datasets, a Refa-8 amplifier (ANT) was used for the recording. We analyze the EEG signals of 12 electrodes (Fz, C3, Cz, C4, P7, P3, Pz, P4, P8,
O1, Oz, O2), downsampled at 64Hz and filtered with a 4th order Butterworth filter between 1 and 20Hz.
Dataset A includes EEG signals from four healthy subjects, which were recorded during P300-Speller sessions conducted in the premises of Inria Sophia-Antipolis Méditerranée. Each subject participated in three free-spelling sessions, each pre-ceded by a calibration session. Here, we only include the calibration sessions. During the calibration sessions, the subjects were asked to spell the word “CALI-BRATION”. The number of repetitions (flashes) per target letter was set to 6.
The second dataset used in our experiments, dataset B, consists of calibration sessions that were conducted by 20 adult patients suffering from Amyotrophic Lateral Sclerosis. Each subject participated in three free-spelling sessions, each one preceded by a calibration session. The experiment took place in the premises of the Nice University hospital, and had been approved by the local ethics committee
CPP Sud Méditerranée [Guy et al.,2018]. During the calibration sessions, the
subjects were asked to spell 10 random letters. The number of repetitions (flashes) per target letter was set to 20.
2.3.2 Analysis
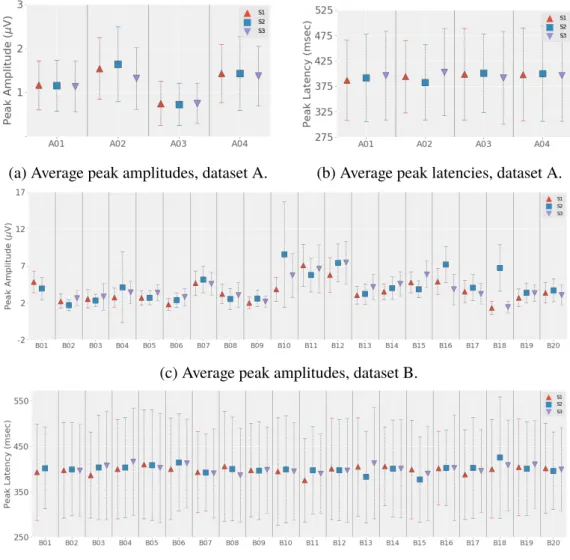
ERP component extraction and visualization We conduct a trial-to-trial
anal-ysis on the recordings of dataset A and B. The EEG signal of each session is segmented into trials lasting 0.6 seconds, starting from stimulus onset. In the
trial-to-trial analyses mentioned in section2.2, the authors used the recordings of single
electrodes, typically Pz, Cz and Fz. This allowed them to perform trial-to-trial analysis within a single session and measure the peak amplitude and latency vari-ability across trials. However, a trial-to-trial varivari-ability analysis across sessions that uses single electrode measurements does not take into account scalp topography variability.
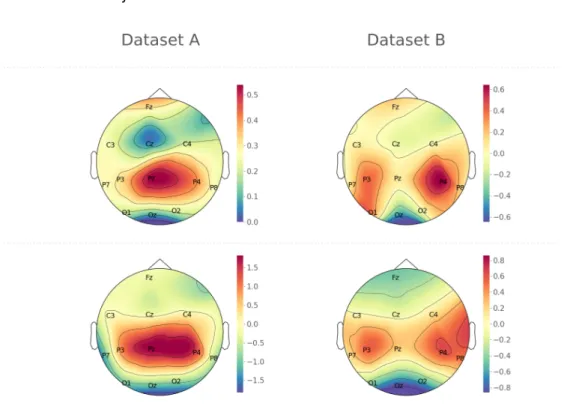
In order to study the variability of peak amplitude, peak latency and scalp topography simultaneously, we chose to extract the ERP component using the Xdawn algorithm. Xdawn is a state-of-the art feature extraction method for
ERP-based BCI, described by Rivet et al. [Rivet et al.,2011]. Let X ∈ RIc×It denote
the EEG signal acquired over Ic electrodes, where It denotes the total amount