Automated Online Solid-Phase Derivatization
for Sensitive Quantification of Endogenous
The MIT Faculty has made this article openly available.
Please share
how this access benefits you. Your story matters.
Citation
Wang, Xin, Carlos T. Garcia, Guanyu Gong, John S. Wishnok,
and Steven R. Tannenbaum. “Automated Online Solid-Phase
Derivatization for Sensitive Quantification of Endogenous
S-Nitrosoglutathione and Rapid Capture of Other
Low-Molecular-Mass S-Nitrosothiols.” Analytical Chemistry 90, no. 3 (January 9,
2018): 1967–1975. © 2017 American Chemical Society
As Published
http://dx.doi.org/10.1021/ACS.ANALCHEM.7B04049
Publisher
American Chemical Society (ACS)
Version
Author's final manuscript
Citable link
http://hdl.handle.net/1721.1/120517
Terms of Use
Article is made available in accordance with the publisher's
policy and may be subject to US copyright law. Please refer to the
publisher's site for terms of use.
Automated Online Solid-Phase Derivatization for Sensitive
Quanti
fication of Endogenous S‑Nitrosoglutathione and Rapid
Capture of Other Low-Molecular-Mass
S‑Nitrosothiols
Xin Wang,
*
,†Carlos T. Garcia,
†Guanyu Gong,
†John S. Wishnok,
†and Steven R. Tannenbaum
*
,†,‡Departments of†Biological Engineering and‡Chemistry, Massachusetts Institute of Technology, Cambridge, Massachusetts 02139, United States
*
S Supporting InformationABSTRACT: S-Nitrosothiols (RSNOs) constitute a circulating endogenous reservoir of nitric oxide and have important biological activities. In this study, an online coupling of solid-phase derivatization (SPD) with liquid chromatography−mass spectrometry (LC-MS) was developed and applied in the analysis of low-molecular-mass RSNOs. A derivatizing-reagent-modified polymer monolithic column was prepared and adapted for online SPD-LC-MS. Analytes from the LC autosampler flowed through the monolithic column for derivatization and then directly into the LC-MS for analysis. This integration of the online derivatization, LC separation, and MS detection facilitated system automation, allowing rapid, laborsaving, and sensitive detection of RSNOs. S-Nitro-soglutathione (GSNO) was quantified using this automated
online method with good linearity (R2= 0.9994); the limit of detection was 0.015 nM. The online SPD-LC-MS method has been used to determine GSNO levels in mouse samples, 138 ± 13.2 nM of endogenous GSNO was detected in mouse plasma. Besides, the GSNO concentrations in liver (64.8± 11.3 pmol/mg protein), kidney (47.2 ± 6.1 pmol/mg protein), heart (8.9 ± 1.8 pmol/mg protein), muscle (1.9± 0.3 pmol/mg protein), hippocampus (5.3 ± 0.9 pmol/mg protein), striatum (6.7 ± 0.6 pmol/mg protein), cerebellum (31.4± 6.5 pmol/mg protein), and cortex (47.9 ± 4.6 pmol/mg protein) were also successfully quantified. When the derivatization was performed within 8 min, followed by LC-MS detection, samples could be rapidly analyzed compared with the offline manual method. Other low-molecular-mass RSNOs, such as nitrosocysteine and S-nitrosocysteinylglycine, were captured by rapid precursor-ion scanning, showing that the proposed method is a potentially powerful tool for capture, identification, and quantification of RSNOs in biological samples.
S-Nitrosothiols (RSNOs) have been identified as the key biologically relevant reaction products induced by reactive nitrogen species, such as nitric oxide (NO•).1NO•is a critical signaling molecule in living organisms.2 In mammals, NO• is produced fromL-arginine by the catalytic action of nitric oxide
synthase (NOS) isoforms.3 RSNOs have been proposed as important intermediates in NO•metabolism, storage, as well as mediators in numerous NO• signaling pathways.4,5 Some primary RSNOs such as nitrosocysteine (CysNO) and S-nitrosoglutathione (GSNO), serve as endogenous NO•carriers and donors.6 Despite the considerable number of published studies in the field of RSNOs, quantification of these compounds in biological systems is still a challenge.7,8 A major obstacle to the reliable measurement of RSNOs is the lack of validated sample preparation procedures capable of assuring RSNO stability during the preanalytic steps.9,10 The chemical lability of RSNOs further complicates this problem. In addition, thiols and inorganic nitrite are usually present at high concentrations in biological matrices, so precautions must be adopted to prevent artifactual formation of RSNOs.11
The most widely used methods for RSNOs detection rely mainly on two strategies; one is based on the decomposition of RSNOs followed by detection of released NO•.6,12−14In such methods, total decomposition of RSNOs is desired, but also challenging. Besides, these methods preclude identification of multiple RSNO species because the detection is based on the released NO• and total RSNO level will be determined. The other strategy depends on the chemical derivatization of RSNOs; several reagents (e.g., organomercury compounds,15,16 sulfinic acids,17 and phosphines) have been evaluated.18−20 These reactions, however, are offline with respect to the analytical instruments, and they suffer from multiple steps that may degrade the RSNOs, or lead to sensitivity and selectivity issues. Given the limitations of the long sample preparation time in offline methods, it would be valuable to establish an
Received: October 2, 2017
Accepted: December 22, 2017
Published: December 22, 2017
Article
pubs.acs.org/ac
Cite This:Anal. Chem. 2018, 90, 1967−1975
Downloaded via MASSACHUSETTS INST OF TECHNOLOGY on February 20, 2019 at 18:24:28 (UTC).
online derivatization and detection approach that is amenable to automation.
Polymer monolith is attractive for sample pretreatment due to its easy preparation, high permeability, large surface area, and good control of porosity.21Monolithic capillary columns have been important in solid-phase extraction;22 their use for derivatization, however, is relatively rare. We chose polymer monolith as a support medium for derivatization for several reasons. On the one hand, monolithic columns are easily synthesized in situ using appropriate mixtures of monomers, cross-linkers, and porogenic solvents, and therefore, diverse polymer monolithic materials can be tailored.23In addition, the biocompatibility of the monolith allows the direct analysis of complex biological samples with no manipulations other than dilution or centrifugation, to simplify the entire procedure.24,25 In this study, poly(methacrylic acid-co-ethylene dimethacrylate) (poly(MAA-co-EDMA)) monolith was used as the monolithic support for derivatization because this weak cation exchange monolith can be modified on the basis of ion-exchange and hydrophobic interactions, cope with biological samples, and avoid irreversible protein adsorption.26
Here, we describe a novel online solid-phase derivatization coupled with a liquid chromatography−mass spectrometry (online SPD-LC-MS) technique that enables rapid discovery and sensitive quantification of endogenous low-molecular-mass RSNOs. The analytes are transferred to the monolith (solid phase) where they are derivatized (so-called solid-phase derivatization (SPD)). An automated platform with two pumps and two switching valves and all experimental procedures were programmed and controlled by the LC-MS workstation. As the main low-molecular-mass RSNO com-pound in mammalian cells, GSNO was selected as test compound for method optimization and validation.27We also
demonstrated that this new online SPD-LC-MS method could capture other endogenous RSNOs (e.g., CysNO and S-nitrosocysteinylglycine (GlyCysNO)).
■
EXPERIMENTAL SECTIONChemicals and Reagents. 3-(Trimethoxysilyl) propyl methacrylate, methacrylic acid (MAA), ethylene dimethacrylate (EDMA), toluene, dodecanol, and azobis(isobutyronitrile) (AIBN) were purchased from Sigma-Aldrich (MO, U.S.A.). Fused-silica capillaries with 530μm i.d. × 720 μm o.d. were obtained from Polymicro Technologies. Acetonitrile (ACN), methanol, acetone, and formic acid of LC grade were also from Sigma-Aldrich (MO, U.S.A.). Ultrapure water was obtained using an in-house purification system. Mercury chloride (HgCl2), ethylenediaminetetraacetic acid (EDTA), potassium
dihydrogen phosphate (KH2PO4), mPEG-maleimide, sodium nitrite, glutathione (GSH), and 13C2,15N-labeled G*SH were
from Sigma-Aldrich (MO, U.S.A.) and were used without additional purification. Vivaspin 3000 MWCO membrane filters were from Sartorius Stedim (NA, U.S.A.). All sample preparations were carried out in the dark at 4 °C unless otherwise stated. GSNO, 13C2,15N-labeled G*SNO and
2-[1-(dimethylamino)ethanethioate]triphenylphosphine (derivatiz-ing reagent) were synthesized as described earlier18and were confirmed by LC/ESI-HR-MS (seeFigure S-1and Supporting Information for details).
Preparation of poly(MAA-co-EDMA) Monolithic Col-umn. The inner surface of the fused-silica capillary (8 cm× 530 μm i.d.) was derivatized with 3-(trimethoxysilyl) propyl methacrylate before the polymerization reaction.28The poly-(MAA-co-EDMA) monolithic column was prepared by a one-step thermally initiated polymerization. A prepolymerization solution that consisted of 3.3% (w/wtotal) MAA, 29.1% (w/
Figure 1.Experimental setup and configurations of (A) the offline SPD with LC-MS and (B) automated online SPD-LC-MS for the analysis of GSNO. The experimental sequence involves activation (A1 and B1), modification (A2 and B2), derivatization (A3 and B3), and detection (A4 and B4); operation B is the automated version of operation A.
Analytical Chemistry Article
DOI:10.1021/acs.analchem.7b04049 Anal. Chem. 2018, 90, 1967−1975
wtotal) EDMA, 7.6% (w/wtotal) toluene, 59.6% (w/wtotal) dodecanol, and 0.4% (w/wtotal) AIBN was prepared and then
drawn into the fused-silica capillary. The reaction was performed in an oven at 65°C for 16 h. Finally, the capillary column was washed with ACN to remove the residual reagents. Offline SPD/LC-MS Method. The derivatization reaction was carried out in the monolithic column. As shown inFigure 1A, the monolith was connected to a syringe via a Luerlok with the needle replaced by the monolithic column.29 The entire experimental sequence involved activation, modification, derivatization, and detection. A syringe infusion pump (Harvard Apparatus, MA, U.S.A.) was used to deliver the solution in each step. Methanol and water were used for monolith activation, and then 1 mL of derivatizing reagent (2 μg/mL) was pumped through the monolithic column at 10 μL/ min for the in situ functionalization of the poly(MAA-co-EDMA) monolith. The GSNO solution was passed through the derivatizing-reagent-modified monolithic column at 10 μL/min, reacting immediately with the reagent. This reaction solution was collected at the end of capillary tube and analyzed by LC-MS.
LC-MS experiments were done on an Agilent 1290 series LC system coupled with an Agilent 6530 Accurate-Mass Quadru-pole Time-of-Flight (QTOF) mass spectrometer (Agilent Technologies, CA, U.S.A.). The Agilent Eclipse Plus C18 column (3.5 μm, 4.6 mm × 100 mm) was used for LC-MS analysis. The optimum mobile phases were water with 0.1% formic acid (A) and ACN with 0.1% formic acid (B) at aflow rate of 0.5 mL/min. Gradient elution was applied during the separation (solution B: 30% for 9 min, 30−98% in 3 min, 98% for 2 min, 30% for 2 min). The column was at room temperature and the injection volume was 10μL.
The Agilent Dual AJS ESI source was operated in positive mode and the experimental parameters were as follows: gas temperature, 335°C; dry gas flow, 8 L/min; nebulizer, 30 psig; sheath gas temperature, 350°C; sheath gas flow, 12 L/min; and capillary voltage, 3.0 kV. The m/z scan range was from 100 to 1000 with an acquisition rate of 2 spectra/s. The ESI-QTOF was calibrated daily using the standard tuning solution from Agilent. During analysis, the instrument was calibrated in real time with two different reference masses (m/z 121.0509, 922.0098) with constant infusion (6 μL/min). Data were acquired by MassHunter Data Acquisition for Q-TOF B.05.00 (Agilent Technologies, CA, U.S.A.) and analyzed by Mass-Hunter Qualitative Analysis B.06.00 (Agilent Technologies, CA, U.S.A.).
Automated Online SPD-LC-MS Method. In order to achieve rapid and sensitive detection of endogenous RSNOs, we next developed the online SPD-LC-MS method by establishing an automated two-pump and two-valve instrumen-tal platform modified from the solid-phase microextraction system.30 We have changed the flow paths, flow rates, and switching sequence of the two valves to realize the online derivatization. The detailed workflows are illustrated inFigure 1B, with valve 1 as the injection valve of the LC system and valve 2 connected to valve 1 with PEEK tubing. The poly(MAA-co-EDMA) monolithic column (8 cm × 530 μm i.d.) was connected at the 3, 6 positions of valve 2. Prior to an experiment, the neat monolithic column was washed with methanol and water (Figure 1B1). Next, 1 mL of derivatizing reagent (2μg/mL) was delivered by pump 2 and kept flowing through the monolithic column at 10μL/min for the monolith modification. Meanwhile, the mobile phase (MPS) was driven
by pump 1 through the analytical column (Figure 1B2). During analysis, valve 1 was switched for sample injection and valve 2 was also switched from position 2 to position 1 at the same time, so the sample solution from injection loop was driven by pump 1 to flow through the derivatizing-reagent-modified monolithic column, to do the online derivatization (Figure 1B3). After switching valve 2 back to position 2, theflow of mobile phase was increased to 0.5 mL/min to initiate chromatographic separation (pump 1), while the monolithic column was remodified with the derivatizing reagent (pump 2) until the next injection (Figure 1B4). These procedures were programmed and automatically controlled by the workstation software.
The multiple reaction monitoring (MRM) mode of Triple Quadrupole mass spectrometer (QqQ MS) was used to establish a sensitive and selective quantification method. An Agilent 1100 HPLC system was interfaced to an Agilent 6430 mass spectrometer. Chromatography was based on an Agilent Eclipse Plus C18 column (3.5μm, 4.6 mm × 100 mm) eluted with a gradient of 0.1% formic acid in water (A) and 0.1% formic acid in ACN (B). A specific gradient elution program was set for this online SPD-LC-MC method (solution B: 0−8 min, 30% at 0.015 mL/min; 8.01−17 min, 30% at 0.5 mL/min; 17−20 min, 30−98% at 0.5 mL/min; 20−22 min, 98% at 0.5 mL/min; 22.01−25 min, 30% at 0.5 mL/min). The column was maintained at room temperature, and the injection volume was 100μL for online derivatization.
The QqQ MS was operated in the positive mode with nitrogen as sheath gas. The capillary voltage was 3000 V. The source gas temperature, gasflow, and nebulizer were set at 350 °C, 10 L/min, and 40 psi, respectively. Nitrogen was the collision gas with a collision energy of 10 V. The protonated molecule of derivatized GSNO (m/z 616.2) was selected as the precursor ion and the most intensive product ion (m/z 487.1) was chosen for the quantification. The quantification ion plus another specific product ion (m/z 309.1) were used for confirmation. Data acquisition was carried out by MassHunter Data Acquisition for Triple Quadrupole B.06.00 (Agilent Technologies, CA, U.S.A.) and data were analyzed by MassHunter Qualitative Analysis B.06.00 (Agilent Technolo-gies, CA, U.S.A.).
Animals. All mouse experiments were approved by the MIT Committee on Animal Care and were conducted according to the guidelines of Institutional Animal Care and Use Committee (IACUC). 6-Week old female C57BL/6NTac mice were obtained from Taconic Biosciences, Inc. (NY, U.S.A.) and housed in a controlled environment at 22± 1 °C with a relative humidity of 50± 5% under a light cycle of 12 h light/12 h dark. Food and tap water were provided ad libitum. After adjusting to the environments for 1 week, mice were euthanized by carbon dioxide (CO2) inhalation. Euthanasia was achieved by
delivering 100% CO2 from a pressurized system into an enclosed chamber containing the animal, the CO2flow rate was
adjusted to 20% of chamber volume per minute. Blood samples were collected immediately by cardiocentesis with a 1 mL syringe and 25 gauge needle. Tissues (liver, kidney, heart, muscle, and brain) were then harvested, snap-frozen in liquid nitrogen, and stored at−80 °C until analysis.
Mouse Sample Preparation.Plasma. Blood was collected into 1.5 mL EDTA-coated Vacutainer tube, and centrifuged at 4 °C to isolate plasma. Plasma (100 μL) was spiked with
13C
2,15N-labeled G*SNO (internal standard) to reach a final
concentration of 3 nM after dilution and immediately treated
with 1 mM of mPEG-maleimide in 5 mM KH2PO4 buffer containing 0.5 mM EDTA (600μL). Sample was kept 15 min at room temperature for complete blocking by mPEG-maleimide. Ice-cold ACN (300μL) was added, and precipitated proteins were separated by centrifugation (10 000g, 10 min, 4 °C). The supernatant was further ultrafiltered using Vivaspin 3000 Da filter (9000g, 30 min, 4 °C); filtrate solution (low-molecular-weight fraction) was collected and immediately analyzed by the online SPD-LC-MS system. Control GSNO-free plasma was prepared by adding HgCl2to plasma up to 30
mM to degrade the S−NO bonds.9
Tissue Sample Preparation. Tissue samples were spiked with internal standard (13C2,15N-labeled G*SNO) and
immediately mixed with mPEG-maleimide (1 mM) in 5 mM KH2PO4 buffer containing 0.5 mM EDTA; typically 1 mL of
buffer per 200 mg of tissue. Samples were then manually homogenized on ice. Lysed samples were kept 15 min at room temperature to allow complete blocking by mPEG-maleimide, and centrifuged (16 000g, 15 min, 4°C) to remove cell debris. A 30% volume of ACN was added for extraction, followed by filtration using Vivaspin 3000 Da filter (9000g, 30 min, 4 °C). The filtrate solution (low-molecular-weight fraction) of each sample was collected and analyzed by online SPD-LC-MS.
■
RESULTS AND DISCUSSIONMechanism of In-Capillary SPD. Poly(MAA-co-EDMA) monolith was selected as the monolithic support for in-capillary SPD mainly because this weak cation exchange polymer monolith can be easily derivatized with 2-[1-(dimethylamino)-ethanethioate]triphenylphosphine at a suitable pH value (pH 6.0). As shown in Figure 2, the derivatizing reagent was extracted and attached to the surface of monolith via ion-exchange interactions in situ between the amino group of the derivatizing reagent and the carboxyl group on the monolith. GSNO solutions were then introduced to the modified monolithic columns for derivatization. Mechanistically, the reaction between GSNO and the derivatizing reagent forms an aza-ylide product. Because the sulfur atom in the reagent is
directly bonded to the phenyl ring, the resulting aza-ylide leads to a pseudo-sulfenamide intermediate which is then attacked by the intramolecular phenylthiolate to yield a disul fide-iminophosphorane structure 1. This intermediate is further hydrolyzed to produce the phosphoryl-disulfide product 2 (derivatized GSNO).18,31
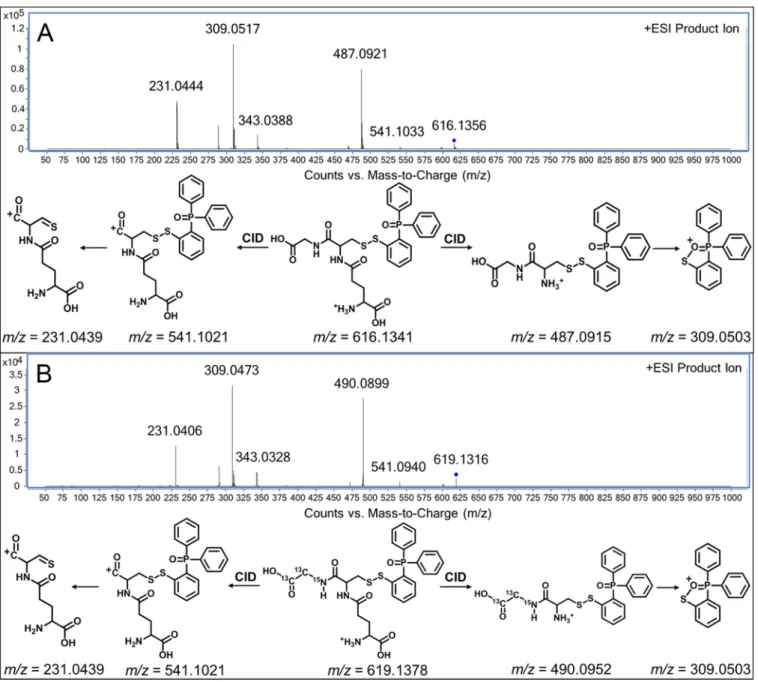
The derivatized GSNO (product 2) was detected by QTOF MS in positive mode (monitored/expected masses, m/z = 616.1356/616.1341 [M + H]+). MS/MS analysis confirmed
this identification (Figure 3A). The characteristic peak at m/z 487.0921 represented the loss of glutamate; while the m/z 309.0517 signal was the fragment from the derivatizing reagent, and the ion at m/z 231.0444 was a specific fragment of Glu-Cys. Based on the accurate mass of the precursor ion and these fragments, the molecule with m/z of 616.1356 was determined as product 2. To confirm the structure of derivatized GSNO and the mechanism of in-capillary SPD, the derivatization was carried out with 13C2,15N-labeled G*SNO. Compared to the
unlabeled products, the precursor ion at m/z 619.1316 and the characteristic fragment ion of m/z 490.0899 contained the
13C
2,15N-labeling, while the fragment from the derivatizing
reagent (m/z 309.0473) and fragment of Glu-Cys (m/z 231.0406) did not contain any labeled atoms (Figure 3B).
Optimization of In-Capillary SPD Conditions. An offline SPD/LC-MS method was developedfirst to demonstrate that in-capillary derivatization could be achieved by the reaction of GSNO with derivatizing reagent via the in situ modified poly(MAA-co-EDMA) monolithic column, as described in the
Experimental Section (Figure 1A). Parameters affecting the derivatization reaction, such as pH, ionic strength, and organic solvent content of sample loading solution, were investigated.
As illustrated in Figure 4A, the pH of the sample loading solution has great influence on the derivatization process. The effect of pH was evaluated in the pH range of 3.0−8.0, and the highest derivatization efficiency was achieved in the pH range of 5.0−7.0. This may be related to the interactions between derivatizing reagent and monolithic column. Over the pH range of 5.0−7.0, the derivatizing reagent was protonated and
Figure 2.Proposed reaction pathways of in-capillary SPD when GSNO reacts with the derivatizing-reagent-modified monolithic column.
Analytical Chemistry Article
DOI:10.1021/acs.analchem.7b04049 Anal. Chem. 2018, 90, 1967−1975
interacted with the ionized carboxyl groups on the monolithic column via ion-exchange interactions, keeping the column
well-modified. With a pH of sample loading solution lower than 5.0 or higher than 7.0, the modified derivatizing reagent was eluted
Figure 3.Tandem mass spectra obtained by QTOF MS in positive mode, and fragment ions interpretations of (A) the derivatized GSNO and (B) the derivatized13C
2,15N-labeled G*SNO; collision energy: 20 V.
Figure 4.Effects of (A) the pH value, (B) the ionic strength, and (C) the organic solvent content of the sample loading solution on GSNO derivatization reaction.
from monolithic column because of the weakened ion-exchange interactions; the derivatization reaction was inhibited in this case. In addition, the eluted derivatizing reagent itself had a strong MS signal in the positive mode, which suppressed the ionization of derivatized GSNO, thus decreasing the derivatiza-tion efficiency. The sample loading solution at pH 5.0 was therefore chosen for the in-capillary SPD.
The effect of ionic strength was also studied. Both competing adsorption and kinetic salt effect were observed. When the KH2PO4concentration was lower than 15 mM, the increase in
ionic strength resulted in competing adsorption and decreased the derivatization efficiency. When the KH2PO4concentration increased from 15 to 80 mM, the kinetic salt effect was more significant, and the derivatization efficiency was improved.32,33 Finally, 5 mM of KH2PO4 was selected for the following
experiments (Figure 4B).
Our study indicated that proper addition of ACN would benefit the derivatization reaction, so the ACN content of sample loading solution was optimized systematically for in-capillary SPD.Figure 4C demonstrated that the derivatization efficiency increased significantly with increasing ACN content from 10% to 30% (v/v), which was consistent with the previous study.18However, the derivatization efficiency decreased when ACN content exceeded 30% (v/v), this may occur because the elution ability of the sample loading solution was enhanced at high ACN concentrations, and caused the elution of modified derivatizing reagent from the monolithic column. Conse-quently, the optimized sample loading solution was 5 mM of KH2PO4at pH 5.0, with the addition of 30% ACN.
Automated Online SPD-LC-MS. Following development of the offline SPD/LC-MS method, we configured an automated online SPD-LC-MS system based on a two-pump and two-valve platform in order to ensure high throughput, sensitivity, and reproducibility for GSNO quantification. The key point of realizing the online derivatization was to set a specific sequence for switching of the two valves, to automatically perform the modification of monolithic column and finish the derivatization reaction, followed by LC-MS analysis. The detailed workflows are illustrated in Figure 1B. The neat poly(MAA-co-EDMA) column was washed by methanol and water, then modified by derivatizing reagent prior to analysis. During online derivatization, the derivatizing reagent reacted with GSNO, so the amounts of derivatizing reagent attached to the monolith surface were reduced. As a result, we needed to remodify the monolithic column after each injection to achieve satisfactory reproducibility. We successfully added this remodification step into the automated online
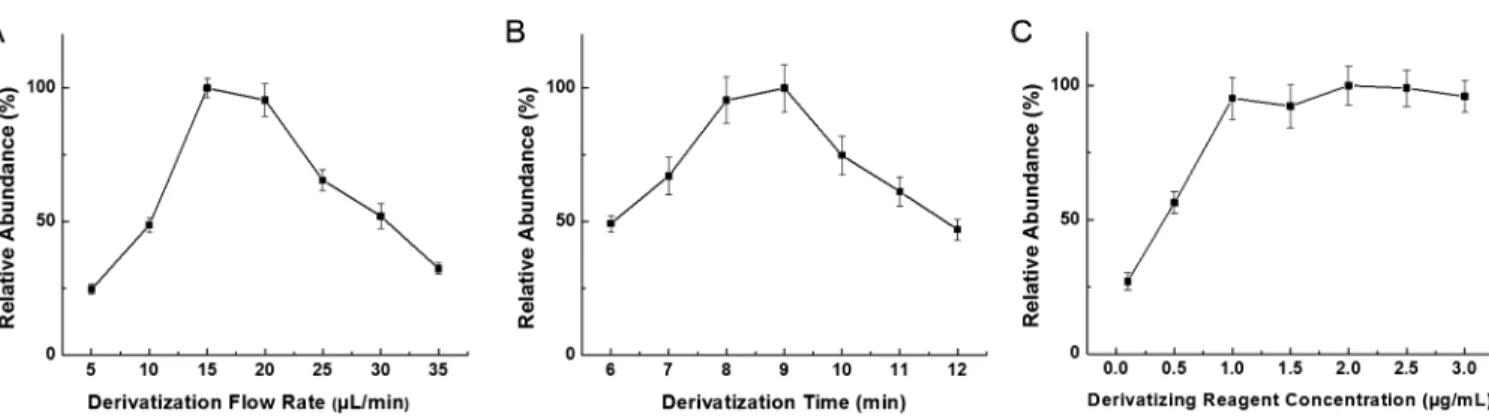
system to facilitate continuous injections. As shown inFigure 1B4, LC-MS analysis was conducted after derivatization (pump 1), at the same time, the monolithic column was remodified by the derivatizing reagent (pump 2) until the next injection. The crucial operating parameters in this system, including theflow rate and reaction time of online derivatization, and concen-tration of the derivatizing reagent, were optimized to obtain the best detection sensitivity for GSNO.
Figure 5A shows that theflow rate of online derivatization is important. In the beginning, the MS signal increased along with the increase offlow rate, and the best signal was acquired at 15 μL/min. Decreased MS signals were detected for larger flow rates, because of the dilution effect of MPS, so 15 μL/min was chosen as a preferableflow rate for online derivatization.
Next, the effect of reaction time on GSNO online derivatization was studied from 6 to 12 min (Figure 5B). Incomplete reaction was observed when the time was shorter than 8 min. Moreover, chromatograms showed peak splitting starting from 9 min of derivatization. Even though the highest MS signal was obtained at 9 min, the derivatization time of 8 min was eventually used for GSNO quantification considering the chromatographic peak shape and quantitative accuracy.
After each injection, the monolithic column was remodified by derivatizing reagent during the LC-MS analysis. The concentration of derivatizing reagent was investigated to optimize this remodification procedure. Signal intensities of the derivatized GSNO were measured while increasing derivatizing reagent concentration from 0.1 μg/mL to 3 μg/ mL. As illustrated inFigures 5C, the MS signal increased with the increased derivatizing reagent concentration until 1μg/mL, then reached the maximum signal intensity. When this concentration went beyond 1μg/mL, monolith was saturated by the derivatizing reagent in the process of remodification, thus the MS signal showed no additional increases. A derivatizing reagent concentration of 2 μg/mL was selected for quantification.
Method Validation and Application. The optimized online method notably increased the sensitivity of GSNO detection compared with the offline mode; this might be ascribed to the online interface of SPD and LC-MS. Theflow rate of derivatization reaction was only 15 μL/min, while the flow rate of LC-MS analysis was 0.5 mL/min. So after derivatization, the derivatized GSNO was enriched at the analytical column head and thenflushed into the column when the flow rate of mobile phase was increased to 0.5 mL/min. This “enrichment effect” improved the sensitivity. Typical MRM chromatograms of the derivatized GSNO and derivatized
Figure 5.Optimization of the crucial operating parameters in automated online SPD-LC-MS method for GSNO analysis; (A)flow rate of online derivatization, (B) reaction time of online derivatization, and (C) concentration of the derivatizing reagent used for modification.
Analytical Chemistry Article
DOI:10.1021/acs.analchem.7b04049 Anal. Chem. 2018, 90, 1967−1975
13C
2,15N-labeled G*SNO analyzed by online SPD-LC-MS are
illustrated inFigure S-2. The qualitative ion was at m/z 309.1, the ions at m/z 487.1 and m/z 490.1 were selected as quantitative ions for derivatized GSNO and derivatized
13C
2,15N-labeled G*SNO, respectively. So the transitions of
m/z 616.2 → 487.1 and m/z 619.2 → 490.1 were used for quantification. A matrix-free calibration curve was constructed by plotting the signal intensity versus concentration, and relative signal intensity to the internal standard (3 nM of
13C
2,15N-labeled G*SNO) was used for compensating signal
fluctuations during analysis. Satisfactory linearity was obtained in the range of 0.06−30 nM with a linear coefficient of R2 =
0.9994 (Figure S-3). The limit of detection (LOD, S/N = 3) and limit of quantification (LOQ, S/N = 10) were 0.015 and 0.054 nM, respectively, which is so far the most sensitive method for GSNO quantification. The precision of the method was assessed by measuring the intraday and interday relative standard deviations (RSDs) at three concentration levels; the RSDs were all below 10% (Table S-1). Therefore, this newly established online SPD-LC-MS method is highly sensitive and quite stable, which is promising for the analysis of GSNO in biological samples.
Finally, the online method was used to analyze GSNO in mouse plasma. Figure 6A shows the MRM chromatogram of derivatized GSNO in the plasma sample. We further diluted the plasma 10 times and 100 times with optimized sample loading solution in order to accurately quantify the GSNO concen-tration through the calibration curve (Figure 6B,C). As a result, 1.38± 0.132 nM of endogenous GSNO was determined in the 100 times diluted plasma samples, suggesting that the naturally occurring GSNO of 138± 13.2 nM was detected from mouse plasma. Spiking experiments were then performed in the 100 times diluted plasma to assay the accuracy of this method. The recoveries were found to be 90.4% for the sample spiked with 0.15 nM GSNO, 95.8% for the sample spiked with 1.5 nM GSNO, and 103.6% for the sample spiked with 15 nM GSNO (Table S-1). Due to the matrix-free calibration curve determined in the experiment, recoveries of this method can be used to evaluate the matrix effect.21,34The recoveries were in the range of 90.4 to 103.6% with RSDs below 10%, indicating that this method did not suffer a negative matrix effect and was applicable to the analysis of endogenous GSNO in complex samples. Additionally, a negative control was prepared by addition of 30 mM (final concentration) HgCl2 to mouse plasma, to degrade the S−NO bonds.9As expected, no GSNO signal was observed after treatment with HgCl2(Figure 6E).
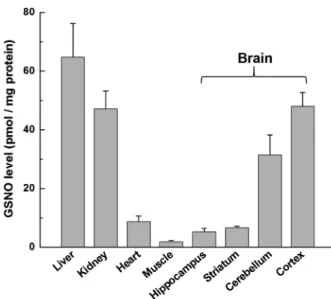
To further understand the GSNO distribution in 7-week old mice, we measured GSNO levels in several tissues, including the liver, kidney, heart, muscle, and brain (hippocampus, striatum, cerebellum, cortex). The results are illustrated in
Figure 7; large amounts of GSNO were detected in liver, kidney, cortex, and cerebellum, reflecting previous observations that NOS activity was high in the brain, liver, and kidney of rats;35 and NOS expression in the brains of rats and mice occurred mainly in the cortex and cerebellum.36,37 Table S-2
also lists the references for endogenous GSNO/RSNOs detection in plasma samples and mouse tissues.
Capture of Other Endogenous Low-Molecular-Mass RSNOs. Based on fragmentation analysis, the common qualitative ion (m/z 309.1) was produced by breaking the disulfide bond of derivatized GSNO and derivatized G*SNO internal standard (Figure 3). We speculated that other
endogenous low-molecular-mass RSNOs could also react with the derivatizing reagent and, upon CID, produce the m/z 309.1 product ion. Precursor-ion scanning was consequently con-ducted with m/z 309.1 as the product ion over a precursor ion scan window from m/z 100−1000. CysNO and GlyCysNO were detected in mouse samples. Taking CysNO as an example, precursor-ion scanning revealed an intense molecular ion peak at m/z 430.1, which matched the theoretical m/z value of derivatized CysNO (Figure S-4). MS/MS analysis was then performed in positive mode (Figure S-5). The characteristic product ion of CysNO at m/z 87.1 and the common product ion at m/z 309.1 confirmed the identity, suggesting that the transitions of m/z 430.1→ 309.1 or m/z 430.1 → 87.1 can be used for CysNO quantification in future studies. The LOD was found to be 0.198 nM for CysNO analysis by using the m/z 430.1 → 309.1 transition. In analysis of samples from three mice, CysNO was detected in tissues including liver, kidney, heart, muscle, hippocampus, striatum, cerebellum, cortex, and plasma; GlyCysNO was detected only in liver and cortex. From the above, it is apparent that this automated online
SPD-LC-Figure 6. MRM chromatograms of the derivatized GSNO and derivatized G*SNO internal standard obtained by online SPD-LC-MS method. (A) mouse plasma, (B) 10 times diluted plasma sample, (C) 100 times diluted plasma sample, (D) 3 nM of G*SNO internal standard signal, and (E) 30 mM HgCl2-treated plasma (injection
volume: 100μL).
MS method may open a new window for the determination of endogenous low-molecular-mass RSNOs, and which couldfind additional applications in biological analysis for understanding the crucial roles of RSNOs in cell signaling and homeo-stasis.38−40
■
CONCLUSIONSIn the present paper, we have reported a simple, rapid, and fully automated online SPD-LC-MS technique for the detection and quantification of endogenous GSNO. Polymer monolithic column containing methacrylic acid was prepared in the capillary and connected to the two-pump and two-valve platform for online derivatization. By combining online SPD with LC-MS, the sensitivity of GSNO analysis was greatly improved benefiting from the derivatization and the “enrich-ment effect” in the new method. We have successfully detected endogenous GSNO in mouse plasma and tissues. Besides, this online SPD-LC-MS method has been extended to the capture of other low-molecular-mass RSNOs, including CysNO and GlyCysNO. Future studies could focus on discovery of changes in RSNOs species and concentrations under specific conditions or disease states, which would actually be of significance and help further our understanding of the physiological roles of RSNOs in various biological systems.
■
ASSOCIATED CONTENT*
S Supporting InformationThe Supporting Information is available free of charge on the
ACS Publications website at DOI: 10.1021/acs.anal-chem.7b04049.
Details of the preparation and characterization of GSNO,
13C
2,15N-labeled G*SNO and derivatizing reagent,
addi-tional figures as described in the text (Figure S-1 to Figure S-5), method validation table (Table S-1), and summary of references for endogenous GSNO/RSNO analysis (Table S-2) (PDF)
■
AUTHOR INFORMATIONCorresponding Authors
*E-mail: [email protected]. Tel: (617) 253-3729. Fax: (617) 252-1787.
*E-mail:[email protected].
ORCID
Steven R. Tannenbaum:0000-0003-1819-3181 Notes
The authors declare no competingfinancial interest.
■
ACKNOWLEDGMENTSThis work was supported by the National Institutes of Health (U.S.) Grants CA26731 and ES-002109. We thank Uthpala Seneviratne for reviewing our paper and offering helpful advice.
■
REFERENCES(1) Zhang, C. H.; Biggs, T. D.; Devarie-Baez, N. O.; Shuang, S. M.; Dong, C.; Xian, M. Chem. Commun. 2017, 53, 11266−11277.
(2) Hess, D. T.; Matsumoto, A.; Kim, S. O.; Marshall, H. E.; Stamler, J. S. Nat. Rev. Mol. Cell Biol. 2005, 6, 150−166.
(3) Forstermann, U.; Sessa, W. C. Eur. Heart J. 2012, 33, 829−837. (4) Broniowska, K. A.; Hogg, N. Antioxid. Redox Signaling 2012, 17, 969−980.
(5) Smith, B. C.; Marletta, M. A. Curr. Opin. Chem. Biol. 2012, 16, 498−506.
(6) Baldim, V.; Ismail, A.; Taladriz-Blanco, P.; Griveau, S.; de Oliveira, M. G.; Bedioui, F. Anal. Chem. 2016, 88, 3115−3120.
(7) Bechtold, E.; King, S. B. Antioxid. Redox Signaling 2012, 17, 981− 991.
(8) Chouchani, E. T.; James, A. M.; Methner, C.; Pell, V. R.; Prime, T. A.; Erickson, B. K.; Forkink, M.; Lau, G. Y.; Bright, T. P.; Menger, K. E.; Fearnley, I. M.; Krieg, T.; Murphy, M. P. J. Biol. Chem. 2017, 292, 14486−14495.
(9) Bramanti, E.; Angeli, V.; Paolicchi, A.; Pompella, A. Life Sci. 2011, 88, 126−129.
(10) Tsikas, D.; Schmidt, M.; Bohmer, A.; Zoerner, A. A.; Gutzki, F. M.; Jordan, J. J. Chromatogr. B: Anal. Technol. Biomed. Life Sci. 2013, 927, 147−157.
(11) Giustarini, D.; Milzani, A.; Dalle-Donne, I.; Rossi, R. J. Chromatogr. B: Anal. Technol. Biomed. Life Sci. 2007, 851, 124−139.
(12) Riccio, D. A.; Nutz, S. T.; Schoenfisch, M. H. Anal. Chem. 2012, 84, 851−856.
(13) Hunter, R. A.; Schoenfisch, M. H. Anal. Chem. 2015, 87, 3171− 3176.
(14) Ren, H.; Coughlin, M. A.; Major, T. C.; Aiello, S.; Pena, A. R.; Bartlett, R. H.; Meyerhoff, M. E. Anal. Chem. 2015, 87, 8067−8072.
(15) Bramanti, E.; Angeli, V.; Mester, Z.; Pompella, A.; Paolicchi, A.; D’Ulivo, A. Talanta 2010, 81, 1295−1299.
(16) Doulias, P. T.; Greene, J. L.; Greco, T. M.; Tenopoulou, M.; Seeholzer, S. H.; Dunbrack, R. L.; Ischiropoulos, H. Proc. Natl. Acad. Sci. U. S. A. 2010, 107, 16958−16963.
(17) Reeves, B. D.; Hilmer, J. K.; Mellmann, L.; Hartzheim, M.; Poffenberger, K.; Johnson, K.; Joshi, N.; Singel, D. J.; Grieco, P. A. Tetrahedron Lett. 2013, 54, 5707−5710.
(18) Seneviratne, U.; Godoy, L. C.; Wishnok, J. S.; Wogan, G. N.; Tannenbaum, S. R. J. Am. Chem. Soc. 2013, 135, 7693−7704.
(19) Bechtold, E.; Reisz, J. A.; Klomsiri, C.; Tsang, A. W.; Wright, M. W.; Poole, L. B.; Furdui, C. M.; King, S. B. ACS Chem. Biol. 2010, 5, 405−414.
(20) Seneviratne, U.; Nott, A.; Bhat, V. B.; Ravindra, K. C.; Wishnok, J. S.; Tsai, L. H.; Tannenbaum, S. R. Proc. Natl. Acad. Sci. U. S. A. 2016, 113, 4152−4157.
(21) Wang, X.; Li, X. J.; Bai, Y.; Liu, H. W. Chem. Commun. 2015, 51, 4615−4618.
(22) Masini, J. C.; Svec, F. Anal. Chim. Acta 2017, 964, 24−44. Figure 7. Profiling of GSNO levels in 7-week old C57BL/6NTac
mouse tissues, including the liver, kidney, heart, muscle, and brain (hippocampus, striatum, cerebellum, cortex). For each type of tissue, three biological replicates and three technical replicates for per biological sample were analyzed.
Analytical Chemistry Article
DOI:10.1021/acs.analchem.7b04049 Anal. Chem. 2018, 90, 1967−1975
(23) Nischang, I.; Causon, T. J. TrAC, Trends Anal. Chem. 2016, 75, 108−117.
(24) Wang, X.; Ma, Q.; Li, M.; Chang, C. L.; Bai, Y.; Feng, Y. Q.; Liu, H. W. J. Chromatogr. A 2013, 1317, 121−128.
(25) Arrua, R. D.; Causon, T. J.; Hilder, E. F. Analyst 2012, 137, 5179−5189.
(26) Groarke, R. J.; Brabazon, D. Materials 2016, 9, 446−478. (27) Broniowska, K. A.; Diers, A. R.; Hogg, N. Biochim. Biophys. Acta, Gen. Subj. 2013, 1830, 3173−3181.
(28) Wang, X.; Lamprou, A.; Svec, F.; Bai, Y.; Liu, H. W. J. Sep. Sci. 2016, 39, 4544−4548.
(29) Wang, X.; Li, X. J.; Li, Z.; Zhang, Y. D.; Bai, Y.; Liu, H. W. Anal. Chem. 2014, 86, 4739−4747.
(30) Moliner-Martinez, Y.; Herraez-Hernandez, R.; Verdu-Andres, J.; Molins-Legua, C.; Campins-Falco, P. TrAC, Trends Anal. Chem. 2015, 71, 205−213.
(31) Biggs, T. D.; Weerasinghe, L.; Park, C. M.; Xian, M. Tetrahedron Lett. 2015, 56, 2741−2743.
(32) Loupy, A.; Tchoubar, B.; Astruc, D. Chem. Rev. 1992, 92, 1141− 1165.
(33) Takahashi, K.; Tezuka, H.; Satoh, T.; Katsumura, Y.; Watanabe, M.; Crowell, R. A.; Wishart, J. F. Chem. Lett. 2009, 38, 236−237.
(34) Van Eeckhaut, A.; Lanckmans, K.; Sarre, S.; Smolders, I.; Michotte, Y. J. Chromatogr. B: Anal. Technol. Biomed. Life Sci. 2009, 877, 2198−2207.
(35) Thiemermann, C.; Szabo, C.; Mitchell, J. A.; Vane, J. R. Proc. Natl. Acad. Sci. U. S. A. 1993, 90, 267−271.
(36) Bredt, D. S.; Snyder, S. H. Neuron 1994, 13, 301−313. (37) Bhargava, H. N.; Cao, Y. J. Peptides 1998, 19, 113−117. (38) Bak, D. W.; Pizzagalli, M. D.; Weerapana, E. ACS Chem. Biol. 2017, 12, 947−957.
(39) Frungillo, L.; Skelly, M. J.; Loake, G. J.; Spoel, S. H.; Salgado, I. Nat. Commun. 2014, 5, 5401−5410.
(40) Rychter, M.; Gaucher, C.; Boudier, A.; Leroy, P.; Lulek, J. Int. J. Biochem. Cell Biol. 2016, 78, 156−161.