HAL Id: hal-02116954
https://hal.archives-ouvertes.fr/hal-02116954
Submitted on 1 May 2019
HAL is a multi-disciplinary open access
archive for the deposit and dissemination of
sci-entific research documents, whether they are
pub-lished or not. The documents may come from
teaching and research institutions in France or
abroad, or from public or private research centers.
L’archive ouverte pluridisciplinaire HAL, est
destinée au dépôt et à la diffusion de documents
scientifiques de niveau recherche, publiés ou non,
émanant des établissements d’enseignement et de
recherche français ou étrangers, des laboratoires
publics ou privés.
Silicon as a candidate carrier for ERE
Gilles Ledoux, M Ehbrecht, O. Guillois, F. Huisken, B. Kohn, M. Laguna, I
Nenner, V Paillard, R Papoular, D. Porterat, et al.
To cite this version:
Gilles Ledoux, M Ehbrecht, O. Guillois, F. Huisken, B. Kohn, et al.. Silicon as a candidate carrier for
ERE. Astronomy and Astrophysics - A&A, EDP Sciences, 1998, 333, pp.39 - 42. �hal-02116954�
AND
ASTROPHYSICS
Letter to the Editor
Silicon as a candidate carrier for ERE
G. Ledoux1, M. Ehbrecht2, O. Guillois1, F. Huisken2, B. Kohn2, M.A. Laguna3, I. Nenner1, V. Paillard3, R. Papoular1, D. Porterat1, and C. Reynaud1
1 CEA/DSM/DRECAM/SPAM, CE Saclay, F-91191 Gif-sur-Yvette Cedex, France
2 Max-Planck-Institut f¨ur Str¨omungsforschung, Bunsenstrasse 10, D-37073 G¨ottingen, Germany
3 Laboratoire de physique des solides, Universit´e Paul Sabatier, 118 Route de Narbone, F-31602 Toulouse Cedex 4, France
Received 3 March 1998 / Accepted 17 March 1998
Abstract. Amorphous hydrogenated carbons and their alloys
with silicon are discussed as candidate carriers of Extended Red Emission. In this respect, their photoluminescence spectra are too blue, weak and broad. By contrast, crystalline nanoparticles of pure silicon are shown to satisfy the constraints of available observations. Such dust can plausibly condense, even in carbon-rich circumstellar shells, in the form of polydispersed nuggets, either free or embedded in SiC, for instance.
Key words: interstellar medium: dust – reflection nebulae
1. Introduction
Ever since Schmidt, Cohen and Margon (1980) noticed a broad, red emission feature superimposed upon the visible continuum of HD 44179 (in the Red Rectangle), a wealth of observational data has been accumulating on this so-called Extended Red Emission (ERE), especially on the hands of Witt and collab-orators (Witt et al., 1984; see recent bibliography in Gordon et al., 1997), and Perrin and Sivan (1992,1993,1995).
Attention recently turned to the diffuse ISM, where ERE is also emitted in measurable amounts (Gordon et al., 1997; Szomoru and Guhathakurta, 1997). Altogether, these results ef-fectively constrain putative models: a) if ERE is a type of pho-toluminescence (PL), it implies a distinctly high quantum yield (≥ 1% and possibly 10%), which is a very stringent constraint; b) ERE peaks between 600 and 800 nm, with a FWHM of 120-190 nm; c) no O-rich PN shows ERE, while most C-rich PNe do (Furton and Witt (1992)); d) ERE does not seem to require very specific irradiations or temperatures.
Based on early spectroscopy by Watanabe et al.(1982), var-ious forms of amorphous hydrogenated carbons (a-C:H) were proposed as carriers of ERE: HAC (Duley, 1985; Witt and Schild,1988), QCC (Sakata et al., 1992). However, the PL of a-C:H is very sensitive to preparation conditions and subse-quent processing. According to Angus et al. (1986), PL can be observed at room temperature only for samples prepared by
Send offprint requests to: R.Papoular
low ion energy techniques, which result in soft, polymer-like materials. Even then, the absolute efficiency does not exceed 10−3(Xu et al., 1993). Besides, in this case, the gap widens and the PL peak shifts shortward of 600nm. This anti-correlation be-tween PL intensity and peak wavelength is clearly demonstrated by Fabisiak et al. (1991), using a range of substrate deposition temperatures, and by Bouree et al. (1996) and Rusli et al. (1996), using a range of ion energies. Subsequent annealing reduces the band gap, but the PL intensity also decreases. Furton and Witt (1993) tried to reverse this trend by exposure to H atoms, but seem to have arrived at the conclusion that this is not enough, and that addition of impurities should be considered, such as silicon (Witt et al., 1996), because of its much narrower band gap.
By contrast, a-Si1−x:Cx:H has been shown to luminesce rel-atively strongly, peaking at a wavelengthλmaxwhich increases monotonously with the concentration of Si (Siebert et al., 1987; Liedtke et al., 1989; Street, 1991; Tessler and Solomon, 1995). Unfortunately, it is found that the PL intensity exhibits a broad minimum as a function of x, around that value of x (slightly de-pendent upon preparation conditions), for whichλmaxhas the desired value, 700 nm. There, according to Tessler and Solomon, the efficiency is only about 0.3% at 77 K, and 0.03% at 300 K. Moreover, the spectral width of the PL peak exceeds 200 nm. Finally, such Si-rich alloys give rise to characteristic infrared features, the strongest of which appear at 2100 cm−1, 630 cm−1 and 900 cm−1(Tawada et al., 1982). These should be conspicu-ous in the sky if a-Si:C:H were abundant enough to provide the observed ERE, which does not seem to be the case.
This paper purports to show that nanometer-sized crystals of pure silicon are better candidates as regards PL efficiency, peak wavelength and bandwidth. We were prompted in this direction by the recent avalanche of data on the strong, room-temperature, red PL of porous Si (p-Si), described in Sect. 2. We were thus led to investigate in more detail nano crystallites of Si (Sect. 3), the controlled production and study of which have been pio-neered by some of us (Ehbrecht et al., 1995, 1997). For this purpose, a dedicated laboratory facility was built which allows the measurement of the PL spectrum and efficiency as a function
L40 G. Ledoux et al.: Silicon as a candidate carrier for ERE
of excitation energy, sample temperature and sample process-ing (heatprocess-ing, dosprocess-ing with UV and atomic hydrogen, by analogy with IS environments). This is described in Sect. 4, together with the experimental procedure for the measurement of absolute PL efficiencies, and the main results of interest for astrophysics. Sect. 5 evaluates this material as a carrier of ERE
2. Porous silicon (p-Si)
Bulk crystalline Si (c-Si) is known to fluoresce very weakly. However, starting from 1990, the discovery of strong, visible, room-temperature PL of porous silicon, and its obvious indus-trial applications have fueled extensive investigation and pub-lication in this field (see review by Cullis et al., 1997). p-Si is obtained by etching c-Si to porosities exceeding 80%, leaving a skeleton made of only tenuously connected crystalline islands. It is now widely accepted that the high PL efficiency (≥1%) is mainly a result of the confinement of excited electrons in the nanometric quantum wells formed by the islands(Feng and Tsu, 1995; Brus et al., 1995). It was also shown theoretically that λmaxmust decrease with the well size, which explains why the PL shifts blueward as the porosity increases. The whole visible spectrum can thus be covered with a set of porosities(Fauchet, 1996). In particular, the brightest luminescence is obtained by porosity-tuning so that the peak PL falls in the range 600-800nm (precisely the same as ERE!).
After preparation of the samples, the strong PL persists in open air only if the material surface is passivated, either by saturating the dangling Si bonds with H atoms or, better still, by oxidation (Brus et al., 1995). The overlayer of SiO2 that spontaneously forms in air is usually∼1 nm thick and does not modify the PL spectrum.
While much insight in the PL of Si has been gained by these studies, a more fundamental understanding, as is necessary for astrophysical applications, is hindered by the fact that p-Si is a result of a very specific preparation and that the material is not homogeneous, but consists of small active regions with a distribution of sizes. Among other effects, this dispersion en-tails an artificial broadening of the PL spectrum. We therefore directed our efforts to the production of narrowly dispersed, nearly spherical, nanosized particles.
3. Nanocrystalline silicon
Si clusters and nanocrystals were generated by CO2 -laser-induced decomposition of silane (SiH4) in a flow reactor (Ehbrecht et al., 1995, 1997). By introducing a conical nozzle into the reaction zone, the clusters are extracted into a molecu-lar beam machine and analyzed with a time-of-flight mass spec-trometer. As the cluster velocity is size dependent, a mechanical velocity selector is used to further narrow the size distribution and select a specific mean size. In this way, size distributions were obtained, with mean diameter in the range from 2.5 to 7nm, and FWHMs between 1 and 1.5 nm. Such distributions were collected in the form of uniform thin films deposited on
silicon, KBr and CaF2substrates inserted in the molecular beam, behind the selector.
Raman scattering analysis showed that the structure is crys-talline and that the particles do not fragment or change in size or coalesce after deposition(Ehbrecht et al., 1997). This could also be confirmed by high resolution electron microscopy (HREM)(Hofmeister et al., 1998).
4. Experimental procedure and results
The measuring apparatus has been designed to study the surface of a solid sample by ir and/or visible spectroscopy. The sample is mounted in a vacuum chamber and can be irradiated with H atoms and/or electrons and UV photons. It can be cooled down to 77K and heated up to 500K.
The PL is excited by means of a quadrupled Nd-YAG laser (266nm, 4.66eV). The UV output is∼300mW in 6ns pulses, 30mJ each, with a repetition rate of 10Hz. Before entering the vacuum chamber, the UV beam is attenuated as required, by Schott glass filters (UG 11) and a calibrated, rotatable polarizer-depolarizer system. The laser power is measured by means of a commercial calorimeter and monitored during the PL spectra measurement by a photodiode. The average power incident on the sample never exceeds 100µW.
Measuring the absolute value of the PL efficiency is the most delicate part of the experiment, for a number of reasons(Theiss, 1997): a) even in the simple case of a semi-infinite sample, irra-diated by a monochromatic beam at 45◦incidence and observed in a direction perpendicular to this, account must be taken of reflection losses of exciting and PL light at the interfaces and absorption losses along their paths inside the sample; moreover, a large fraction of the PL photons may be lost by total reflection at the internal side of the interface; b) in practice, the samples are often quite thin (optically), so that part of the exciting en-ergy is lost or reflected on the backing substrate in uncontrolled ways.
In view of this, we adopted the following procedure. The irradiation and observation directions are 80◦to each other and the normal to the sample surface is tilted at 45◦ to the plane of the former directions. The collecting optics images an area S∼1mm2of the sample surface subtended by a solid angle small enough that total reflection does not occur (Ω∼ 5msr). When the sample is thin enough or the UV absorbtivity of the material is large enough that essentially all the exciting light is absorbed within 1mm of the surface, essentially all the light emitted inΩ over area S is collected. The absorbances of the naked substrate and of the nano-Si-covered substrate are measured separately, to determine the fraction of incident laser power that is absorbed in the sample.
Now, the same optical set-up is used to detect the PL of a liquid solution of the very efficient Rhodamine 6G molecule (η∼1), filling a rectangular parallelepiped made of quartz plates, 1 mm thick. The titration is 5 10−4 mole/l in ethanol, so that αUV=10cm−1and the photoluminescent region is confined very near to the irradiated face of the vessel, as required above. Here, there are two sources of PL loss: self-absorption (∼10%) and
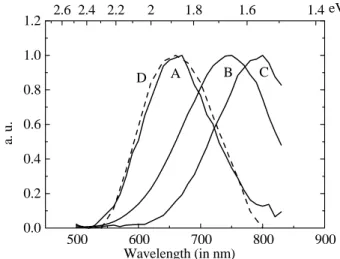
500 600 700 800 900 0.0 0.2 0.4 0.6 0.8 1.0 1.2 eV a. u. Wavelength (in nm) 2.6 2.4 2.2 2 1.8 1.6 1.4 D A B C
Fig. 1. Normalized PL spectra under pulsed laser excitation at 266nm.
Samples A, B, C have average particle sizes of 3.65, 3.92 and 4.95nm respectively, and efficienciesη=1%, 12% and 1.6%. The dashed curve, D, represents ERE from NGC 2023 (Witt and Boroson, 1990). The arrowed segment represents the range of observed ERE peak wave-lengths.
reflection at the interfaces (∼4%).We take a correction factor of 0.85 to account for both losses. Finally, the efficiencies are obtained by ratioing the corrected signals from the sample and the Rhodamine respectively.
Figure 1 presents the PL spectra, at a resolution of 10nm, of 3 typical samples, A, B, C, which were prepared about one year ago and stored without special precautions. The average crystallite sizes are 3.65, 3.92 and 4.95 nm, respectively, with a size dispersion of∼1 nm. The curves are normalized and the absolute PL quantum efficiencies are 1%, 12% and 1.6%. The corresponding peak wavelengths are 670, 750 and 800nm. The PL of sample B is the strongest of a series covering the spec-tral range 500-900 nm. The occurrence of a maximum as the crystallite size decreases could be the result of a compromise between 1) the increase of the band gap energy (which hinders phonon-assisted non-radiative processes) and the reduced prob-ability of occurence of a defect on a grain, and 2) the increase of non-radiative processes with the ratio of the volume of the outer oxide shell to the volume of the crystalline core. Thus crystal-lites∼4nm in size are likely to dominate the PL spectrum of a distribution of nanoparticles.
When the sample temperature is lowered from 300 K to 77 K, the PL intensity increases by∼ 50% and its peak shifts by ∼ 20 nm to the blue; these changes are reversible. Thus the grain temperature is not an important parameter for ERE. Neither is the excitation wavelength: excitation at 266, 300, 400, and 500nm gives essentially the same PL spectrum. Fig. 1 also shows an example of the quality of fit one can obtain between particular ERE and sample spectra.
5. Crystalline Si as a carrier of ERE
Crystalline Si in the form of nanoclusters suitably distributed in size between 3 and 5 nm, clearly satisfies the observational
constraints of ERE as regards spectral shape and position of PL, and their dependence on grain temperature and excitation wave-length. Although its efficiency is much higher than that of the other candidates, we must now consider if there may be enough silicon particles in the relevant space environments. In this re-spect, it should be remembered that a carbon-rich environment does not exclude silicon chemistry (see, for instance, Chan and Kwok, 1991).
The required quantity of Si can be estimated from its PL efficiency and the ratio of ERE to scattered intensities, r=φERE/φsca, which was measured by Witt and coll.,in a num-ber of environments (Gordon and Witt, 1997; Witt and Boroson, 1990). This ratio can be written
r = ηP LhνP Lhν exc φ∗,exc φ∗,P L 2α2,exc (Qsca/a)1,P L Md2 Md1 ρ1 ρ2, (1)
where PL and exc designate, respectively, the wavelength ranges of photoluminescence (600-900 nm) and excitation (100-400 nm); 1 and 2, the main and photoluminescent dust, respectively; φ∗, the radiative star flux falling upon the dust;α, the absorp-tivity of the material (cm−1); Qsca, the scattering efficiency of a grain of radius a; Mdandρ, the corresponding dust mass and specific gravity; Md2/Md1is the unknown, X.
From Sect. 4, we can takeηP L=0.1; the second factor of (1) is∼1/3. For star photospheric temperatures of 104and 2 104 K, respectively, the 3rd factor ranges between 3.3 and 16. The absorptivity of pure, crystalline Si ranges between 105and 106 in the spectral range 100-400 nm (Cullis et al., 1997). Since the specific gravity of pure Si, silicates and carbon dust are, re-spectively, about 2.5, 3 to 4 and 2, we takeρ1/ρ2=1. For Qsca/a we start from the values tabulated by Draine (1985) for 0.1µm grains of “astrophysical silicates” and graphite, at 700nm: 0.29 and 1.15, respectively. In the Rayleigh approximation, Qsca/a∼ a3. We average this quantity over a canonical size distribution in a−3.5between 10 and 1000 nm, and, assuming that both dust types are present in equal amounts, we obtain an overall average (Qsca/a)1,P L of 3750 cm−1. Thus, the r.h.s. of (1) ranges be-tween 3X and 160X. Considering the range of r values observed by Gordon et al.(1997), 0.05-2, and assigning these variations mainly to star colour, we estimate that X is in the order of 1%. This must be taken as a higher limit, because anisotropy favours forward scattering rather than the usual average direction of ob-servation (90◦), so that Qscashould be smaller than the adopted value; and also because account was not taken of possible ex-citation by recombination lines, often quite strong just outside HII regions.
Another estimate can be deduced along the same lines, but using the ERE intensity in the diffuse ISM, as measured by Gordon et al. (3% of the total energy emitted by dust, or 1.8 10−25 erg/s.H atom), and the diffuse ISRF between 100 and 400 nm. If we take the latter to be 2.10−9W/cm2(Draine and Bertoldi, 1996), we find X∼5%. The most plausible reason for the disagreement with the value found above is that the adopted ISRF does not apply to the excitation of diffuse ERE, being too low.
L42 G. Ledoux et al.: Silicon as a candidate carrier for ERE
Considering that the cosmic mass abundance of Si is only one fifth that of C, it appears that the required amount for ERE can plausibly be found in the form of small nuggets, either bare, but hydrogen passivated, or embedded. Such nanocrystals have been found, for instance, in SiCN powders obtained by laser pyrolysis (Mayne et al., 1998). In CVD a-Si:H films, nanocrys-tallites of Si and their luminescence were observed even without any post-processing (Liu et al., 1993). Finally, pure Si has only a few mid-ir bands and they are very much weaker than the 11.3-µm band of SiC (Theiss, 1997), so that they could hardly be detected in the sky.
Further measurements on nano crystallites Si, and similar measurements of PL have been performed or are going on, with the same apparatus, on various other materials: a-C:H, a-SiC:H, coals and p-Si. They will be reported elsewhere.
Acknowledgements. We are pleased to acknowledge stimulating and
fruitful discussions and/or receipt of various samples from Prof. I. Solomon, Dr J.-C. Vial, Dr P. Roca i Cabarrocas and Dr.J.-M. Perrin.
References
Angus J. Koidl, P. and Domitz, S., 1986, in Plasma Deposited Thin Films, Chap. 4, CRC Press Inc.
Bouree, J. et al., 1996, J. Non-Crystal. Solids, 198-200, 623 Brus, L. et al., 1995, J. Am. Chem. Soc., 117, 2915 Chan, J. and Kwok, S., 1991, ApJ, 383, 837
Cullis, A., Canham, L. and Calcott, P., 1997, J. Appl. Phys., 82, 909 Draine, B., 1985, Ap. J. Suppl., 57, 587
Draine, B. and Bertoldi, F., 1996, ApJ, 468, 269
Duley, W., Seahra, S., Williams, D., 1997, Ap. J., 482, 866
Ehbrecht, M., Ferkel, H., Smirnov, V.V., Stelmakh, O.M., and Huisken, F., 1995, Rev. Sci. Instrum. 66, 3833
Ehbrecht, M., Kohn, B., Huisken, F., Laguna, M. and Paillard, V., 1997, Phys. Rev. B, 56, 6958
Fabisiak, K., Rozploch, F., Szatkowski, J., and Targowski, P., 1991, Phys. Stat. Sol. (a), 126, 275
Fauchet, F., 1996, J. Luminesc., 70, 294
Feng, Z. and Tsu, R.(edrs), 1995, Porous Silicon, World Science, Sin-gapore
Furton, D. and Witt, A., 1992, Ap. J., 386, 587 Furton, D. and Witt, A., 1993, Ap. J. Lett., 415, L51 Gordon, K., Witt, A. and Friedman, B., 1997, ApJ, in press Hofmeister, H., Huisken, F., and Kohn, B., 1998, to be published Liedtke, S., Lips., K., Bort, M., Jahn, K. and Fuhs, W., 1989, J.
Non-Cryst. Sol., 114, 522
Liu, X., Wu, X., Bao, X. and He, Y., 1993, Appl. Phys. Lett., 64, 220 Mayne M. et al., 1998, to appear in J. Eur. Ceram. Soc.
Perrin, J.-M. and Sivan, J.-P., 1992, A&A, 255,271
Perrin, J.-M., Darbon, S. and Sivan, J.-P., 1995, A&A, 304, L21 Rusli, Robertson, J. and Amaratunga, G., 1996, J. Appl. Phys., 80, 2998 Sakata, A., Wada, S., et al. 1992, Ap. J. Lett., 393, L83
Schmidt, G., Cohen, M. and Margon, B., 1980, Ap. J. Lett., 239, L133 Sivan, J.-P. and Perrin, J.-M., 1993, Ap. J. 404,258
Siebert, W., Carius, R., Fuhs, W. and Jahn, K., 1987, Phys. Stat. Sol. (b), 140, 311
Street, R., 1991, Hydrogenated Amorphous Silicon, Cambridge U. A., Cambridge
Szomoru, A, and, Guhathakurta, P., 1997, in press???
Tawada, Y, Tsuge, K., Kondo, M., Okamoto, H. and Hamakawa, Y., 1982, J. Appl. Phys., 53, 5273
Tessler, L. and Solomon, I., 1995, Phys.Rev. B, 52, 10962 Theiss, W., 1997, Surface Sc. Rep., 29, 91
Watanabe, I., Hasegawa, S., Kurata, Y. 1982, JJAP, 21, 6 Witt, A., Schild, R. and Kraiman, J., 1984, Ap. J., 281, 708 Witt, A., Schild, R., 1988, Ap. J., 325, 837
Witt, A. and Boroson, T., 1990, Ap. J., 355, 182
Witt, A., Ryutov, D. and Furton, D., 1996, From Star Dust to Planetes-imals, Santa Clara, NASA
Xu, S., Hundhausen, M., Ristein, J., Yan, B., and Ley, L., 1993, J. Non-Cryst. Sol. 164-166, 1127