HAL Id: hal-01136108
https://hal.archives-ouvertes.fr/hal-01136108
Submitted on 26 Mar 2015
HAL is a multi-disciplinary open access
archive for the deposit and dissemination of sci-entific research documents, whether they are
pub-L’archive ouverte pluridisciplinaire HAL, est destinée au dépôt et à la diffusion de documents scientifiques de niveau recherche, publiés ou non,
Phase-velocity in Afar region
Félicie Korostelev, Cornelis Weemstra, Sylvie Leroy, Lapo Boschi, Derek Keir,
Yong Ren, Irene Molinari, Abdulhakim Ahmed, Graham W. Stuart,
Frédérique Rolandone, et al.
To cite this version:
Félicie Korostelev, Cornelis Weemstra, Sylvie Leroy, Lapo Boschi, Derek Keir, et al.. Magmatism on rift flanks: insights from Ambient-Noise Phase-velocity in Afar region. Geophysical Research Letters, American Geophysical Union, 2015, 42 (7), pp.2179-2188. �10.1002/2015GL063259�. �hal-01136108�
Magmatism on rift flanks: insights from
1
Ambient-Noise Phase-velocity in Afar region
2
F´elicie Korostelev,1,2 Cornelis Weemstra,3 Sylvie Leroy,1,2 Lapo Boschi1,2,
Derek Keir4, Yong Ren5, Irene Molinari6, Abdulhakim Ahmed1,2,7, Graham
W. Stuart5, Fr´ed´erique Rolandone1,2, Khaled Khanbari8, James O. S.
Hammond9, J. M. Kendall10, C´ecile Doubre11, Ismail Al Ganad12, Berhe
Goitom13, and Atalay Ayele14
Corresponding author: F´elicie Korostelev, ([email protected])
During the breakup of continents in magmatic settings, the extension of 3
the rift valley is commonly assumed to initially occur by border faulting and 4
progressively migrate in space and time towards the spreading axis. Mag-5
matic processes near the rift flanks are commonly ignored. We present phase-6
velocity maps of the crust and uppermost mantle of the conjugate margins 7
of the southern Red Sea (Afar and Yemen) using ambient noise tomography 8
to constrain crustal modification during breakup. Our images show that the 9
low seismic velocities characterize not only the upper crust beneath the ax-10
ial volcanic systems, but also both upper and lower crust beneath the rift 11
flanks where ongoing volcanism and hydrothermal activity occur at the sur-12
face. Magmatic modification of the crust beneath rift flanks likely occurs for 13
a protracted period of time during the breakup process, and may persist through 14
to early seafloor spreading. 15
1. Introduction
During the breakup of continents, stretching and thinning of the plate commonly causes 16
decompression melting and volcanism. In the resultant magmatically active rift valleys 17
it is widely thought that extension is initially accommodated mainly by border faulting, 18
and progressively localizes to relatively narrow axial volcanic segments as the rift valley 19
widens [e.g. Ebinger and Casey, 2001]. However, it is becoming increasingly more recog-20
nized that magma intrusion and volcanism can occur on the rift flanks at an early stage 21
of rifting [e.g. Maccaferri et al., 2014]. These rift flank magmatic systems accommodate 22
extension through diking [Rooney et al., 2014], and thermally and compositionally mod-23
ify the lithosphere [Daniels et al., 2014]. Despite the importance of magmatic processes 24
during continental extension, we have few constraints on their spatial and temporal vari-25
ability. In order to address this issue we use ambient seismic noise tomography to image 26
the Rayleigh wave phase-velocity structure of the crust in a region of late stage breakup 27
at the conjugate margins of the southern Red Sea in Afar and Yemen. 28
Geochronological constraints in Ethiopia suggest rifting began 29-31 Ma on the western 29
Afar margin [e.g. Ayalew et al., 2006; Wolfenden et al., 2005, Fig.1], approximately coeval 30
with ∼35 Ma faulting along large portions of the Gulf of Aden to the east [Leroy et al., 31
2010]. Rifting was associated with the development of large offset border faults that 32
currently define ∼2000-3000 m of relief between the submarine Red Sea and subaerial 33
Afar depression with the uplifted Ethiopian and Yemeni plateaus [Wolfenden et al., 2004]. 34
Extension is thought to have occurred above warm mantle with a potential temperature 35
of ∼1450 degrees [Rooney et al., 2012], associated with voluminous flood basalts on the 36
Ethiopian and Yemeni plateaus synchronous with the onset of extension [Wolfenden et al., 37
2004], and associated with ongoing magmatism [Ferguson et al., 2013]. At ∼21-23 Ma, 38
magmatism occurred through dike intrusions along most of the eastern margin of the 39
Red Sea [Bosworth et al., 2005]. Magmatism on the rift flanks is ongoing, with the 40
Quaternary to Recent volcanic centers of Sana’a, Dhamar and Marib located in Yemen 41
[Manetti et al., 1991; Korostelev et al., 2014]. In addition, thermal hotsprings are present 42
along the conjugate southern Afar margin [Keir et al., 2009]. Magma intrusion and 43
volcanism is also common within the rift valley. Since ∼10 Ma in Afar, extension via 44
diking progressively localized to the rift axis [e.g. Wolfenden et al., 2005; Rooney et al., 45
2011], with the current locus of strain being ∼70-km-long, ∼20-km-wide axial volcanic 46
segments such as the Dabbahu-Manda-Hararo segment in central-west Afar [e.g. Hayward 47
and Ebinger , 1996]. Here, episodic intrusion of dikes fed from crustal magma chambers 48
at both the segments centers and tips accommodates the majority of extension [e.g. Keir 49
et al., 2009; Grandin et al., 2010, 2011]. 50
Current opening across the kinematically complex southern Red Sea rift is constrained 51
with relatively high-density GPS [e.g. ArRajehi et al., 2010; McClusky et al., 2010] and 52
InSAR measurements[e.g. Pagli et al., 2014]. These data show that south of ∼16◦N, the 53
rift bifurcates into two branches: the main Red Sea and the subaerial Red Sea rift in Afar 54
(Danakil Depression). Partitioning of extension between rift branches varies along-strike. 55
North of ∼16◦N, all the extension is accommodated in the main Red Sea rift, spreading 56
at ∼15 mm/yr. Moving south of 16◦N, the extension is progressively accommodated in 57
the Afar Depression reaching ∼20 mm/yr at 13◦N [McClusky et al., 2010; Vigny et al., 58
2006]. The crust beneath Afar varies from 25 km thick beneath most of Afar, to 15 km 59
thick beneath the Danakil depression (Afdera-Erta’Ale segment) in the north [Makris and 60
Ginzburg, 1987; Bastow and Keir , 2011, Fig.1]. The crustal thickness is ∼25 km thick 61
beneath the Danakil block and increases to 40-45 km beneath the Ethiopian and Yemeni 62
Plateaus [Hammond et al., 2011; Ahmed et al., 2013, Fig.1]. 63
2. Data
Our dataset is based on continuous recordings from 89 seismic stations. Only a limited 64
number of high-quality permanent seismic stations span the Afar-southern Red Sea mar-65
gins and so temporary experiments using portable broad-band equipment are our major 66
source of information on the structure of the area. A seismic deployment was conducted 67
between March 2009 and March 2010 as part of the YOCMAL (Young Conjugate Margins 68
Laboratory) project, with 23 stations covering western Yemen during one year [Korostelev 69
et al., 2014; Corbeau et al., 2014, Fig.2]. We also use data from 41 stations in the Afar 70
Consortium network (UK and US, from March 2007 to November 2009) [e.g. Keir et al., 71
2011], five stations of the Horn of Africa network in Yemen and Ethiopia [from June 1999 72
to December 2002, e.g. Sicilia et al., 2008] and six temporary stations recording from 73
May 2011 to September 2012 in Eritrea [e.g. Hammond et al., 2013, Fig.2]. One station 74
from the Djibouti temporary network was added to our dataset, together with permanent 75
seismic stations in Djibouti, Yemen and Ethiopia. 76
The ambient-noise cross-correlation technique relies on having simultaneous recordings 77
of the noise field at two seismic stations so that the Green’s function between them can 78
be estimated [Shapiro and Campillo, 2004; Wapenaar and Fokkema, 2006; Halliday and 79
Curtis, 2008]. Because the different deployments of portable instruments occurred at 80
different times, we are not able to estimate Green’s functions for all receiver pairs. We 81
partly compensate for this, however, by utilizing permanent stations from the IRIS and 82
GEOSCOPE networks, providing data over a period during which several of the mentioned 83
portable arrays were active. 84
3. Method
The ambient noise technique to study Earth structure is free of limitations imposed 85
by the distribution of natural earthquakes. Extracting travel times from a multitude 86
of station-station correlations therefore allows for relatively high-resolution tomographic 87
inversions [e.g. Shapiro et al., 2005]. We follow the approach of Ekstr¨om et al. [2009], 88
discussed in further detail in section 3.2 of Boschi et al. [2013], to estimate phase velocity 89
from the ambient signal recorded at two stations. 90
The background seismic noise is to a large extent generated by the coupling of oceans 91
with the solid Earth [e.g. Longuet-Higgins, 1950; Hillers et al., 2012]. Because this area 92
is almost surrounded by seas or oceans (Red Sea, Gulf of Aden, Indian Ocean), it is 93
particularly suitable for ambient noise surface wave retrieval. 94
To maximize data quality, we (i) only used the pairs of stations that recorded simulta-95
neously for at least 6 months, and (ii) compared measured and predicted Green’s function 96
for all station pairs, and discarded pairs that clearly showed a bad fit (see figure in 97
supplementary material). The duration of cross-correlated signal varies by 6-36 months 98
depending on the station pair. These long durations guarantee that all seasons and hence 99
all possible azimuths of noise propagation are sampled [e.g. Stehly et al., 2006]. Data 100
processing was limited to whitening, as reasonable dispersion curves could be obtained 101
without any filtering and/or ”one-bit” amplitude compression. 102
4. Resolution
4.1. Station-to-station paths
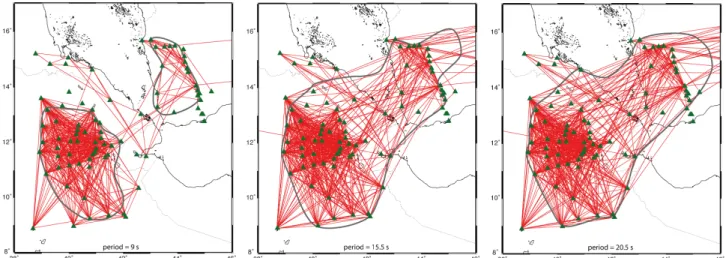
To assess the resolving power of our inversion, we first show in Figure 2 the station-to-103
station paths corresponding to ambient Rayleigh-wave observations at each period. The 104
solid gray line delimitates the area with good coverage, and therefore the zone of best 105
resolution. 106
4.2. Random tests
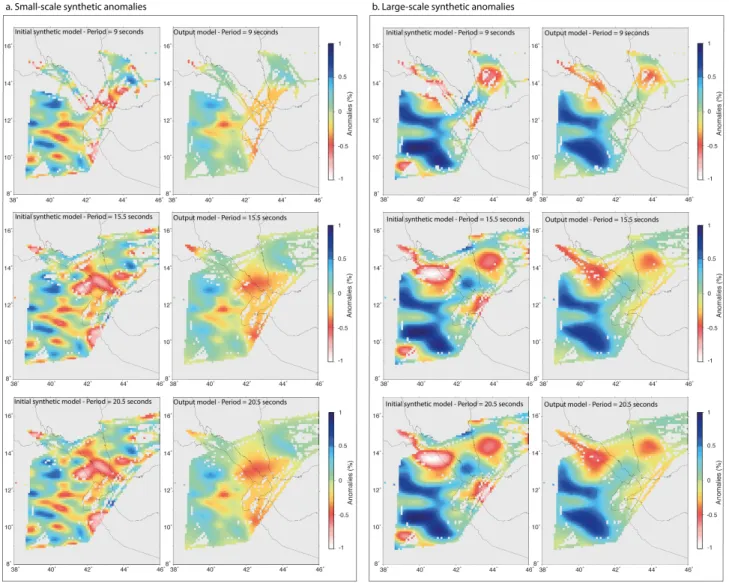
We perform two random resolution tests [e.g. Verbeke et al., 2012] to assess the reliability 107
of the tomographic inversion: one with structures smaller than 100 km (Fig.3.a) and a 108
second one with structures larger than 100 km (Fig.3.b). The input synthetic random 109
velocity model consists of alternating random structures of opposite sign with a maximum 110
velocity variation of 1.5% relative to the reference velocity. 111
Synthetic phase velocities were computed between the same station pairs as in the 112
observed database. Figures 3.a and b show the input velocity models and the retrieved 113
velocity models from these tests for periods of 9, 15.5 and 20.5 s. These synthetic tests 114
indicate that our inversion can resolve most of the Afar-southern Red Sea margins region, 115
with some degradation of the recovered solutions near the edges of the illuminated area. 116
The tomography algorithm is that utilized e.g. by Verbeke et al. [2012]. Pixel-size is 117
0.1◦x0.1◦. 118
Our synthetic tests (Fig.3) serve to validate both pixel size and select the values of 119
regularization parameters that allow us to represent heterogeneities of scale-length such 120
as in figure 3.a (left). The same parameterization and regularization is applied to real 121
data in the following. Notice that resolution changes across the region of study, so that a 122
unique resolution limit cannot be specified. 123
5. Results
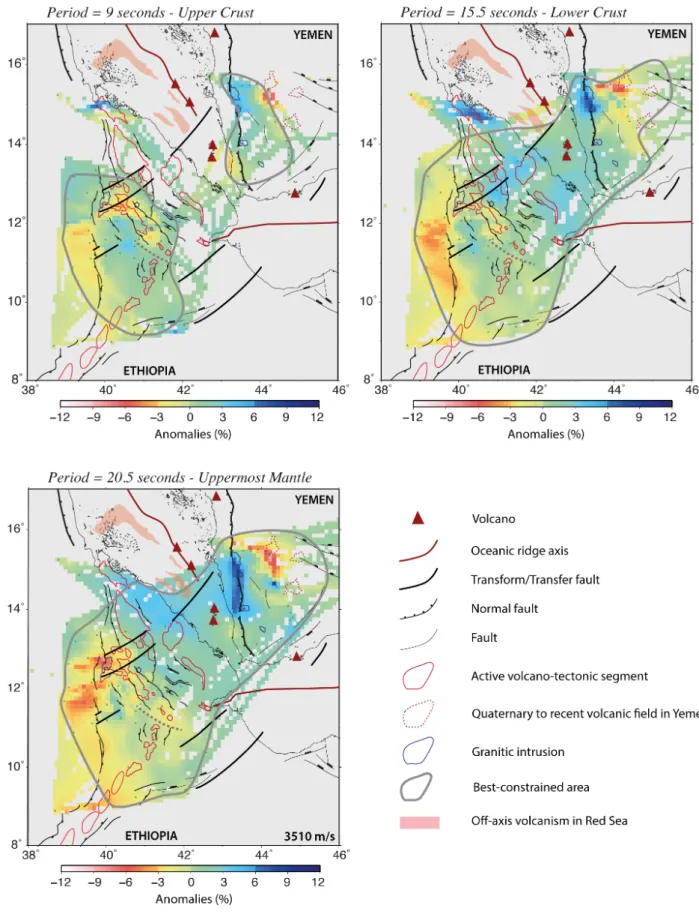
We compute Rayleigh-wave phase-velocity maps for periods between 9 s and 25.5 s, 124
and present examples at 9, 15.5 and 20.5 s (Fig.4; see supplementary material for other 125
periods). According to e.g. Lebedev and Van Der Hilst [2008] and Fry et al. [2010], 9-s 126
Rayleigh waves are most sensitive to depths < 20 km (upper and mid crust), while 15.5-127
s are most sensitive to 10 - 40 km depth (primarily the lower crust). 20.5-s Rayleigh 128
waves can sample down to 70 km, at the top of the upper mantle. The locus of major 129
velocity anomalies is fairly constant from 9 s to 15.5 s (Fig. 4). We image positive velocity 130
perturbations beneath the border faults of the eastern flank of the Red Sea in Yemen, 131
beneath the Danakil Horst, and in central western Afar in the region between the rift 132
margin and the axial volcanic segments (Sullu Adu area, Fig.1). We also see positive 133
velocity perturbations beneath the western Afar margin north of 12◦N. The main slow 134
anomalies are located beneath Dabbahu Manda-Hararo axial volcanic system, beneath 135
Durrie off-axis volcano and the southern axis extension to Kurub volcano (Fig.1). We 136
also find slow anomalies associated with the volcanic systems 150 to 200 km east of the 137
rift margin in Yemen, and beneath the western Afar margin south of 12◦N (Fig.4). 138
The magnitude of several of the distinct velocity perturbations varies subtly with period. 139
For example, beneath the eastern rift margin (Tihama Plain, Yemen, Fig.1), the positive 140
anomaly increases in magnitude from 5% at 9 s to 7% at 20.5 s (Fig. 4). The slow 141
anomaly beneath the western Afar margin flank south of 12N is mostly more than -3% at 142
9 s, whereas at 15.5 and 20.5 s a larger proportion of the anomaly is -4 to -6% (Fig.4). 143
The slow anomalies beneath Yemen and beneath the axial volcanic segment of Dabbahu-144
Manda-Hararo in Afar correlate well with the locus of surface volcanism (Fig.4). In 145
addition, figure 5 shows the surface distribution of known thermal springs in the region 146
[Keir et al., 2009]. The slow anomaly beneath the western Afar margin is beneath the locus 147
of thermal springs on the western Afar margin, whereas north of 12◦N, thermal springs are 148
absent and the crust is faster than average. The spatial extent of slow anomalies imaged 149
using ambient noise also correlates well with the spatial extent of high Vp/Vs ratios in 150
the crust constrained using P-S receiver functions [Hammond et al., 2011]. 151
6. Discussion
Seismic wave velocity is known to be affected by the temperature and chemical com-152
position of the medium of propagation (crustal rocks), as well as by the concentration of 153
fluids, such as partial melt that might be present within crustal rocks [e.g. Christensen 154
and Mooney, 1995; Karato et al., 2003]. We image slow velocities beneath axial regions of 155
localized magma intrusion, consistent with the hypothesis that major surface-wave slow 156
anomalies are associated with magmatism (Fig.4). In addition, the lowest velocities in 157
our images are beneath zones of active volcanism and geothermal activity near the flanks 158
of the southern Red Sea conjugate margins (Fig. 4 and 5). The magnitude of the anoma-159
lies and spatial association with regions where either partial melt or fluids released from 160
cooling magmatic systems are present suggests the crust beneath the flanks of the rift is 161
currently being modified by magmatic processes. Ongoing magmatism occurs at the rift 162
flanks in spite of the majority of strain having shifted to the rift axis since the onset of 163
rifting at 11 Ma [Wolfenden et al., 2004]. Beneath the western Afar margin, where slow 164
anomalies are associated with geothermal systems rather than known volcanoes, geologi-165
cal studies suggest early border faulting at 30 Ma was associated with spatially localized 166
volcanism in the marginal graben systems [Ayalew et al., 2006]. Our velocity maps suggest 167
that the magmatic systems beneath the rift flanks that were active during the onset of 168
rifting, remain magmatically active throughout the breakup process either through con-169
tinued minor accumulation of partial melt in reservoirs, dike intrusion, and / or ongoing 170
conductive cooling leading to release of fluids such as water [Keir et al., 2009; Holtzman 171
et al., 2010]. 172
The low-velocity anomalies in our phase-velocity maps under the rift axis are observed 173
with higher amplitude in the upper crust (Fig.4, period = 9 seconds), whereas the low-174
velocity anomalies located beneath the rift flanks are observed both in the upper and 175
lower crust, but with higher amplitude in the lower crust (Fig.4, period = 15.5 seconds). 176
This is consistent with the proposed plumbing systems of axial and flank volcanic systems 177
of the nearby Main Ethiopian Rift, where petrological constraints on flank volcanism are 178
good. The volcanic products observed on the flanks and at the axis of the MER are not 179
identical: they consist mainly of trachytes for the flanks, and mainly of rhyolites and 180
basalts for the axis [Peccerillo et al., 2007]. Petrological models indicate that the origin of 181
the off-axis trachytes is probably high-pressure fractional crystallization of asthenosphere-182
derived basalts, with this fractionation occurring at the base of the crust [Peccerillo et al., 183
2007]. Rooney et al. [2005, 2007] suggest that these off-axis volcanic products result of 184
moderate-degree partial melting at 50-90 km depth and undergo fractional crystalliza-185
tion in complex plumbing systems spanning depths throughout the crust [Rooney et al., 186
2011]. The volcanic rocks at the axis are asthenospheric basalts produced by rift-related 187
decompressional melting, rather than other potential sources such as melting in the crust. 188
The axial basalts undergo fractional crystallization mostly in the upper crust [Peccerillo 189
et al., 2007]. Thus, the axial magmatic chamber is shallow (in the upper crust), and the 190
melt ascension from the asthenosphere is probably rapid. At the flanks, however, there 191
is a complex plumbing system with stacked-reservoirs both in the upper and lower crust 192
[Rooney et al., 2011]. The geothermal systems of the flanks are probably fed or heated 193
by such a complex plumbing system (Fig.5). Our surface-wave velocity maps are consis-194
tent with this model and therefore suggest similar magmatic plumbing systems for the 195
southernmost Red Sea. 196
According to Medynski et al. [2015], the magma supply has decreased in the Dabbahu-197
Manda-Hararo axis reservoir since 15 kyr. An off-axis reservoir, located 15 km to the west 198
of the Dabbahu-Manda-Hararo rift beneath Durrie volcano has been actively fed since 15 199
kyr, and is currently imaged using magneto-telluric techniques (Fig.1) [Desissa et al., 200
2013]. It is consistent with our phase-velocity maps, where the maximum amplitude for 201
the northern Dabbahu-Manda-Hararo seems to be slightly to the west of the rift, beneath 202
Durrie volcano (Fig.4). 203
In the past, geodynamic models of breakup ignored the presence and impact of main-204
tained magmatism at rift flanks on the thermal and subsidence history of the rift during 205
late stage breakup and early seafloor spreading. At the southern Red Sea, where seafloor 206
spreading is young, our new crustal-velocity maps coupled with surface expression of vol-207
canism (Fig.4) show clear evidence for ongoing magmatism beneath the rift flanks in Afar 208
and Yemen (Sana’a, Dhamar and Marib volcanic fields, Fig.1) [Korostelev et al., 2014; 209
Corbeau et al., 2014]. Similarly, there is evidence for ongoing dike intrusion further north 210
along the eastern Red Sea flank from InSAR (interferometric synthetic aperture radar) 211
and seismicity studies at Harrat Lunayyir volcanic system in Saudi Arabia [e.g. Pallister 212
et al., 2010; Ebinger et al., 2010]. There, localized subsidence, horizontal opening and 213
earthquakes in April to May 2009 are best modeled by intrusion of a dike and induced 214
normal faulting. These studies, combined with the evidence presented by our new surface-215
wave velocity maps, demonstrate that rift flank magmatism during late stage breakup may 216
be more common than previously assumed. 217
7. Conclusions
Our study provides new high-resolution phase-velocity maps of the crust and uppermost 218
mantle of the conjugate margins of the southern Red Sea (Afar and Yemen) using ambient 219
noise tomography to constrain crustal evolution during breakup. Low-velocity anomalies 220
are imaged in the crust beneath the axial volcanic systems, but also in the upper and 221
lower crust beneath rift flanks where hydrothermal activity and ongoing volcanism are 222
observed at the surface. Our results show that the crust beneath the southern Red sea 223
rift flanks is currently being modified by magmatic processes, and that this activity is 224
continuous from the onset of rifting. We therefore demonstrate that rift flank magmatism 225
after breakup may be more common than it was previously thought in context of margins 226
with excess magmatism. 227
Acknowledgments. This project was funded by the ANR-07-BLAN-0135 YOCMAL, 228
CNRS-INSU-PICS Yemen, GSMRB Yemen and is in the framework of the Actions 229
Marges program. Seismic equipment from SEIS-UK is funded by NERC under agreement 230
R8/H10/64. We thank David Hawthorn, Alex Brisbourne and Victoria Lane for their 231
efforts during the deployment and servicing of network, the French Embassy in Yemen, 232
local governers and the people of the Yemen governorates for their help during the field 233
work. The authors thank Raphael Pik, Nicolas Bellahsen and Martin Stab for discus-234
sions about the Afar region. DK is supported by NERC grant NE/L013932/1. CW is 235
supported by the Netherlands Research Centre for Integrated Solid Earth Science (ISES). 236
Djibouti instruments belong to the French national pool of portable seismic instruments 237
Sismob-RESIF and IPGS/EOST (University of Strasbourg). 238
References
Ahmed, A., C. Tiberi, S. Leroy, G. W. Stuart, D. Keir, J. Sholan, K. Khanbari, I. Al-239
Ganad, and C. Basuyau (2013), Crustal structure of the rifted volcanic margins and 240
uplifted plateau of Western Yemen from receiver function analysis, Geophysical Journal 241
International, 193 (3), 1673–1690. 242
ArRajehi, A., S. McClusky, R. Reilinger, M. Daoud, A. Alchalbi, S. Ergintav, F. Gomez, 243
J. Sholan, F. Bou-Rabee, G. Ogubazghi, et al. (2010), Geodetic constraints on present-244
day motion of the Arabian Plate: Implications for Red sea and Gulf of Aden rifting, 245
Tectonics, 29 (3), TC3011. 246
Ayalew, D., C. Ebinger, E. Bourdon, E. Wolfenden, G. Yirgu, and N. Grassineau (2006), 247
Temporal compositional variation of syn-rift rhyolites along the western margin of the 248
southern Red Sea and northern Main Ethiopian Rift, Geological Society, London, Special 249
Publications, 259 (1), 121–130. 250
Bastow, I. D., and D. Keir (2011), The protracted development of the continent-ocean 251
transition in Afar, Nature Geoscience, 4 (4), 248–250. 252
Boschi, L., C. Weemstra, J. Verbeke, G. Ekstr¨om, A. Zunino, and D. Giardini (2013), On 253
measuring surface wave phase velocity from station–station cross-correlation of ambient 254
signal, Geophysical Journal International, 192 (1), 346–358. 255
Bosworth, W., P. Huchon, and K. McClay (2005), The Red Sea and Gulf of Aden Basins, 256
Journal of African Earth Sciences, 43 (1-3), 334–378. 257
Christensen, N. I., and W. D. Mooney (1995), Seismic velocity structure and composition 258
of the continental crust: A global view, Journal of Geophysical Research: Solid Earth 259
(1978–2012), 100 (B6), 9761–9788. 260
Corbeau, J., F. Rolandone, S. Leroy, A. Al-Lazki, D. Keir, G. Stuart, and A. Stork (2014), 261
Uppermost mantle velocity from Pn tomography in the Gulf of Aden, Geosphere. 262
Daniels, K., I. Bastow, D. Keir, R. Sparks, and T. Menand (2014), Thermal models of 263
dyke intrusion during development of continent–ocean transition, Earth and Planetary 264
Science Letters, 385, 145–153. 265
Desissa, M., N. Johnson, K. Whaler, S. Hautot, S. Fisseha, and G. Dawes (2013), A 266
mantle magma reservoir beneath an incipient mid-ocean ridge in Afar, Ethiopia, Nature 267
geoscience, 6 (10), 861–865. 268
Drake, C. L., and R. Girdler (1964), A geophysical study of the Red Sea, Geophysical 269
Journal International, 8 (5), 473–495. 270
Ebinger, C., and M. Casey (2001), Continental breakup in magmatic provinces: An 271
Ethiopian example, Geology, 29 (6), 527–530. 272
Ebinger, C., D. Keir, A. Ayele, E. Calais, T. Wright, M. Belachew, J. Hammond, E. Camp-273
bell, and W. Buck (2008), Capturing magma intrusion and faulting processes during 274
continental rupture: seismicity of the Dabbahu (Afar) rift, Geophysical Journal Inter-275
national, 174 (3), 1138–1152. 276
Ebinger, C., A. Ayele, D. Keir, J. Rowland, G. Yirgu, T. Wright, M. Belachew, and 277
I. Hamling (2010), Length and timescales of rift faulting and magma intrusion: the Afar 278
rifting cycle from 2005 to present, Annual Review of Earth and Planetary Sciences, 38, 279
439–466. 280
Egloff, F., R. Rihm, J. Makris, Y. Izzeldin, M. Bobsien, K. Meier, P. Junge, T. Noman, 281
and W. Warsi (1991), Contrasting structural styles of the eastern and western margins of 282
the southern Red Sea: the 1988 SONNE experiment, Tectonophysics, 198 (2), 329–353. 283
Ekstr¨om, G., G. A. Abers, and S. C. Webb (2009), Determination of surface-wave phase 284
velocities across USArray from noise and Aki’s spectral formulation, Geophysical Re-285
search Letters, 36 (18), L18,301. 286
Ferguson, D. J., J. Maclennan, I. Bastow, D. Pyle, S. Jones, D. Keir, J. Blundy, T. Plank, 287
and G. Yirgu (2013), Melting during late-stage rifting in Afar is hot and deep, Nature, 288
Vulcanologia, via di Vigna Murata 605,
00143 Roma, Italy.
7Seismological and Volcanological
Observatory Center, Dhamar, Yemen.
8Sana’a University, Yemen Remote
Sensing and GIS Center, Sana’a, Yemen.
9Imperial College London, London, SW7,
U.K.
10University of Bristol, Bristol, BS8, U.K.
11Institut de Physique du Globe de
Strasbourg; UMR 7516, Universit´e de
Strasbourg/EOST, CNRS, 5 rue Ren´e
Descartes, F-67084 Strasbourg Cedex.
12Yemen Geological Survey and mineral
Resources Board, Sana’a, Yemen.
13School of Earth Sciences, University of
Bristol, Bristol, UK.
14Institute of Geophysics, Space Science
499 (7456), 70–73. 289
Fry, B., F. Deschamps, E. Kissling, L. Stehly, and D. Giardini (2010), Layered azimuthal 290
anisotropy of Rayleigh wave phase velocities in the European Alpine lithosphere inferred 291
from ambient noise, Earth and Planetary Science Letters, 297 (1), 95–102. 292
Grandin, R., A. Socquet, E. Jacques, N. Mazzoni, J.-B. de Chabalier, and G. King (2010), 293
Sequence of rifting in Afar, Manda-Hararo rift, Ethiopia, 2005–2009: Time-space evo-294
lution and interactions between dikes from interferometric synthetic aperture radar and 295
static stress change modeling, Journal of Geophysical Research: Solid Earth (1978– 296
2012), 115 (B10). 297
Grandin, R., E. Jacques, A. Nercessian, A. Ayele, C. Doubre, A. Socquet, D. Keir, M. Kas-298
sim, A. Lemarchand, and G. King (2011), Seismicity during lateral dike propagation: 299
Insights from new data in the recent Manda Hararo–Dabbahu rifting episode (Afar, 300
Ethiopia), Geochemistry, Geophysics, Geosystems, 12 (4). 301
Halliday, D., and A. Curtis (2008), Seismic interferometry, surface waves and source 302
distribution, Geophysical Journal International, 175 (3), 1067–1087. 303
Hammond, J., J.-M. Kendall, G. Stuart, D. Keir, C. Ebinger, A. Ayele, and M. Belachew 304
(2011), The nature of the crust beneath the Afar triple junction: evidence from receiver 305
functions, Geochemistry, Geophysics, Geosystems, 12 (12). 306
Hammond, J., J.-M. Kendall, G. Stuart, C. Ebinger, I. Bastow, D. Keir, A. Ayele, 307
M. Belachew, B. Goitom, G. Ogubazghi, and T. Wright (2013), Mantle upwelling and 308
initiation of rift segmentation beneath the Afar Depression, Geology, 41 (6), 635–638. 309
Hayward, N., and C. Ebinger (1996), Variations in the along-axis segmentation of the 310
Afar Rift system, Tectonics, 15 (2), 244–257. 311
Hillers, G., N. Graham, M. Campillo, S. Kedar, M. Land`es, and N. Shapiro (2012), 312
Global oceanic microseism sources as seen by seismic arrays and predicted by wave 313
action models, Geochemistry, Geophysics, Geosystems, 13 (1). 314
Holtzman, B. K., J. Kendall, et al. (2010), Organized melt, seismic anisotropy, and plate 315
boundary lubrication, Geochemistry, Geophysics, Geosystems, 11 (12). 316
Karato, S. i., et al. (2003), The dynamic structure of the deep earth: an interdisciplinary 317
approach, Princeton University Press. 318
Keir, D., I. Bastow, K. Whaler, E. Daly, D. Cornwell, and S. Hautot (2009), Lower crustal 319
earthquakes near the Ethiopian rift induced by magmatic processes, Geochem. Geophys. 320
Geosyst, 10 (10). 321
Keir, D., C. Pagli, I. Bastow, and A. Ayele (2011), The magma-assisted removal of Arabia 322
in Afar: Evidence from dike injection in the Ethiopian rift captured using InSAR and 323
seismicity, Tectonics, 30 (2), TC2008. 324
Korostelev, F., C. Basuyau, S. Leroy, C. Tiberi, A. Ahmed, G. W. Stuart, D. Keir, 325
F. Rolandone, I. Ganad, K. Khanbari, et al. (2014), Crustal and upper mantle structure 326
beneath south-western margin of the arabian peninsula from teleseismic tomography, 327
Geochemistry, Geophysics, Geosystems, 15 (7), 2850–2864. 328
Laughton, A., and C. Tramontini (1969), Recent studies of the crustal structure in the 329
Gulf of Aden, Tectonophysics, 8 (4), 359–375. 330
Lebedev, S., and R. D. Van Der Hilst (2008), Global upper-mantle tomography with 331
the automated multimode inversion of surface and S-wave forms, Geophysical Journal 332
International, 173 (2), 505–518. 333
Leroy, S., F. Lucazeau, E. d’Acremont, L. Watremez, J. Autin, S. Rouzo, N. Bellahsen, 334
C. Tiberi, C. Ebinger, M. Beslier, et al. (2010), Contrasted styles of rifting in the 335
eastern Gulf of Aden: A combined wide-angle, multichannel seismic, and heat flow 336
survey, Geochemistry Geophysics Geosystems, 11 (7), Q07,004. 337
Longuet-Higgins, M. S. (1950), A theory of the origin of microseisms, Philosophical Trans-338
actions of the Royal Society of London. Series A, Mathematical and Physical Sciences, 339
243 (857), 1–35. 340
Maccaferri, F., E. Rivalta, D. Keir, and V. Acocella (2014), Off-rift volcanism in rift zones 341
determined by crustal unloading, Nature Geoscience. 342
Makris, J., and A. Ginzburg (1987), The Afar Depression: transition between continental 343
rifting and sea-floor spreading, Tectonophysics, 141 (1), 199–214. 344
Manetti, P., G. Capaldi, S. Chiesa, L. Civetta, S. Conticelli, M. Gasparon, L. Volpe, 345
and G. Orsi (1991), Magmatism of the eastern Red Sea margin in the northern part of 346
Yemen from Oligocene to present, Tectonophysics, 198 (2), 181–202. 347
McClusky, S., R. Reilinger, G. Ogubazghi, A. Amleson, B. Healeb, P. Vernant, J. Sholan, 348
S. Fisseha, L. Asfaw, R. Bendick, et al. (2010), Kinematics of the southern Red Sea–Afar 349
Triple Junction and implications for plate dynamics, Geophys. Res. Lett, 37, L05,301. 350
Medynski, S., R. Pik, P. Burnard, C. Vye-Brown, L. France, I. Schimmelpfennig, 351
K. Whaler, N. Johnson, L. Benedetti, D. Ayelew, et al. (2015), Stability of rift axis 352
magma reservoirs: Spatial and temporal evolution of magma supply in the dabbahu rift 353
segment (afar, ethiopia) over the past 30 kyr, Earth and Planetary Science Letters, 409, 354
278–289. 355
Pagli, C., H. Wang, T. J. Wright, E. Calais, and E. Lewi (2014), Current plate boundary 356
deformation of the Afar rift from a 3-D velocity field inversion of InSAR and GPS, 357
Journal of Geophysical Research: Solid Earth, 119 (11), 8562–8575. 358
Pallister, J., W. McCausland, S. J´onsson, Z. Lu, H. Zahran, S. El Hadidy, A. Aburukbah, 359
I. Stewart, P. Lundgren, R. White, et al. (2010), Broad accommodation of rift-related 360
extension recorded by dyke intrusion in Saudi Arabia, Nature Geoscience, 3 (10), 705– 361
712. 362
Peccerillo, A., C. Donati, A. Santo, A. Orlando, G. Yirgu, and D. Ayalew (2007), Pet-363
rogenesis of silicic peralkaline rocks in the Ethiopian rift: geochemical evidence and 364
volcanological implications, Journal of African Earth Sciences, 48 (2), 161–173. 365
Prodehl, C., and J. Mechie (1991), Crustal thinning in relationship to the evolution of the 366
Afro-Arabian rift system: a review of seismic-refraction data, Tectonophysics, 198 (2), 367
311–327. 368
Reed, C. A., S. Almadani, S. S. Gao, A. A. Elsheikh, S. Cherie, M. G. Abdelsalam, A. K. 369
Thurmond, and K. H. Liu (2014), Receiver function constraints on crustal seismic veloc-370
ities and partial melting beneath the Red Sea rift and adjacent regions, Afar Depression, 371
Journal of Geophysical Research: Solid Earth, 119 (3), 2138–2152. 372
Rooney, T., T. Furman, I. Bastow, D. Ayalew, and G. Yirgu (2007), Lithospheric mod-373
B10,201. 375
Rooney, T., I. Bastow, and D. Keir (2011), Insights into extensional processes during 376
magma assisted rifting: Evidence from aligned scoria cones, Journal of Volcanology and 377
Geothermal Research, 201 (1-4), 83–96. 378
Rooney, T., C. Herzberg, and I. Bastow (2012), Elevated mantle temperature beneath 379
East Africa, Geology, 40 (1), 27–30. 380
Rooney, T. O., T. Furman, G. Yirgu, and D. Ayalew (2005), Structure of the Ethiopian 381
lithosphere: Xenolith evidence in the Main Ethiopian Rift, Geochimica et Cosmochimica 382
Acta, 69 (15), 3889–3910. 383
Rooney, T. O., I. D. Bastow, D. Keir, F. Mazzarini, E. Movsesian, E. B. Grosfils, J. R. 384
Zimbelman, M. S. Ramsey, D. Ayalew, and G. Yirgu (2014), The protracted develop-385
ment of focused magmatic intrusion during continental rifting, Tectonics. 386
Ruegg, J. (1975), Main results about the crustal and upper mantle structure of the Dji-387
bouti region (TFAI), Afar Depression of Ethiopia, 1, 120–134. 388
Shapiro, N. M., and M. Campillo (2004), Emergence of broadband Rayleigh waves from 389
correlations of the ambient seismic noise, Geophysical Research Letters, 31 (7). 390
Shapiro, N. M., M. Campillo, L. Stehly, and M. H. Ritzwoller (2005), High-resolution 391
surface-wave tomography from ambient seismic noise, Science, 307 (5715), 1615–1618. 392
Sicilia, D., J. Montagner, M. Cara, E. Stutzmann, E. Debayle, J. L´epine, J. L´evˆeque, 393
E. Beucler, A. Sebai, G. Roult, et al. (2008), Upper mantle structure of shear-waves 394
velocities and stratification of anisotropy in the Afar Hotspot region, Tectonophysics, 395
462 (1-4), 164–177. 396
Stab, M., N. Bellahsen, R. Pik, S. Leroy, and D. Ayalew (2014), Mode of rifting in 397
magmatic-rich setting: Tectono-magmatic evolution of the central afar rift system, in 398
EGU General Assembly Conference Abstracts, vol. 16, p. 14484. 399
Stehly, L., M. Campillo, and N. Shapiro (2006), A study of the seismic noise from its long-400
range correlation properties, Journal of Geophysical Research: Solid Earth (1978–2012), 401
111 (B10). 402
Tramontini, C., and D. Davies (1969), A seismic refraction survey in the Red Sea, Geo-403
physical Journal International, 17 (2), 225–241. 404
Verbeke, J., L. Boschi, L. Stehly, E. Kissling, and A. Michelini (2012), High-resolution 405
Rayleigh-wave velocity maps of central Europe from a dense ambient-noise data set, 406
Geophysical Journal International, 188 (3), 1173–1187. 407
Vigny, C., P. Huchon, J.-C. Ruegg, K. Khanbari, and L. M. Asfaw (2006), Confirmation of 408
Arabia plate slow motion by new GPS data in Yemen, Journal of Geophysical Research: 409
Solid Earth (1978–2012), 111 (B2). 410
Wapenaar, K., and J. Fokkema (2006), Green’s function representations for seismic inter-411
ferometry, Geophysics, 71 (4), SI33–SI46. 412
Wolfenden, E., C. Ebinger, G. Yirgu, A. Deino, and D. Ayalew (2004), Evolution of the 413
northern Main Ethiopian rift: birth of a triple junction, Earth and Planetary Science 414
Letters, 224 (1), 213–228. 415
Wolfenden, E., C. Ebinger, G. Yirgu, P. Renne, and S. Kelley (2005), Evolution of a 416
volcanic rifted margin: Southern Red Sea, Ethiopia, Geological Society of America 417
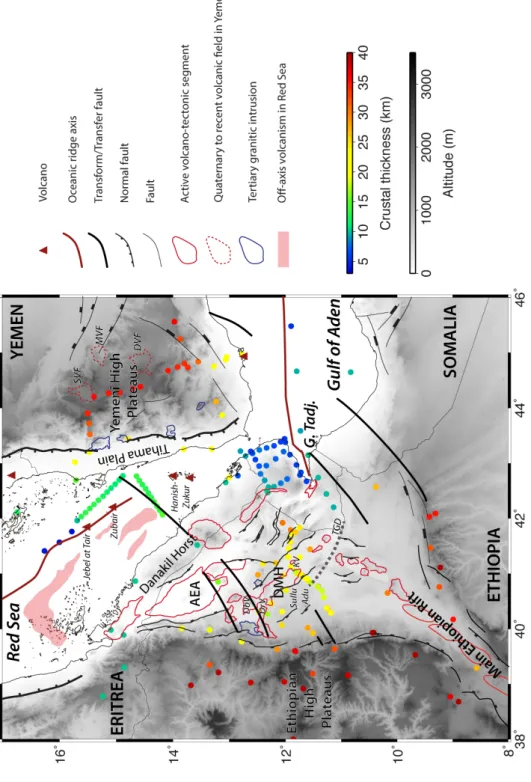
Figure 1. Structure of the Afar and southern Red Sea region. The crustal thicknesses are
displayed by colored dots and based on the Moho depths, which are obtained from Egloff et al.
[1991]; Tramontini and Davies [1969]; Drake and Girdler [1964]; Prodehl and Mechie [1991];
Laughton and Tramontini [1969]; Ruegg [1975]; Hammond et al. [2011]; Ahmed et al. [2013];
Reed et al. [2014]. Structures are modified from Ebinger et al. [2008] and Stab et al. [2014].
Bathymetry is not represented. DMH: Dabbahu-Manda-Hararo volcano-tectonic segment; AEA:
Afdera-Erta’Ale volcano-tectonic segment; G. Tadj.: Gulf of Tadjura; DbV: Dabbahu volcano; D R A F T February 27, 2015, 9:20am D R A F T
Figure 2. Map of the station pairs used for the tomographic inversion. The red lines show the
station-to-station paths. The solid gray line delimitates the best constrained area. The green
Figure 3. Result of two reconstruction synthetic tests with randomly distributed velocity
anomalies of various size as input. a. Small-scale synthetic anomalies; b. large-scale synthetic
anomalies. The left image displays the synthetic input, whereas the right image displays the
Figure 5. Distribution of thermal wells, fumaroles and thermal springs in the Afar triple
junction region [Keir et al., 2009]. No data was available in Yemen. The green triangles are the
![Figure 5. Distribution of thermal wells, fumaroles and thermal springs in the Afar triple junction region [Keir et al., 2009]](https://thumb-eu.123doks.com/thumbv2/123doknet/14791418.601584/29.892.137.764.109.903/figure-distribution-thermal-fumaroles-thermal-springs-triple-junction.webp)
