HAL Id: hal-00298946
https://hal.archives-ouvertes.fr/hal-00298946
Submitted on 17 Apr 2008HAL is a multi-disciplinary open access
archive for the deposit and dissemination of sci-entific research documents, whether they are pub-lished or not. The documents may come from teaching and research institutions in France or abroad, or from public or private research centers.
L’archive ouverte pluridisciplinaire HAL, est destinée au dépôt et à la diffusion de documents scientifiques de niveau recherche, publiés ou non, émanant des établissements d’enseignement et de recherche français ou étrangers, des laboratoires publics ou privés.
A coupled atmosphere and multi-layer land surface
model for improving heavy rainfall simulation
M. Haggag, T. Yamashita, H. Lee, K. Kim
To cite this version:
M. Haggag, T. Yamashita, H. Lee, K. Kim. A coupled atmosphere and multi-layer land surface model for improving heavy rainfall simulation. Hydrology and Earth System Sciences Discussions, European Geosciences Union, 2008, 5 (2), pp.1067-1100. �hal-00298946�
HESSD
5, 1067–1100, 2008 A coupled atmosphere and multi-layer land surface model M. Haggag et al. Title Page Abstract Introduction Conclusions References Tables Figures ◭ ◮ ◭ ◮ Back CloseFull Screen / Esc
Printer-friendly Version Interactive Discussion
Hydrol. Earth Syst. Sci. Discuss., 5, 1067–1100, 2008 www.hydrol-earth-syst-sci-discuss.net/5/1067/2008/ © Author(s) 2008. This work is distributed under the Creative Commons Attribution 3.0 License.
Hydrology and Earth System Sciences Discussions
Papers published in Hydrology and Earth System Sciences Discussions are under open-access review for the journal Hydrology and Earth System Sciences
A coupled atmosphere and multi-layer
land surface model for improving heavy
rainfall simulation
M. Haggag, T. Yamashita, H. Lee, and K. Kim
Graduate School for International Development and Cooperation, Hiroshima University, Higashi-Hiroshima, Japan
Received: 4 March 2008 – Accepted: 10 March 2008 – Published: 17 April 2008 Correspondence to: M. Haggag ([email protected])
HESSD
5, 1067–1100, 2008 A coupled atmosphere and multi-layer land surface model M. Haggag et al. Title Page Abstract Introduction Conclusions References Tables Figures ◭ ◮ ◭ ◮ Back CloseFull Screen / Esc
Printer-friendly Version Interactive Discussion
Abstract
A multi-layer land surface model (SOLVEG) is dynamically coupled to the non-hydrostatic atmospheric model (MM5) in order to represent better spatial variations and changes in land surface characteristics compared with the land surface parameteriza-tion schemes included in the MM5. In this coupling, calculaparameteriza-tions of the atmosphere
5
and land surface models are carried out as independent tasks of different processors; a model coupler controls these calculations and data exchanges among models us-ing Message Passus-ing Interface (MPI). This coupled model is applied to the record-breaking heavy rain events occurred in Kyushu Island, the southernmost of Japan’s main islands, from 20 July to 25 July in 2006. The test computations are conducted by
10
using both the developed coupled model and the original land surface parameteriza-tion of MM5. The result of these computaparameteriza-tions shows that SOLVEG reproduce higher ground temperature than land surface parameterization schemes in the MM5. This result indicates the feedback of land surface processes between MM5 and SOLVEG plays an important role in the computation. The most pronounced difference is in the
15
rainfall simulation that shows the importance of coupling SOLVEG and MM5. The cou-pled model accurately reproduces the heavy rainfall events observed in Kyushu Island compared to the original MM5 from both the spatial and temporal point of view. This paper clearly shows that realistic simulation of rainfall event strongly depends on land-surface processes interacting with cloud development that depends on land-surface heat
20
and moisture fluxes, which in turn are mainly determined by land surface vegetation and soil moisture storage. Soil temperature/moisture changes significantly affect the localized precipitation and modest improvement in the land surface representation can enhance the heavy rain simulation. MM5-SOLVEG coupling shows a clear image of land surface-atmosphere interactions and the dynamic feedback on convection
initia-25
HESSD
5, 1067–1100, 2008 A coupled atmosphere and multi-layer land surface model M. Haggag et al. Title Page Abstract Introduction Conclusions References Tables Figures ◭ ◮ ◭ ◮ Back CloseFull Screen / Esc
Printer-friendly Version Interactive Discussion
1 Introduction
In the earth environment system, the role of the land surface is to provide the lower boundary condition for the overlaying atmosphere. Characteristics of the land surface processes play a very important role together with sea surface in the distribution of the incoming heat energy into latent and sensible heat fluxes and their exchange with the
5
atmosphere, thus affecting the evolution of the atmospheric boundary layer. Mesoscale atmospheric models depend on Land Surface Models (LSM) to provide surface fluxes of heat, moisture, and momentum from the land surface to the atmosphere. In the last fourty years several land surface models have been developed and applied for diverse climate conditions worldwide. The parameterization of these models differ in complexity
10
from very simple methods to very complicated methods (e.g., Deardorff, 1978; Nagai, 2005; Noilhan and Planton, 1989; Sellers et al., 1996; Wen et al., 2000; Yang and Dickinson, 1996). Inter-comparison studies have been summarized and evaluated the commonly used land surface parameterization schemes (e.g., Chen et al., 1997; Luo et al., 2003; Schlosser et al., 2000). Worldwide, the approach to represent land surface
15
processes into the atmosphere is through coupling of the LSMs and atmosphere mod-els. One-way coupling was implemented in the beginning, in which the atmospheric variables are only passed from the atmosphere models to LSMs with no feedback to the atmosphere models (e.g., Hostetler and Giorgi, 1993; Kite et al., 1994). In con-trast, in two-way coupling, models exchange the relevant parameters; that is, there is
20
feedback from the LSM to the atmosphere model that influences future model-derived fluxes (e.g., Chen and Dudhia, 2001; Maxwell et al., 2007; Seuffert et al., 2002).
Realistic and idealized case studies indicate the extent of the influence of land sur-face processes on the atmosphere. Taylor et al. (1997) used observations to study land surface atmosphere interactions in semiarid areas. They proved that variability of
25
boundary layer is related to previous rainfall events and its associated soil moisture vari-ation patterns. M ¨olders and Raabe (1997) investigated the influence of model coupling on the formation of clouds and precipitation. In a one-day simulation of an idealized
HESSD
5, 1067–1100, 2008 A coupled atmosphere and multi-layer land surface model M. Haggag et al. Title Page Abstract Introduction Conclusions References Tables Figures ◭ ◮ ◭ ◮ Back CloseFull Screen / Esc
Printer-friendly Version Interactive Discussion
case, they showed that runoff modeling influences soil moisture and hence, indirectly, the formation of cloudiness and precipitation by changing the turbulent energy fluxes. Seuffert et al. (2002) coupled the LM model (Doms and Sch ¨attler, 1999) and the land surface hydrologic model known as the TOPMODEL (Peters-Lidard et al., 1997) in a two way-coupling to study the Influence of hydrologic modeling on the predicted local
5
weather. Their results emphasized the importance of the improved simulation of soil moisture and soil temperature fields on reproducing the observed precipitation better than the original LM did. Chen and Dudhia (II, 2001) in their validation study of the NOAH LSM; they compared the performance of the slab model (Blackadar, 1976) and the NOAH LSM model when coupled to the mesoscale meteorological model (MM5)
10
for several rainfall events using the FIFE experiment results (Sellers et al., 1997). Their results for simulating the rainfall events were not conclusive; both LSMs coupled to the MM5 reproduced good estimates of the observed rainfall with similar problems related to the spatial and temporal distribution of the rainfall. Recently Chang et al. (2007) studied the impact of convection and land surface parameterizations on the
simula-15
tion of a heavy rain event over India using both MM5 and the Weather Research and Forecasting model (WRF) with different convection and land surface schemes. They concluded that the rainfall amounts are sensitive to the choice of convective parameter-ization and to the land surface/land use changes. Their land use/land cover sensitivity tests showed that land surface feedback results in broader areal and dynamical
im-20
pacts on rainfall intensity and distribution. Their results indicated that the land surface models in MM5 and WRF need to be further evaluated.
This paper describes the development and application of a dynamically coupled at-mosphere, land surface hydrology model in an ongoing effort to create a comprehen-sive regional environment simulator (Yamashita et al., 2007). The models incorporated
25
in this study are the fifth generation mesoscale non-hydrostatic atmosphere model (MM5) (Grell et al., 1996) that is a well-known atmosphere research model in oper-ation at several meteorological agencies, and the new multi-layer atmosphere vegeta-tion soil model (SOLVEG) (Nagai, 2002, 2003, 2005). The coupling of the models has
HESSD
5, 1067–1100, 2008 A coupled atmosphere and multi-layer land surface model M. Haggag et al. Title Page Abstract Introduction Conclusions References Tables Figures ◭ ◮ ◭ ◮ Back CloseFull Screen / Esc
Printer-friendly Version Interactive Discussion
been carried out to investigate the influence of a state of the-art land surface hydrologic model on the reproduction of the energy fluxes, structure of the atmospheric boundary layer, and precipitation, when compared with observed data and other model configu-ration derived data. The simulation results are evaluated for the two way coupled model system (MM5-SOLVEG) and for the MM5 with its original land surface models.
5
The coupled model is applied to investigate a real case study in Kyushu Island, Japan. A record-breaking heavy rain event occurred over Kyushu, the southernmost of Japan’s main islands in July 2006 causing deadly flooding and mudslides, taking at least 29 lives. The model computation along with recorded data at surface weather station are used altogether to analyze the heavy rainfall over Kyushu Island. The paper
10
is organized as follows: Sect. 2 briefly describes the characteristics of the MM5 and SOLVEG models and the coupling scheme. In Sect. 3, a description of the case study and the different types of datasets are presented. Section 4 presents the structure of the different test cases and results’ evaluation method. The results of the test cases compared with available observations are shown in Sect. 5. Finally, Sect. 6 concludes
15
and summarizes the contents of the paper.
2 Model description and coupling
2.1 MM5 model
The MM5 (Grell, 1996) is a regional, non-hydrostatic model primarily designed to sim-ulate or predict mesoscale and regional-scale weather. The MM5 uses a
terrain-20
following non-dimensional pressure, or sigma-P , vertical coordinate. The MM5 uses an efficient split/semi-implicit temporal integration scheme and has a nested-grid ca-pability. Initial and lateral boundary conditions on the outermost grid mesh can be specified from global circulation models’ 3-D reanalysis or predictions. The slab LSM (Blackadar, 1976) and the NOAH LSM (Chen and Dudhia I, II, 2001) are incorporated
25
HESSD
5, 1067–1100, 2008 A coupled atmosphere and multi-layer land surface model M. Haggag et al. Title Page Abstract Introduction Conclusions References Tables Figures ◭ ◮ ◭ ◮ Back CloseFull Screen / Esc
Printer-friendly Version Interactive Discussion
the complexity of other physics processes of MM5. Soil temperature predicted in 1, 2, 3, 8, and 16 cm layers with fixed substrate below using vertical diffusion equation. An important weak point of the slab model is the soil moisture field that is defined as a function of land use and has only two seasonal values (summer and winter). The soil moisture is kept constant during model computation and cannot reflect the impact
5
of recent precipitation. Chen and Dudhia (I, II, 2001) added the NOAH LSM to the MM5 model. The NOAH LSM is based on coupling the diurnally-dependent Penman potential evaporation approach of Mahrt and Ek (1984) to the multi-layer soil model of Mahrt and Pan (1984), Pan and Mahrt (1987). It has one canopy layer and the fol-lowing prognostic variables: soil moisture, soil ice, soil temperature, water stored on
10
the canopy, and snow stored on the ground. Surface skin temperature is determined following Mahrt and Ek (1984) with a single linearized surface energy balance equation dependent on the surface radiation, turbulent heat, and ground heat fluxes. Because of the extensive prior validation of the MM5, we use it directly to provide the best avail-able representation of the atmosphere and have not made any modifications to the
15
MM5 other than those associated with the flux transfer calls through the developed model coupler.
2.2 SOLVEG model
SOLVEG is originally developed (Yamazawa and Nagai, 1997; Nagai and Yamazawa, 1999) at the Japan Atomic Energy Research Institute (JAERI). It is a multilayered
20
model, therefore, it can aid in clarifying the heat and water exchanges in each layer of the atmosphere-soil-vegetation system. It includes advanced radiation processes for transmission of solar and long wave radiation fluxes in the canopy. The radiation process provides the photosynthetically active radiation (PAR) flux for each layer in the canopy, which is necessary for the photosynthetic CO2 assimilation. The model con-25
siders interactions between the CO2 exchange and the heat/moisture exchanges by
the stomatal resistance scheme based on photosynthesis. SOLVEG’s framework com-bines two types of model concepts; the first type resembles the bulk method, which
HESSD
5, 1067–1100, 2008 A coupled atmosphere and multi-layer land surface model M. Haggag et al. Title Page Abstract Introduction Conclusions References Tables Figures ◭ ◮ ◭ ◮ Back CloseFull Screen / Esc
Printer-friendly Version Interactive Discussion
has been mainly used in atmospheric models to facilitate the exchange process be-tween the atmosphere and plants or soil as a whole (e.g., Chen et al., 1996; Deardorff, 1978; Noilhan and Planton, 1989), the other type is the research model, which uses a multilayer expression for the vegetation canopy to examine the turbulence transfer of momentum, heat, and moisture within and above the canopy (e.g., Meyers and
5
Paw, 1986; Shaw and Schumann, 1992; Yamada, 1982). Nagai (2002, 2003, 2005) have been tested the performance of SOLVEG using observed data in the Cooperative Atmosphere–Surface Exchange Study (LeMone et al., 2000). A comparison with Ore-gon State University LSM (OSULSM) (Chen et al., 1996) and the National Center for Atmospheric Research LSM (Bonan, 1995) was also made (Chen et al., 2003; Yates
10
et al., 2003), and the performance of SOLVEG was comparable to those of the other models.
2.3 Coupling method and models interaction
Calculations of the two models (MM5 and SOLVEG) are carried out as independent tasks at different processors and a model coupling program (coupler) controls these
15
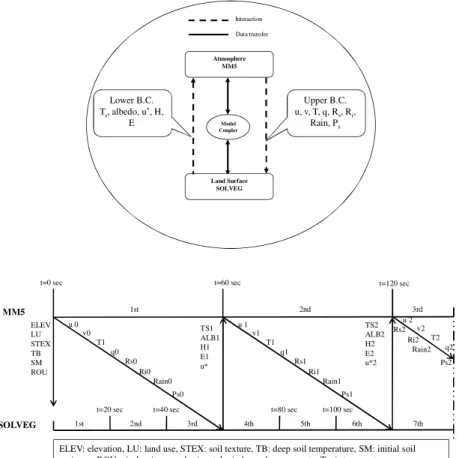
processes and data exchanges between the two models using Message Passing In-terface (MPI). This coupling procedure is based on a similar scheme embedded in SOLVEG. All models and the coupler start together, and the coupler invokes and con-trols calculation processes. It receives 2-D data from one model and distributes them to the other model in arbitrary time intervals. Figure 1 shows the data exchange between
20
MM5 and SOLVEG. At the first time step, MM5 sends the initialization parameters and variables to SOLVEG: elevation (ELEV ), land use (LU), soil texture (STEX ), soil bot-tom temperature (TB), initial soil moisture (SM), initial air density (ROU), air pressure (P s), radiation (solar: Rs, long-wave: Ri ), precipitation (Rain), wind speed (u, v), tem-perature (T ), humidity (q). SOLVEG calculation proceeds for the same time interval
25
as MM5 and sends its results to MM5: skin temperature (T s), albedo, momentum flux (u∗), heat flux (H), and vapor flux (E ). MM5 receives these values in the next time step
HESSD
5, 1067–1100, 2008 A coupled atmosphere and multi-layer land surface model M. Haggag et al. Title Page Abstract Introduction Conclusions References Tables Figures ◭ ◮ ◭ ◮ Back CloseFull Screen / Esc
Printer-friendly Version Interactive Discussion
(PBL) processes. The time step of SOLVEG calculation is usually smaller than that of MM5, and several time steps are carried out for SOLVEG calculation during a single time step of MM5 calculation. For following time steps, this process of data exchange repeats between the two models through the coupler for complete consideration of the interaction between the land surface and the atmosphere.
5
3 Case study and model setup
The East Asian rainy season is called the “Baiu” front in Japanese. It refers to the frontal precipitation that lasts from late June to the end of July in Japan. The front forms when the moist air over the Pacific Ocean meets the cooler continental air mass. In summer 2006, an extraordinary amount of rainfall has been observed over Japan.
10
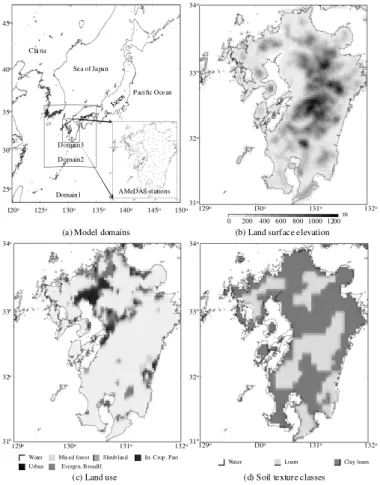
The area that severely affected by that event is located in Kyushu Island. Three nested domains are implemented for that purpose, the geographical locations of the 3-domains and their boundaries are shown in Fig. 2a. Kyushu is mainly mountainous area except for the wide urban area at the top of the island. Kyushu is predominantly mixed for-est with shrubs interspersed, underlain by mostly clay loam on most of the island and
15
mainly loam at the mountainous areas. Elevation, land use, and soil cover are shown in Fig. 2b, c, and d at horizontal resolution of 3 km which is used to represent the third simulation domain. The numerical experiments are performed using 23 vertical levels (with the model top at 100 hpa) and two two-way interactions among the three hori-zontal domains. The model physics in all runs reported here is Reisner graupel mixed
20
phase explicit moisture scheme (Reisner et al., 1998), The Grell cumulus parameteri-zation scheme (Grell et al., 1996), the cloud radiation scheme, and MRF’s PBL scheme (Hong and Pan, 1996). For the surface schemes; the slab LSM, the NOAH LSM and SOLVEG are used to represent the land surface processes. The specific characteris-tics of the model as it is applied in this study are summarized in Table 1.
25
Soil parameters used in SOLVEG are the saturated volumetric soil water content, the saturated hydraulic conductivity, the exponent in the Clapp and Hornberger
equa-HESSD
5, 1067–1100, 2008 A coupled atmosphere and multi-layer land surface model M. Haggag et al. Title Page Abstract Introduction Conclusions References Tables Figures ◭ ◮ ◭ ◮ Back CloseFull Screen / Esc
Printer-friendly Version Interactive Discussion
tions, the wilting volumetric soil water content, and the dry soil heat capacity. These values were determined according to the US Department of Agriculture (USDA) texture classes, by using data by Clapp and Hornberger (1978), Mc-Cumber (1980), and Chen and Dudhia (I, II, 2001). Vegetation leaf surface properties and vegetation structure are given values from global survey of leaf area index of land use classes (Asner et al.,
5
2003).
The computations were initialized using the large-scale analysis global final analy-sis (FNL) data archived at NCAR that exist every 6 h at a spatial resolution of 1◦
×1◦. Japan Meteorological Agency’s (JMA) Grid Point Value (GPV) hourly rainfall forecasts and Tropical Rain Measuring Mission (TRMM) satellite data from 20 to 25 July in 2006
10
are used for validation of model results. Rainfall observation form JMA’s Automated Meteorological Data Acqisition System (AMeDAS) stations are used in the model vali-dation. A total of 165 meteorological stations are employed. A map showing the station locations is shown in Fig. 2a.
4 Model computations
15
Real time simulations of the atmosphere land surface processes over Japan are used to study the performance of the new coupled model, and the evolution of the model-derived rainfall distribution to the spatial variation in land surface characteristics. The lower boundary condition represented in the land surface’s heat/moisture fluxes differs among the different model cases. Three different real case simulations with different
20
land surface parameterization are performed.
1. First, the stand-alone MM5 model is used as a control run, herein after MM5-CTRL. Land surface is parameterized using the slab LSM with five soil layers. 2. Second, the MM5 is run with land surface parameterized using NOAH LSM,
herein after MM5-NOAH.
HESSD
5, 1067–1100, 2008 A coupled atmosphere and multi-layer land surface model M. Haggag et al. Title Page Abstract Introduction Conclusions References Tables Figures ◭ ◮ ◭ ◮ Back CloseFull Screen / Esc
Printer-friendly Version Interactive Discussion
3. Third, the fully coupled MM5-SOLVEG, herein after MM5-CPL, is run with land surface fluxes coming from the coupled calculations.
For the model results evaluation, gridded analysis of the observed precipitation fields has been performed using the adjustable tension continuous curvature surface grid-ding algorithm (Smith and Wessel, 1990). The verification domain is limited to the
5
region of Kyushu Island that contains relatively high-resolution meteorological obser-vations. Since rainfall depends strongly on the atmospheric motion, moisture content, and physical processes, the quality of a model’s rainfall prediction is used as an in-dicator of overall model health. The following continuous statistical measures are in use in this paper: mean value ( ¯O), variance (S2), standard deviation (s), mean error
10
(ME), mean absolute error (MAE), root mean square error (RMSE), and correlation coefficient (r).
5 Analysis and comparison of test cases
5.1 Soil surface variables
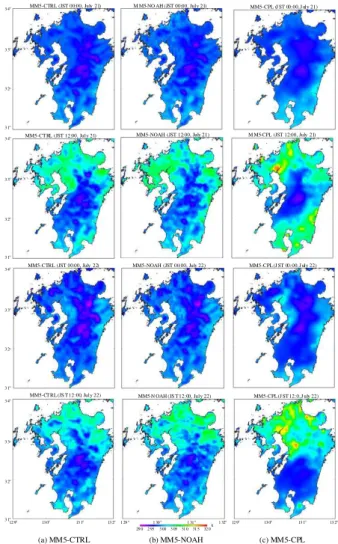
Figure 3 shows the computed ground temperatures (Kelvin) by CTRL,
MM5-15
NOAH, and MM5-CPL with 12 h intervals from 00:00 JST, 21 July to 12:00 JST, 22 July. This time was chosen because it is the period in which most of the rainfall oc-curred (discussed further below). By comparing the results of each case, the ground temperatures reveal patterns similar to the soil moistures. Cooler ground temperatures can be seen in the north of the domain, above 32.5◦N, on 21 July for the cases of 20
MM5-CTRL, and MM5-NOAH. While for MM5-CPL, cooler ground temperatures are found in the south of the domain, below 32.5◦N, on 22 July. This pattern of ground
temperature can be seen as a footprint of the produced rainfall by each model and its corresponding soil moisture variability.
The ground temperatures of MM5-CTRL and MM5-NOAH show small differences. In
25
HESSD
5, 1067–1100, 2008 A coupled atmosphere and multi-layer land surface model M. Haggag et al. Title Page Abstract Introduction Conclusions References Tables Figures ◭ ◮ ◭ ◮ Back CloseFull Screen / Esc
Printer-friendly Version Interactive Discussion
This can be explained by the constant soil moisture used in the slab land surface model of the MM5-CTRL. The ground temperature computed by SOLVEG in the MM5-CPL which fed back into MM5 is higher than that of the MM5-CTRL or MM5-NOAH. Since ground temperature represents the changes in surface soil temperature and moisture conditions in response to atmospheric radiation, the formulation of the radiation and the
5
stomatal resistance scheme in SOLVEG may have a major effect on the difference be-tween the computed ground temperatures. The radiation scheme in SOLEVEG (Nagai, 2003) calculates the four solar radiation components (visible and near infrared bands of direct and diffuse components) separately which have positive effects especially in cloudy days. The stomatal resistance scheme in SOLVEG (Nagai, 2005) based on
pho-10
tosynthesis is a key factor for the heat and water exchange between the atmosphere and land surface.
Generally, we can state that SOLVEG has tendency to produce higher ground perature than the slab land surface model or the NOAH LSM. The higher ground tem-perature heats up the surface layer air, and the higher air temtem-perature causes further
15
rise in ground temperature. This is a positive feedback to MM5 from SOLVEG. An additional variability in the ground temperature fields that is more pronounced in night time more than in day time comes from the influence of the topography in the model domain. The coldest ground temperatures are always found in the mountainous area in the center of Kyushu Island.
20
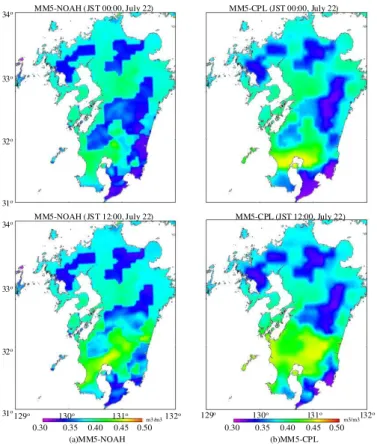
Figure 4 shows two snapshots of the computed soil moisture fields (m3/m3) by MM5-NOAH, and MM5-CPL on 22 July. The land surface parameterization in MM5-CTRL (Blackadar, 1976) uses constant soil moisture and hence is not a part of soil moisture comparison. The variability in the soil moisture distribution comes mainly from the in-fluence of the distributed soil cover and the topography as shown in Fig. 2 over the
25
computational domain. Lower soil moisture values are found in areas of loam com-pared to the areas covered by clay loam, the figure highlights the rough resolution of the incorporated soil texture classes that limits the model capability to represent the soil moisture heterogeneity and its effects on moisture/heat interactions between the
HESSD
5, 1067–1100, 2008 A coupled atmosphere and multi-layer land surface model M. Haggag et al. Title Page Abstract Introduction Conclusions References Tables Figures ◭ ◮ ◭ ◮ Back CloseFull Screen / Esc
Printer-friendly Version Interactive Discussion
land surface and the atmosphere.
For the soil moisture variability, the effect of the coupling of SOLVEG and MM5 is less pronounced than the effect of the soil cover in this case. However, the difference in rainfall fields between MM5-NOAH and MM5-CPL is reflected in higher soil moisture fields in the north of the model domain, above 32.5◦N, on 21 July (not shown) for the 5
case of MM5-NOAH compared to MM5-CPL following the high rainfall rates produced in that day, and higher soil moisture fields in the south of the model domain, below 32.5◦N, on 22 July in the case of MM5-CPL compared to MM5-NOAH following the high
rainfall rates produced on 22 July by the MM5-CPL. The plots show that soil moisture in the case of MM5-NOAH is dried up faster than that of MM5-CPL which retains its soil
10
moisture content for longer time. Despite of the fact that soil cover is pronounced at all times for both MM5-NOAH and MM5-CPL, more heterogeneity of soil moisture can be seen in MM5-CPL. Soil moisture and surface temperature are used to compute the atmospheric turbulence fluxes and to determine the turbulence kinetic energy balance, so more heterogeneous-accurate fields of them mean more accurate heat fluxes from
15
the land surface to the atmosphere. 5.2 Surface heat fluxes
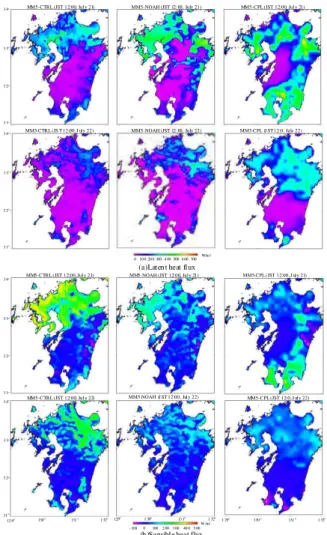
Figure 5 plots the latent heat flux and the sensible heat flux for the different computation cases at 12:00 JST, 21 July and 12:00 JST, 22 July. On the contrary to the case of soil moisture or ground temperature discussed above, there is no obvious effect of
20
the topography or the soil cover on the computed heat fluxes. Day time plots show a pronounced variation among the different model configurations. First, despite of heavy rains, the soil moisture in the MM5-CTRL does not change with being in relatively high sensible heat fluxes and low latent heat fluxes compared with the MM5-NOAH and MM5-CPL. The higher sensible heat flux in the MM5-CTRL is indicative of the
25
urban landscape in the north of Kyushu Island where the big cities of Fukuoka and Kitakyushu are located. The day time latent (sensible) heat flux computed by SOLVEG in CPL is generally higher (lower) than the computed fields by NOAH in
MM5-HESSD
5, 1067–1100, 2008 A coupled atmosphere and multi-layer land surface model M. Haggag et al. Title Page Abstract Introduction Conclusions References Tables Figures ◭ ◮ ◭ ◮ Back CloseFull Screen / Esc
Printer-friendly Version Interactive Discussion
NOAH. This matches the previous tests by Godfrey et al. (2007) and Yates et al. (2003) which mentioned that forecasts by the NOAH LSM consistently underestimate midday latent heat fluxes by 20–40% compared with observations on clear days. These errors primarily come from partitioning errors between the fluxes of sensible and latent heat that may arise number of problems, such as incorrect estimates of moisture availability,
5
skin temperature, and resistance to heat flux. 5.3 Rainfall patterns and variability
Figure 6 shows the total cumulative rainfall distribution of the different computa-tional cases, AMeDAS observation, TRMM, and JMA-GPV’s rainfall for 6 days, from 00:00 JST, 20 July to 23:00 JST, 25 July. There is a pronounced variation in the
rain-10
fall intensity distribution computed by MM5-CTRL or MM5-NOAH and the computed rainfall intensity distribution by MM5-CPL. Interpolation of observed rainfall shows that the area bounded by 31.5◦N–32.5◦N received most of the rainfall with peak
cumula-tive rainfall depth of 1161 mm at Shibisan station (130.36◦E, 31.98◦N). This pattern is
only produced by the MM5-CPL with even similar distribution of the model cells that
15
received the maximum rainfall depths. Derived rainfall fields by CTRL and MM5-NOAH shows similar pattern that is clearly contradict with those of the MM5-CPL and the observations. Both TRMM and JMA-GPV shows heavy rainfall depth centred at (32◦N, 130.5◦E) which conforms to the rainfall fields produced by the MM5-CPL, but
both of them underestimated the rainfall depth considerably. TRMM’s maximum
accu-20
mulated rainfall is about 450 mm, while JMA-GPV’s maximum accumulated rainfall is about 700 mm compared to a maximum accumulated rainfall depth of 1161 mm from the surface rain gauges. The target of considering both TRMM and JMA-GPV is to evaluate the areal rainfall distribution produced by the different model configuration with other independent reliable rainfall datasets. In fact, it was not expected to have
25
such improvement in the rainfall simulation results. Further analysis of the test case experiments will be done to understand the impact of land surface processes and the grid spacing on the simulation of the heavy rainfall event in July 2006.
HESSD
5, 1067–1100, 2008 A coupled atmosphere and multi-layer land surface model M. Haggag et al. Title Page Abstract Introduction Conclusions References Tables Figures ◭ ◮ ◭ ◮ Back CloseFull Screen / Esc
Printer-friendly Version Interactive Discussion
Figure 7 shows the daily cumulative rainfall distribution of the MM5-NOAH, MM5-CPL and AMeDAS observations on 20 and 22 July. On 20 July, heavy rainfall band (200– 600 mm) bounded between (32.5◦N to 33.5◦N) is reproduced by the MM5-CTRL and
MM5 NOAH with higher intensities in MM5-NOAH. This heavy rainfall band can be seen neither in the AMeDAS observations nor in CPL. The rainfall computed by
MM5-5
CPL matches the AMeDAS observation fields with higher rainfall intensities of MM5-CPL. On 21 July, two heavy rainfall bands (∼200 mm) bounded between (31.5◦N to
33◦N) (not shown) are produced by the MM5-CPL matching the AMeDAS observation
fields. Neither MM5-CTRL nor MM5-NOAH could reproduce the rain events on 21 July over the land area of Kyushu. On 22 July, heavy rainfall (200–500 mm) is observed in
10
the location of (130.5◦E, 132◦N) with two heavy rainfall zones in the east and the west
of 130.5◦E. MM5-CPL captured well this event despite of the computed rainfall area
being shifted little to the south of the AMeDAS observation position. This heavy rainfall cannot be reproduced in the computation by MM5-CTRL or MM5-NOAH.
Such great improvement in the simulation of the rainfall pattern of the developed
15
coupled model (MM5-SOLVEG) compared to MM5 with its original LSMs raises an im-portant question about the reasons why MM5-CPL can reproduce such well-simulated rainfall patterns. The land surface processes in the continent of mainland China can be the strong candidate reason for simulation improvement. Assessment of this hypothe-sis is done by performing 4 extra computational experiments with simulation domains
20
that exclude/include mainland China on the west boundary using both MM5-NOAH and MM5-CPL, respectively. Figure 8 shows a comparison of the total rainfall distribution in our temporal domain for the four cases with and without mainland China on the west boundary of the coarsest simulation domain. However, the effect of the China mainland boundary on the rainfall distribution is pronounced, this hypothesis could not explain
25
the reasons of improvement. The southern shift in the rainfall distribution over south and west of Japan is not a function of the land border of China continent. The results from the MM5-CPL give accurate distribution of rainfall compared to the results from the original MM5.
HESSD
5, 1067–1100, 2008 A coupled atmosphere and multi-layer land surface model M. Haggag et al. Title Page Abstract Introduction Conclusions References Tables Figures ◭ ◮ ◭ ◮ Back CloseFull Screen / Esc
Printer-friendly Version Interactive Discussion
Another possible explanation of the improvement of rainfall pattern by the developed coupled model is derived from the basics of meteorological physics; it is well known that the uneven heating of the land surface results in temperature gradients at the ground surface. Warmer surface areas heat the overlaying air mass and force it to rise in the atmosphere causing reduction in the surface pressure compared to an increase
5
in the surface pressure at locations of cooler air temperature. The resulting pressure gradient forces wind movement from areas of high pressure to areas of low pressure to restore the pressure balance in the atmosphere. The clouds move at a speed and direction of the prevailing wind at the altitude where the clouds are occurring, and the rainfall areal distribution is a direct function of the clouds areal distribution. These
10
simple basics of the atmospheric physics enable us to explain the reasons behind the enhancement in the simulation of the rainfall results over South Japan. As explained earlier, SOLVEG has a tendency to produce higher ground temperature compared to the slab LSM or NOAH LSM as shown in Fig. 3. The higher ground temperature heats up the surface layer air and force it to rise to upper layers causing areas of lower
15
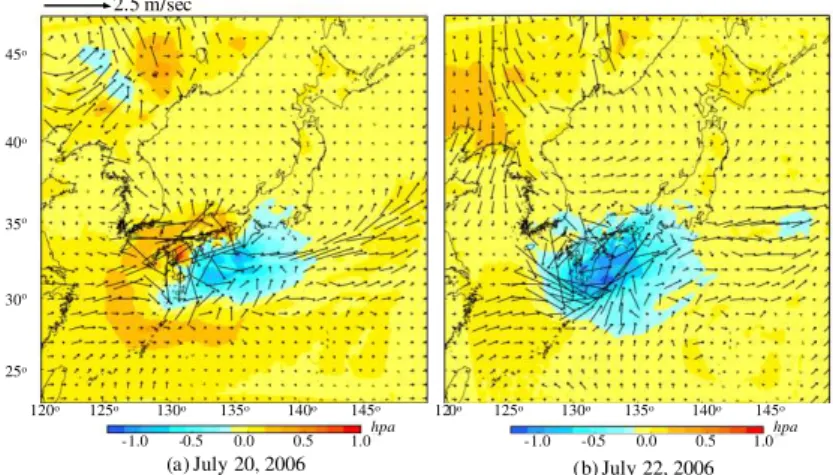
atmospheric pressure. Figure 9 shows the difference in the average sea level pressure between MM5-CPL and MM5-NOAH overlaid by the difference in the average surface wind vectors (at 10 m above sea level) on 20 July and 22 July, respectively. A large area of lower pressure is found to cover the whole southern and western part of Japan in the case of MM5-CPL compared to MM5-NOAH. A stronger north-west surface wind
20
is generated in the case of MM5-CPL toward the area of lower atmospheric pressure. This difference in wind field caused the shift of cloud system to the south resulting in an accurate pattern of rainfall distribution from the coupled model computation (see Fig. 10).
As regards to the effect of model grid spacing (resolution) on precipitation, as
antic-25
ipated and consistent with past studies, with higher model resolution, the mesoscale model simulates higher precipitation amounts that are closer to the observations. The rain rate from 3 km grid spacing is also higher than rain rate from 9 km and 27 km grid spacing which can be attributed to the consideration of detailed surface representation
HESSD
5, 1067–1100, 2008 A coupled atmosphere and multi-layer land surface model M. Haggag et al. Title Page Abstract Introduction Conclusions References Tables Figures ◭ ◮ ◭ ◮ Back CloseFull Screen / Esc
Printer-friendly Version Interactive Discussion
and explicit cloud-resolving microphysics in the finer grid domain (see Fig. 10). 5.4 Statistical summaries
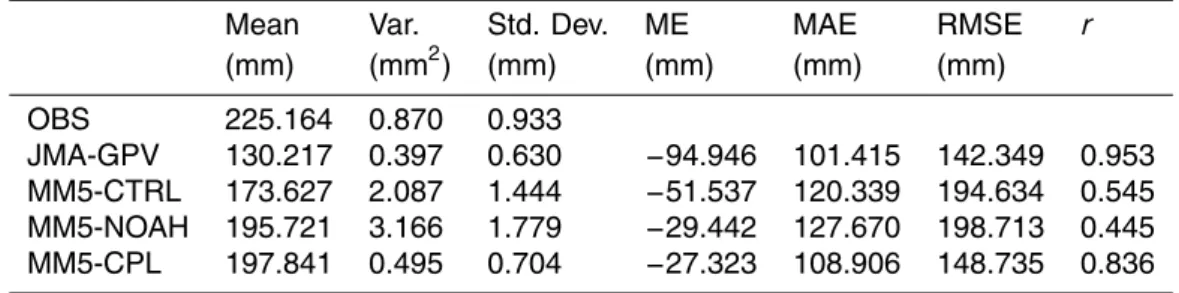
After the visual verification done above, further statistical measures are found to be of use in clarifying the performance of the different model configuration in reproducing the heavy rainfall events of the case study. The mean value, variance, standard deviation,
5
mean error, mean absolute error, root mean square error, and correlation coefficient are the continuous statistical measures used here. Table 2 summarizes the different statistical measures. The mean value of the observed accumulated rainfall from 20 to 25 July is underestimated by all model configurations with MM5-CPL has the most accurate value compared to the other model configurations. The variance and standard
10
deviation which describes the rainfall variability has a minimum value in case of MM5-CPL compared to all other cases. The mean error that measures the average difference between model computation and observed values shows best performance in the case of MM5-CPL. The error between the observation and the model computed rainfall depth has a minimum value in case of MM5-CPL. The mean absolute error and the root
15
mean square error similarly shows good performance of MM5-CPL in reproducing the rainfall depths compared to MM5-CTRL, MM5-NOAH. For the correlation coefficient, MM5-CPL and JMA-GPV shows the highest values of r (0.65 to 0.95) compared to inadequate correlation given by MM5-CTRL or MM5-NOAH (0.2 to 0.55).
6 Summary and conclusions
20
This paper described the development and application of a dynamically coupled atmosphere-land surface-hydrology model. The models incorporated in this study are the non-hydrostatic atmospheric model (MM5), and the ,state of the art, multi-layer at-mosphere vegetation soil model (SOLVEG) to better represent spatial variations and changes in land surface characteristics compared to the current land surface
HESSD
5, 1067–1100, 2008 A coupled atmosphere and multi-layer land surface model M. Haggag et al. Title Page Abstract Introduction Conclusions References Tables Figures ◭ ◮ ◭ ◮ Back CloseFull Screen / Esc
Printer-friendly Version Interactive Discussion
terization included in MM5. In this coupling, the models are two-way coupled with full consideration of momentum, energy, and water exchanges between the atmosphere and land-surface. A number of short-term numerical experiments were conducted to evaluate the MM5 model coupled with SOLVEG. The performance of three model con-figurations (one with the slab LSM, another with the NOAH LSM, and the last with
5
SOLVEG) against the rainfall observed over Kyushu Island, Japan in the period from 20 to 25 July in 2006 is documented. Satellite rainfall estimates based on TRMM and JMA-GPV’s operational forecasts are used for the evaluation of the results by the cou-pled model along with AMeDAS surface rain gauge measurements.
The results of the case study indicate that the coupled MM5-SOLVEG leads to the
10
most promising results. The improved simulation of soil moisture fields in conjunction with improved simulation of the surface temperature leads to better computation of energy fluxes, and precipitation. The results showed that, in general SOLVEG has ten-dency to produce higher ground temperature than the slab LSM, and the NOAH LSM indicating the positive feedback to MM5 from SOLVEG. The simulated latent and
sen-15
sible heat fluxes using SOLVEG seems to make clear the reported problem of the un-derestimated latent heat flux from NOAH. Detailed parameterization in SOLVEG works well in the portioning of the available heat fluxes into latent and sensible heat flux on the land surface. The results indicate the potential to improve predictions of boundary layer and cloud microphysics processes by incorporating advanced physical processes
20
on the land surface.
The most pronounced difference among the different model configurations results is in the rainfall simulation. The MM5 model coupled with SOLVEG shows a great im-provement in reproducing the observed heavy rainfall in the case study compared to the original land surface model in the MM5 model. Both spatial and temporal
distri-25
butions of the heavy rainfall are reproduced with sufficient accuracy. The MM5 with its slab LSM and NOAH LSM failed to locate the rainfall in its correct position with pronounced underestimation of the rainfall depth. The results show the large impact of SOLVEG and MM5 coupling. It also points out the inadequacy of the current land
HESSD
5, 1067–1100, 2008 A coupled atmosphere and multi-layer land surface model M. Haggag et al. Title Page Abstract Introduction Conclusions References Tables Figures ◭ ◮ ◭ ◮ Back CloseFull Screen / Esc
Printer-friendly Version Interactive Discussion
surface parameterization in MM5 for the reproduction of heavy rainfall events.
In fact, it is very difficult to describe reasons for the different rain distribution patterns among the different computation cases. Heterogeneity of the surface layer causes differences in latent heat fluxes, while the treatment of sensible heat flux with skin tem-perature in the slab model and with ground temtem-perature in the NOAH and SOLVEG
5
appears to cause thermal differences in the boundary layer. The SOLVEG run warmed and moistened during the computation time compared to the original land surface mod-els in MM5. The improvement in reproducing the rainfall pattern by the developed cou-pled model calculation is explained by a stronger north-west wind caused a southern shift in the cloud system over South Japan. The strong north-west wind was a result of
10
a stronger pressure gradient computed by the coupled model as a function of ground temperature gradient. Such result is evidence that the realistic simulation of rainfall generation depends strongly on land-surface processes interacting with cloud micro-physics. Soil temperature/moisture changes significantly affect localized precipitation over Kyushu Island and modest improvement in the land surface representation can
15
enhance the heavy rain computations. MM5-SOLVEG coupling shows a clear image of the land surface-atmosphere interactions and the dynamic feedback on convection initiation, storm propagation and precipitation.
Acknowledgements. The first author is supported by the scholarship of the Japanese Ministry
of Education, Culture, Sports, Science and Technology, (MEXT). Authors are grateful to H.
Na-20
gai, the developer of SOLVEG model for his continuous support and recommendation that added to the clarity of this manuscript.
References
Asner G. P., Scurlock J. M., and Hicke J. A.: Global synthesis of leaf area index observations: implications for ecological and remote sensing studies, Global Ecol. Biogeogr., 12, 191–205,
25
2003.
HESSD
5, 1067–1100, 2008 A coupled atmosphere and multi-layer land surface model M. Haggag et al. Title Page Abstract Introduction Conclusions References Tables Figures ◭ ◮ ◭ ◮ Back CloseFull Screen / Esc
Printer-friendly Version Interactive Discussion
Atmospheric Turbulence and Air Quality, Rayleigh, NC, 19–22, Amer. Meteor. Soc., Boston, 46–49, 1976.
Bonan, G. B.: Land-atmosphere CO2 exchange simulated by a land surface process model coupled to an atmospheric general circulation model, J. Geophys. Res., 100, 2817–2831, 1995.
5
Chang, H. I., Kumar, A., Niyogi, D., Mohanty, U. C., Chen, F., and Dudhia, J.: Impact of con-vection and land surface parameterizations on the simulation of the July 26, 2005 heavy rain event over Mumbai, India, J. Global Planet. Change, in press, 2008.
Chen, F., Mitchell, K., Schaake, J., Xue, Y., Pan, H.-L., Koren, V., Duan, Q., Ek, M., and Betts, A.: Modeling of land-surface evaporation by four schemes and comparison with FIFE
10
observations, J. Geophys. Res., 101, 7251–7268, 1996.
Chen, F. and Dudhia, J.: Coupling an advanced land surface–hydrology model with the Penn State-NCAR MM5 Modeling System. Part I: model implementation and sensitivity, Mon. Weather Rev., 129, 569–585, 2001.
Chen, F. and Dudhia, J.: Coupling an advanced land surface-hydrology model with the Penn
15
State-NCAR MM5 Modeling System. Part II: preliminary model validation, Mon. Weather Rev., 129, 587–604, 2001.
Chen, F., Yates, D. N., Nagai, H., LeMone, M. A., Ikeda, K., and Grossman, R. L.: Land surface heterogeneity in the Cooperative Atmosphere Surface Exchange Study (CASES-97). Part I: Comparing modeled surface flux maps with surface-flux tower and aircraft measurements, J.
20
Hydrometeorol., 4, 196–218, 2003.
Chen, T., Henderson-Sellers, A., Milly, P. C. D., et al.: Cabauw experimental results from the project for intercomparison of land-surface parameterization schemes, J. Climate, 10, 1194– 1215, 1997.
Clapp, R. B. and Hornberger, G. M.: Empirical equations for some hydraulic properties, Water
25
Resour. Res., 14, 601–614, 1978.
Deardorff, J. W.: Efficient prediction of ground surface temperature and moisture with inclusion of a layer of vegetation, J. Geophys. Res., 83, 1889–1903, 1978.
Doms, G. and Sch ¨attler, U.: The non-hydrostatic limited-area model LM (Lokal-Modell) of the DWD. Deutscher Wetterdienst, Tech. Rep., 180 pp., available from Deutscher Wetterdienst;
30
Offenbach D-63004, Germany, 1999.
Godfrey, C. M., Stensrud, D. J., and Leslie, L. M.: A new latent heat flux parameterization for land surface models. Preprints, 21st Conf. on Hydrology, San Antonio, TX, Amer. Meteor.
HESSD
5, 1067–1100, 2008 A coupled atmosphere and multi-layer land surface model M. Haggag et al. Title Page Abstract Introduction Conclusions References Tables Figures ◭ ◮ ◭ ◮ Back CloseFull Screen / Esc
Printer-friendly Version Interactive Discussion
Soc., CD-ROM, 6A.3, 2007.
Grell, G., Dudhia, J., and Stauffer, D.: A description of the fifth generation Penn State/NCAR Mesoscale Model (MM5), NCAR/TN-398+STR, 117 pp., 1996.
Hong, S. Y. and Pan, H. L.: Nonlocal boundary layer vertical diffusion in a medium-range forecast model, Mon. Weather Rev., 124, 2322–2339, 1996.
5
LeMone, M. A., Grossman, R., Coulter, R., et al.: Land-atmosphere interaction research, early results, and opportunities in the Walnut River watershed in southeast Kansas: CASES and ABLE, B. Am. Meteorol. Soc., 81, 757–779, 2000.
Luo, L., Robock, A., Vinnikov, K., et al.: Effects of frozen soil on soil temperature, spring infil-tration, and runoff: Results from the PILPS 2(d) experiment at Valdai, Russia, J.
Hydromete-10
orol., 4, 334–351, 2003.
M ¨olders, N. and Raabe, A.: Testing the effect of a two-way coupling of a meteorological and a hydrologic model on the predicted local weather, J. Atmos. Res., 45, 81–107, 1997.
Mahrt, L. and Pan, H. L.: A two-layer model of soil hydrology, Bound.-Lay. Meteorol., 29, 1–20, 1984.
15
Mahrt, L. and. Ek, M.: The influence of atmospheric stability on potential evaporation, J. Clim. Appl. Meteorol., 23, 222–234, 1984.
Maxwell, R. M., Chow, F. K, and Kollet, S. J.: The groundwater–land-surface-atmosphere con-nection: soil moisture effects on the atmospheric boundary layer in fully-coupled simulations, Adv. Water Resour., 30, 2447–2466, 2007.
20
McCumber, M. C.: A numerical simulation of the influence of heat and moisture fluxes upon mesoscale circulations, Ph.D. dissertation, University of Virginia, 255 pp., 1980.
Meyers, T. P. and Paw, U. K. T.: Testing of a higher-order closure model for modeling airflow within and above plant canopies, Bound.-Lay. Meteorol., 37, 297–311, 1986.
Nagai, H. and Yamazawa, H.: Development of one-dimensional atmosphere-soil-vegetation
25
model, Japan Atomic Energy Research Institute Rep. 99–124, 88 pp., 1999 in Japanese. Nagai, H.: Incorporation of CO2 exchange processes into a multilayer
atmosphere-soil-vegetation model, J. Appl. Meteorol., 44, 1574–1592, 2005.
Nagai, H.: Validation and sensitivity analysis of a new atmosphere-soil -vegetation model. Part II: Impacts on in-canopy latent heat flux over a winter wheat field determined by detailed
30
calculation of canopy radiation transmission and stomatal resistance, J. Appl. Meteorol., 42, 434–451, 2003.
HESSD
5, 1067–1100, 2008 A coupled atmosphere and multi-layer land surface model M. Haggag et al. Title Page Abstract Introduction Conclusions References Tables Figures ◭ ◮ ◭ ◮ Back CloseFull Screen / Esc
Printer-friendly Version Interactive Discussion
Meteorol., 41, 160–176, 2002.
Noilhan, J. and Planton, S.: A simple parameterization of land surface processes in meteoro-logical models, Mon. Weather Rev., 117, 536–549, 1989.
Pan, H. L. and Mahrt, L.: Interaction between soil hydrology and boundary-layer development, Bound.-Lay. Meteorol., 38, 185–202, 1987.
5
Peters-Lidard, C. D., Zion, M. S., and Wood, E.: A soil–vegetation-atmosphere transfer scheme for modeling spatially variable water and energy balance processes, J. Geophys. Res., 102, 4303–4324, 1997.
Pleim, J. and Xiu, A.: Development and testing of a surface flux and planetary boundary layer model for application in mesoscale models, J. Appl. Meteorol., 34, 16–32, 1995.
10
Reisner, J., Rasmussen, R. J., and Bruintjes, R. T.: Explicit forecasting of supercooled liquid water in winter storms using the MM5 mesoscale model, Q. J. Roy. Meteor. Soc., 124, 1071– 1107, 1998.
Schlosser, C., Satter, A., Robock , A., et al.: Simulations of a boreal grassland hydrology at Valdai, Russia: PILPS phase 2(d), Mon. Weather Rev., 128, 301–321, 2000.
15
Sellers, P. J, Collatz, G. J., Randall, D. A., et al.: A revised land surface parameterization (SiB2) for atmospheric GCMs. Part I: Model formulation, J. Climate, 9, 676–705, 1996.
Sellers, P. J., Hall, F. J., Asrar, G., Strebel, D. E., and Murphy, F. F.: an overview of the first international satellite land surface climatology project (ISLSCP) field experiment (FIFE), J. Geophys. Res. 18, 345–371, 1997.
20
Seuffert, G., Gross, P., Simmer, C., and Wood, E. F.: The influence of hydrologic modeling on the predicted local weather: two-way coupling of a mesoscale weather Prediction model and a land surface hydrologic model, J. Hydrometeorol., 3(5), 505–523, 2002.
Shaw, R. H. and Schumann, U.: Large-eddy simulation of turbulent flow above and within a forest, Bound.-Lay. Meteorol., 61, 47–64, 1992.
25
Smith, W. H. F, and Wessel, P.: Gridding with continuous curvature splines in tension, Geo-physics, 55, 293–305, 1990.
Taylor, C. M., Said, F., and Lebel, T.: Interactions between the land surface and mesoscale rainfall variability during HAPEX-Sahel, Mon. Weather Rev., 125, 2211–2227, 1997.
Yamada, T.: A numerical model study of turbulent airflow in and above a forest canopy, J.
30
Meteorol. Soc. Jpn., 60, 439–454, 1982.
Yamashita, T., Kim, K. O., Lee, H. S., and Haggag, M.: Environment Simulator: Contribution to Coastal Engineering Problems, Ann. J. Coastal Eng., 54, 1301–1305, 2007 in Japanese.
HESSD
5, 1067–1100, 2008 A coupled atmosphere and multi-layer land surface model M. Haggag et al. Title Page Abstract Introduction Conclusions References Tables Figures ◭ ◮ ◭ ◮ Back CloseFull Screen / Esc
Printer-friendly Version Interactive Discussion
Yamazawa, H. and Nagai, H.: Development of one dimensional atmosphere-bare soil model, Japan Atomic Energy Research Institute Rep. 97–041, 56 pp., 1997 in Japanese.
Yang, Z. L. and Dickinson, R. E.: Description of the Biosphere-Atmosphere soil moisture sim-ulation transfer scheme (BATS) for the soil moisture workshop and evaluation of its perfor-mance, Global Planet. Change, 13, 117–134, 1996.
5
Yates, D. N., Chen, F., and Nagai, H.: Land surface heterogeneity in the Cooperative Atmo-sphere Surface Exchange Study (CASES-97). Part II: Analysis of spatial heterogeneity and its scaling, J. Hydrometeorol., 4, 219–234, 2003.
HESSD
5, 1067–1100, 2008 A coupled atmosphere and multi-layer land surface model M. Haggag et al. Title Page Abstract Introduction Conclusions References Tables Figures ◭ ◮ ◭ ◮ Back CloseFull Screen / Esc
Printer-friendly Version Interactive Discussion
Table 1. Computational descriptions.
Characteristics Description
Top of model 100 hPa
Number of computational levels 23
Computational Sigma levels 1.00, 0.99, 0.98, 0.96, 0.93, 0.89, 0.85, 0.80, 0.75, 0.70, 0.65, 0.60, 0.55, 0.50, 0.45, 0.40, 0.35, 0.30, 0.25, 0.20, 0.15, 0.10, 0.05, 0.00 Grid increment (D1) 27 km
Horizontal mesh size (D1) 84×99
Grid center (D1) 34.95◦N, 134.95◦E Grid increment (D2) 9 km
Horizontal mesh size (D2) 94×94 Grid increment (D3) 3 km Horizontal mesh size (D3) 115×97
HESSD
5, 1067–1100, 2008 A coupled atmosphere and multi-layer land surface model M. Haggag et al. Title Page Abstract Introduction Conclusions References Tables Figures ◭ ◮ ◭ ◮ Back CloseFull Screen / Esc
Printer-friendly Version Interactive Discussion
Table 2. Statistical summary for 6 d of cumulative rainfall data (from 00:00, 20 July to 23:00, 25
July in 2006).
Mean Var. Std. Dev. ME MAE RMSE r
(mm) (mm2) (mm) (mm) (mm) (mm) OBS 225.164 0.870 0.933 JMA-GPV 130.217 0.397 0.630 −94.946 101.415 142.349 0.953 MM5-CTRL 173.627 2.087 1.444 −51.537 120.339 194.634 0.545 MM5-NOAH 195.721 3.166 1.779 −29.442 127.670 198.713 0.445 MM5-CPL 197.841 0.495 0.704 −27.323 108.906 148.735 0.836 Mean = mean value of rainfall data over the computational domain.
Var. = variance of rainfall data.
Std. Dev. = Standard deviation of rainfall data.
ME = mean error between observation and computations.
MAE = mean absolute error between observation and computations. RMSE = root mean square error between observation and computations.
HESSD
5, 1067–1100, 2008 A coupled atmosphere and multi-layer land surface model M. Haggag et al. Title Page Abstract Introduction Conclusions References Tables Figures ◭ ◮ ◭ ◮ Back CloseFull Screen / Esc
Printer-friendly Version Interactive Discussion MM5 SOLVEG t=0 sec t=20 sec t=40 sec t=60 sec t=80 sec t=120 sec TS2 ALB2 H2 E2 u*2 ELEV LU STEX TB SM ROU t=100 sec u 0 TS1 ALB1 H1 E1 u*
ELEV: elevation, LU: land use, STEX: soil texture, TB: deep soil temperature, SM: initial soil moisture, ROU: air density, u, v: horizontal wind speed components, T: air temperature, q: humidity, Rs: short wave radiation, Ri: long wave radiation, Rain: rainfall intensity, Ps: surface pressure, TS: skin temperature, H: heat flux, E: moisture flux, u*: momentum flux
v0 T1 q0 Rs0 Ri0 Rain0 Ps0 u 1 v1 T1 q1 Rs1 Ri1 Rain1 Ps1 u 2 v2 T2 q2 Rs2 Ri2 Rain2 Ps2 1st 2nd 3rd 1st 2nd 3rd 4th 5th 6th 7th Atmosphere MM5 Land Surface SOLVEG Upper B.C. u, v, T, q, Rs, Ri, Rain, Ps Model Coupler Interaction Data transfer Lower B.C. Ts, albedo, u*, H, E
Fig. 1. Coupling method and data exchange in the atmosphere-land surface coupled model for
HESSD
5, 1067–1100, 2008 A coupled atmosphere and multi-layer land surface model M. Haggag et al. Title Page Abstract Introduction Conclusions References Tables Figures ◭ ◮ ◭ ◮ Back CloseFull Screen / Esc
Printer-friendly Version Interactive Discussion
Water Mix ed forest Shrub lan d Irr. C rop . Past
Urban Evergr n. B roadlf. Water Loam Clay loam
(b) Land surface elevation
(c) Land use (d) Soil texture classes (a) Model domains
C hi na
Sea of Japan
P aci fic Ocean
AMeDAS st ations Domain1 Domain2 Domain3 45o 40o 35o 25o 34o 33o 32o 31o 30o 34o 33o 32o 31o 34o 33o 32o 31o 120o 125o 130o 135o 140o 145o 150o 130o 131o 129o 130o 131o 132o 129o 132o 129o 130o 131o 132o 0 200 400 600 800 1000 1200 m
Fig. 2. (a) Computational domain configurations over Japan with a subfigure that shows
the AMeDAS stations in Kyushu, (b) land surface elevation for the third computation domain based on the USGS global terrain height data, (c) land use map based on the US Geologi-cal Survey (USGS) global land use classes, and (d) soil texture classes based on the global FAO+STATSGO 17 category soil data.
HESSD
5, 1067–1100, 2008 A coupled atmosphere and multi-layer land surface model M. Haggag et al. Title Page Abstract Introduction Conclusions References Tables Figures ◭ ◮ ◭ ◮ Back CloseFull Screen / Esc
Printer-friendly Version Interactive Discussion
M M5-NO AH (JST 00:00, July 21) MM5-CPL (J ST 00:00, J uly 21) MM5-CTRL (JST 00:00, July 21)
MM5-NOAH (JST 12:00, July 21) M M5-CPL (JST 12:00, July 21) MM5-CT RL (JST 12:00, July 21)
MM5-NOAH (JST 00:00, July 22) MM5-CPL (J ST 00:00, J uly 22) MM5-CTRL (JST 00:00, July 22)
MM5-N OAH (JS T 12:00, July 22) MM5-CPL (J ST 12:0, J uly 22) MM5-CT RL (JS T 12:00, July 22) (a) MM5-CTRL (b) MM5-NOAH (c) MM5-CPL 3 4o 3 3o 3 2o 3 1o 3 4o 3 3o 3 2o 3 1o 3 4o 3 3o 3 2o 3 1o 3 4o 3 3o 3 2o 3 1o 1 29o 1 30o 1 31o 1 32o 12 9o 13 0o 13 1o 13 2o k 12 9o 13 0o 13 1o 13 2o 29 02 953 003 0531 031 532 0
Fig. 3. Ground temperature (Kelvin), for the different computation cases from 21 to 22 July
HESSD
5, 1067–1100, 2008 A coupled atmosphere and multi-layer land surface model M. Haggag et al. Title Page Abstract Introduction Conclusions References Tables Figures ◭ ◮ ◭ ◮ Back CloseFull Screen / Esc
Printer-friendly Version Interactive Discussion
MM5-NOAH (JST 00:00, July 22) MM5-CPL (JST 00:00, July 22)
MM5-NOAH (JST 12:00, July 22) MM5-CPL (JST 12:00, July 22)
m3/m3 34o 33o 32o 31o 34o 33o 32o 31o 0.30 130o 131o 129o 130o 131o 132o 0.35 0.40 0.45 m3 /m3 0.50 0.30 0.35 0.40 0.45 0.50 129o 132o (a)MM5-NOAH (b)MM5-CPL
HESSD
5, 1067–1100, 2008 A coupled atmosphere and multi-layer land surface model M. Haggag et al. Title Page Abstract Introduction Conclusions References Tables Figures ◭ ◮ ◭ ◮ Back CloseFull Screen / Esc
Printer-friendly Version Interactive Discussion
MM5-NOAH (JST 12:00, July 21) MM5-CPL (JST 12:00, July 21) MM5-CTRL (JST 12:00, July 21)
MM5-NOAH (JST 12:00, July 22) MM5-CPL (J ST 12:0, July 22) MM5-CTRL (JS T 12:00, J uly 22)
(a)Laten t heat flux
MM5-NOAH (JST 12:00, July 21) MM5-NOAH (J ST 12:00, July 22) MM5-CPL (JST 12:00, J uly 21) MM5-CPL (JST 12:0, J uly 22) MM5-CTRL (JST 12:00, July 21) MM5-CTRL (JST 12:00, July 22)
(b )Sensible heat flux
0 10 0 20 0 300 4 00 500 6 00 700W/m2 3 4o 3 3o 3 2o 3 1o 3 4o 3 3o 3 2o 3 1o 3 4o 3 3o 3 2o 3 1o 3 4o 3 3o 3 2o 130o 131o 1 32o 31o 12 9o 0 1002 00 3 0040 0 - 100 W /m2 5 00 129o 1 30o 13 1o 1 32o 1 29o 130o 131o 1 32o
Fig. 5. Latent and sensible heat fluxes (W/m2) for the different computational cases at 12:00 JST, on 21 and 22 July, 2006.
HESSD
5, 1067–1100, 2008 A coupled atmosphere and multi-layer land surface model M. Haggag et al. Title Page Abstract Introduction Conclusions References Tables Figures ◭ ◮ ◭ ◮ Back CloseFull Screen / Esc
Printer-friendly Version Interactive Discussion 100 200 300 400 500 600 700 800 900 100 200 300 400 500 600 800 100 200 300 400 500 200 300 100 100 200 300 400 500 600 300 200 300 100 300 300 400 500 600 700 800 900 700 800 300 400 300 100 100 100 100 100 100 200 300 100 200 200 300 300 400500 300 200 300 400 400 500 200 100 200 300 100 100 100 200 100 200 300 400 500 600 300 300 300 400 500 500 200 300 400 300 500 600 700300 200 100 300 200 400 100 800 100 100 (a) MM5 -CTRL (b) MM5- NOAH (c) MM5 -CPL
(f) AMeDAS ob serv ation
100 150 200 250 300 350 400 450 200 100 150 450 400 350 300 250 200 150 100 100 50 150 200 250300 350 400 400 350 450 650 700 150 200 300 100 100 100 150 200 250 150 200 300 250 200 250 350 350 (d) TRMM ( e) JMA-GPV 34o 33o 32o 31o 34o 33o 32o 31o 1 30o 131o 129o 1 32o129o 1 30o 131o 13 2o1 29o 1 30o 1 31o 13 2o
HESSD
5, 1067–1100, 2008 A coupled atmosphere and multi-layer land surface model M. Haggag et al. Title Page Abstract Introduction Conclusions References Tables Figures ◭ ◮ ◭ ◮ Back CloseFull Screen / Esc
Printer-friendly Version Interactive Discussion 0 50 100 100 50 50 50 50 100 100 150 100 50 50 100 150 150 150 100 250 200300 350 50 50 100 150 200 250 200 300 400 250 500 400 450 100 200300 100 150200 300 100 50 200 100 100 100 50 300 400 100 50 200
MM5-NOAH MM5- CPL AM eDAS observation
50 100 300 150 200 350 400 100 100 150 200 250 300 50 50 100 100 100 50 50 100 100 150 150 200 200 150 100 150 200 200 300 350 350 350 50 100 100 100 100 50 50 50
MM5-NOAH MM5- CPL AMeDAS observation (a) July 20 (b) July 22 34o 33o 32o 31o 34o 33o 32o 130o 131o 129o 132o129o 130o 131o 132o 130o 131o 129o 132o 31o
HESSD
5, 1067–1100, 2008 A coupled atmosphere and multi-layer land surface model M. Haggag et al. Title Page Abstract Introduction Conclusions References Tables Figures ◭ ◮ ◭ ◮ Back CloseFull Screen / Esc
Printer-friendly Version Interactive Discussion China in boundary (a) MM5-NOAH (b) MM5-CPL 115o 120o 125o 130o 135o 140o 145o 25o 30o 35o 40o 45o
China out of boundary
China in boundary China out of boundary
115o 120o 125o 130o 135o 140o 145o 125o 130o 135o 140o 145o 150o 155o 125o 130o 135o 140o 145o 150o 155o 200 400 600 800 1000 mm 200 400 600 800 1000mm 25o 30o 35o 40o 45o
Fig. 8. Total rainfall distribution (from JST 00:00, 20 July to 23:00, 25 July 2006) using different
computational domain geometry for the assessment of China land boundary effects on the rainfall simulation.
HESSD
5, 1067–1100, 2008 A coupled atmosphere and multi-layer land surface model M. Haggag et al. Title Page Abstract Introduction Conclusions References Tables Figures ◭ ◮ ◭ ◮ Back CloseFull Screen / Esc
Printer-friendly Version Interactive Discussion
2.5 m/sec
(a) July 20, 2006 (b) July 22, 2006
25o 30o 35o 40o 45o 130o 135o 140o 145o 125o 120o 120o 125o 130o 135o 140o 145o -1.0 -0.5 0.0 0.5 1.0hpa -1.0 -0.5 0.0 0.5 1.0hpa
Fig. 9. CPL-NOAH differences of the average daily surface wind vectors, and the average daily
HESSD
5, 1067–1100, 2008 A coupled atmosphere and multi-layer land surface model M. Haggag et al. Title Page Abstract Introduction Conclusions References Tables Figures ◭ ◮ ◭ ◮ Back CloseFull Screen / Esc
Printer-friendly Version Interactive Discussion (a) MM5 -CTRL ( b) MM5 -NOAH (c) MM5-CPL 25o 30o 35o 40o 45o 34o 32o 128o 130o 132o 134o 128o 130o 132o 134o 128o 130o 132o 134o 200 400 600 800 1000 1200 mm 200 400 600 800 1000 1200 mm 200 400 600 800 1000 1200 mm 30o 130o 135o 140o 145o 125o 120o 120o 125o 130o 135o 140o 145o 120o 125o 130o 135o 140o 145o
Fig. 10. Cumulative rainfall of 6 d (from JST 00:00, 20 July to 23:00, 25 July in 2006) in the