HAL Id: hal-00318835
https://hal.archives-ouvertes.fr/hal-00318835
Submitted on 1 Jan 2003
HAL is a multi-disciplinary open access
archive for the deposit and dissemination of
sci-entific research documents, whether they are
pub-lished or not. The documents may come from
teaching and research institutions in France or
abroad, or from public or private research centers.
L’archive ouverte pluridisciplinaire HAL, est
destinée au dépôt et à la diffusion de documents
scientifiques de niveau recherche, publiés ou non,
émanant des établissements d’enseignement et de
recherche français ou étrangers, des laboratoires
publics ou privés.
Magion 5 observations of chorus-like emissions and their
propagation features as inferred from ray-tracing
simulation
J. Chum, F. Ji?i?ek, J. Smilauer, D. Shklyar
To cite this version:
J. Chum, F. Ji?i?ek, J. Smilauer, D. Shklyar. Magion 5 observations of chorus-like emissions and
their propagation features as inferred from ray-tracing simulation. Annales Geophysicae, European
Geosciences Union, 2003, 21 (12), pp.2293-2302. �hal-00318835�
Annales Geophysicae (2003) 21: 2293–2302 c European Geosciences Union 2003
Annales
Geophysicae
Magion 5 observations of chorus-like emissions and their
propagation features as inferred from ray-tracing simulation
J. Chum1, F. Jiˇr´ıˇcek1, J. ˇSmilauer1, and D. Shklyar2
1Institute of Atmospheric Physics, Bocni II/1401, 14131 Praha 4, Czech Republic 2IZMIRAN, Troitsk, Moscow Region, 142190, Russia
Received: 13 December 2002 – Revised: 30 April 2003 – Accepted: 7 May 2003
Abstract. After reviewing briefly the present state of knowl-edge about chorus-like emissions, we present an overview of Magion 5 satellite observations of these emissions in the inner magnetosphere of the Earth. From the extensive VLF data recorded on board the Magion 5 satellite, we show ex-amples of different types of discrete elements, representing rising and falling tones, and discuss their spectral proper-ties, such as the bandwidth and the characteristic frequency as compared to the equatorial electron gyrofrequency. We analyse the possibility of satellite observation of discrete elements, assuming nonducted wave propagation from the source. As for the characteristic dimension of the generation region, we apply the figures obtained from the recently pub-lished correlation analysis of chorus emission recorded by four satellites in the Cluster experiment. We conclude that different frequencies in the chorus element should be emit-ted in a certain span of wave normal angles, so that the whole element could be observed far from the generation region. Key words. Magnetospheric physics (plasmasphere; plasma waves and instabilities) – Space plasma physics (wave-particle interactions) – Ionosphere (wave propagation)
1 Introduction
Chorus is an electromagnetic whistler mode emission that consists of narrow-band tones usually rising (sometimes falling) in frequency on the time scale of several tenths of a second (Sazhin and Hayakawa, 1992). These discrete el-ements repeat periodically or quasi-periodically, sometimes merging into noise. Observations show that chorus is mainly registered at ω/ωceq ∼ 0.2 − 0.5, where ωceq is the
equa-torial electron cyclotron frequency on the field line of obser-vation. Chorus emission is believed to be generated in the equatorial region in the inner magnetosphere. It is usually observed outside the plasmasphere, sometimes close to the plasmapause, from local midnight to local noon, with maxi-Correspondence to: J. Chum ([email protected])
mum activity in the morning hours. The reason why chorus is mainly observed in the dawn sector of the inner magneto-sphere is that the energetic electrons from more distant parts of the nightside magnetosphere are injected in this region (Bespalov and Trakhtengerts, 1986). Storey (1953) and Hel-liwell (1965, 1967, 1969) gave the first detailed description of chorus based on both ground observations and measure-ments from the first satellites. A review of chorus emission has been presented by Sazhin and Hayakawa (1992) where they discussed the region of generation, propagation char-acteristics, and the shape of elements of this emission. It is usually assumed that chorus is generated in the process of cy-clotron resonant interaction with magnetospherically trapped electrons in the energy range 5–100 keV. These emissions influence the dynamics of electron radiation belts, ring cur-rent and particle precipitations in the auroral region. Condi-tion for resonant interacCondi-tion between a particle and a wave is given by the following relation:
ω − kkvk=nωc/γ ; γ = (1 − v2/c2)−1/2. (1)
Here, ω is the wave frequency, kkis the wave vector
compo-nent along the ambient magnetic field, vkis the
correspond-ing component of particle velocity, ωc =eB/meis the
elec-tron cycloelec-tron frequency, γ is the relativistic factor (it is close to 1 for the particle energies mentioned above), and n is an in-teger. In the case of fundamental cyclotron resonance, n = 1, the whistler mode wave and resonant electrons move in op-posite directions with respect to the ambient magnetic field. For n = 0, which corresponds to the so-called Cerenkov, or Landau, resonance, vkand kkhave the same sign. Whether
the wave is amplified (gaining energy) or damped (loosing energy) during the resonant interaction depends on the parti-cle distribution function. In the case of unstable plasma, the parallel wave propagation is usually that of greatest instabil-ity, with the first cyclotron resonance being the only one in operation in this case. As the wave normal angle increases, other cyclotron resonances, and, most of all, the Landau res-onance, all come into play. Contributions of different reso-nances to the wave amplification may have different signs,
2294 J. Chum et al.: Magion 5 observations of chorus-like emissions
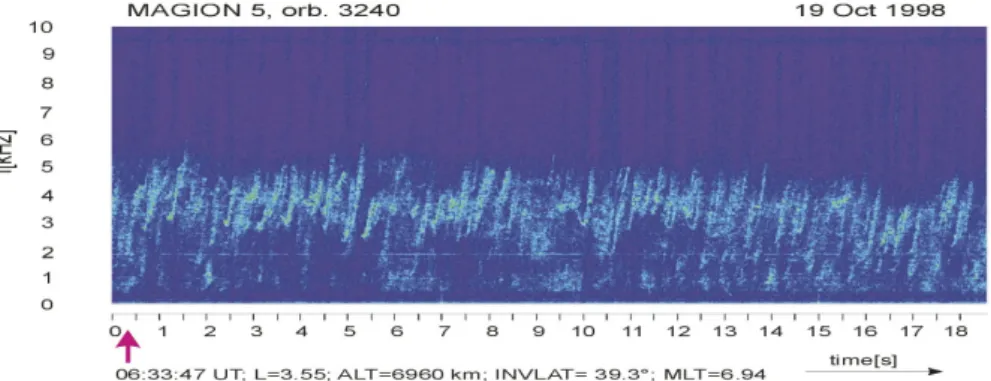
Fig. 1. Example of chorus observation on board Magion 5.
for example, the fundamental cyclotron resonance may con-tribute to the wave growth, while the Landau resonance may contribute to the wave damping. The net contribution of all resonances determines whether a plasma is unstable with re-spect to the given frequency and wave normal angle. It is im-portant to bear in mind that for non-relativistic electrons, the first cyclotron and Landau resonances play the most impor-tant role, as they correspond to the lowest particle energies that dominate in a majority of particle distributions.
Linear theory gives an idea of the unstable frequency band that may be excited in a plasma. However, it has a limited domain of applicability, as it does not take into account the back influence of the excited waves upon the particle dis-tribution function. Quasi-linear theory, which includes the latter effect, is the next approach in describing the dynam-ics of waves and particles in the case of a wide enough wave spectrum. Wave-particle interactions in the Earth’s magne-tosphere in the framework of quasi-linear theory have been extensively investigated by a number of authors (see, e.g. Andronov and Trakhtengerts, 1964; Kennel and Petschek, 1966; Lyons and Williams, 1975; Bespalov and Trakht-engerts, 1980, and references therein). Recently, Tsuratani and Lahkina (1997) presented a brief tutorial review of this subject. Although quasi-linear evolution of the particle dis-tribution function may play an important part in the process of further wave excitation, as suggested by Trakhtengerts (1995, 1999), it is generally agreed that the mechanism of chorus generation, in particular, the explanation of the quasi-periodic structure of chorus elements is beyond the scope of linear and quasi-linear theories.
Several authors attempted to explain the main properties of chorus emission, such as the recurrence rate and the slope of chorus elements. Trakhtengerts (1995, 1999) introduced a theory of the backward wave oscillator in ELF/VLF fre-quency band. According to this theory, a step-like electron distribution function, which is formed as a result of the devel-opment of cyclotron instability, leads to an absolute instabil-ity and the wave generation in the form of discrete elements with rising frequency. Nunn et al. (1997) considered a strong nonlinear phase trapping of cyclotron resonant electrons as the underlying mechanism behind VLF chorus.
Recent measurements of Poynting flux in chorus emis-sion performed on the Polar satellite (LeDocq et al., 1998) provided an experimental proof that chorus is generated in the region close to the magnetic equator, as had been sup-posed by early works (Helliwell, 1969). These measure-ments showed that the transition from northward to south-ward propagation at the magnetic equator is very abrupt, which implies a small size of the generation region, proba-bly not more than a few thousand kilometres in the north-south extent. The observations also did not show evidences of the chorus magnetospheric reflections that often occur for lightning-generated whistlers inside the plasmasphere. These findings were confirmed by the first results from Cluster wideband plasma wave measurements presented by Gurnett et al. (2001). In addition, the cross-correlation between spec-trograms recorded by different Cluster spacecraft showed that the transverse (with respect to geomagnetic field) dimen-sion of the excited wave packets near the generation region is rather small (about 100 km, Santolik and Gurnet, 2003). Thus, one can suppose that chorus elements are generated in region(s) having transverse dimensions of the order of sev-eral wavelengths.
Magion 5 acquired a lot of chorus and chorus-like emis-sions during its active period of measurements, from May 1998 to July 2001. We use the term “chorus-like” for emis-sions the detailed spectrograms of which contain discrete quasi-periodic elements resembling chorus, but whose mor-phological characteristics and frequency band may be differ-ent from that typical of the classical chorus. In the next sec-tion, we present a variety of chorus-like emissions registered on board the Magion 5 satellite.
2 Observation of chorus-like emission on board the Ma-gion 5 satellite
Because the VLF data acquisition from Magion 5 was pos-sible only in the cases of direct radio visibility, the registra-tion region was determined by the Magion 5 orbit (apogee 19 200 km, perigee 1200 km, inclination 63◦) and the lo-cation of Panska Ves telemetry station (latitude 50.53◦N, longitude 14.57◦E). There were basically two parts of the
J. Chum et al.: Magion 5 observations of chorus-like emissions 2295
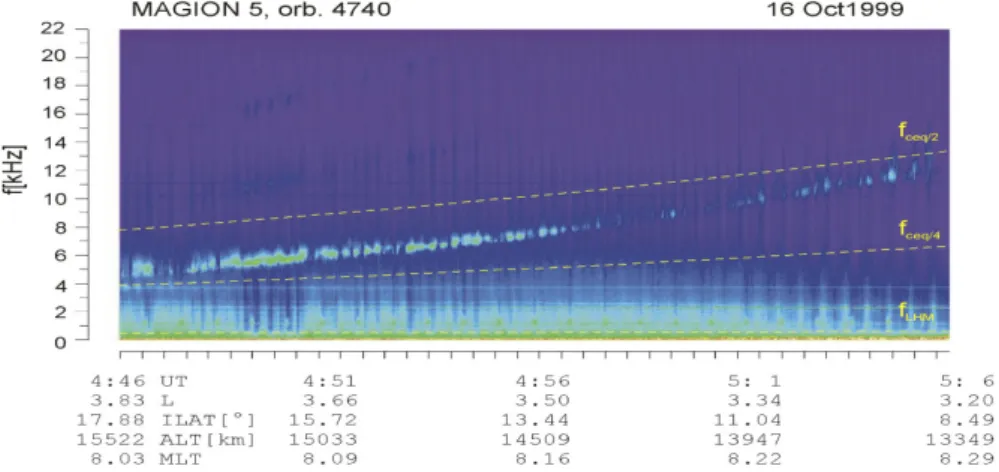
Fig. 2. Typical review spectrogram recorded on the descending part of the orbit of Magion 5, showing continuous evolution of the emission band along the satellite path. Here and further, the orbital data indicate the universal time (UT), McIlwain parameter (L), invariant latitude (ILAT), satellite altitude (ALT), and magnetic local time (MLT).
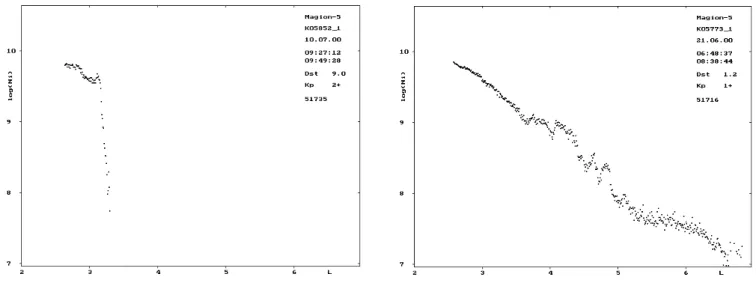
Fig. 3. Review spectrogram recorded on the descending part of the orbit number 5852. Patches of emission above fceq/2 and below fceq/2
are clearly seen.
orbit from which we had the VLF recordings: (a) the as-cending part, which includes altitudes ∼ 3000 − −8000 km and invariant latitudes ∼ 10◦–50◦, and (b) the descending
part, covering altitudes ∼15 000–10 000 km and invariant lat-itudes ∼ 30◦–0◦. Regular VLF recordings were made from
the end of May 1998 to the end of June 2001. Due to techni-cal problems, only electric component of the wave field was recorded, with the exception of a few orbits at the beginning of the mission. The data have been processed with a sam-pling frequency 44 100 Hz, thus allowing the analysis up to 22 kHz.
In what follows, the data are presented in the form of spec-trograms (frequency-time diagrams). The spectral amplitude is discerned by different colours. We use a rainbow colour map. The red colour indicates higher amplitudes, while the blue one stands for lower amplitudes. We should stress that only relative amplitudes are reproduced on the spectrograms below, the absolute values have not been determined due to technical reasons. The common colour bar shown in Fig. 3
represents relative values of the square root of the power spectral density, the absolute amplitudes shown by the same colour possibly being different on different spectrograms. A typical example of chorus-like emission observed on board Magion 5 is shown in Fig. 1. This detailed spectrogram rep-resents the dynamics of chorus emission on the time scale of
∼18 s.
Overview spectrograms represent another type of wave data presentation, showing the evolution of the VLF spec-trum in the frequency band 0–22 kHz on the time scale of
∼20 min. Figure 2 displays a typical overview spectrogram recorded on the descending part of the orbit number 4740.
The orbital data below the spectrogram indicate that the satellite approaches the equator, moving from L = 3.8 to
L = 3.2. The yellow dashed lines mark one-half (fceq/2)
and one-fourth (fceq/4) of equatorial electron cyclotron
fre-quency (fceq =ωceq/2π on the L-shell of satellite, and the
lower hybrid resonance frequency for electron-proton plasma calculated under assumption ω2p ω2c, where ωpis electron
2296 J. Chum et al.: Magion 5 observations of chorus-like emissions
5
number 4740. The orbital data below the spectrogram indicate that the satellite approaches the
equator, moving from L=3.8 to L=3.2. The yellow dashed lines mark one-half (f
ceq/2) and
one-fourth (f
ceq/4) of equatorial electron cyclotron frequency (f
ceq=
ω
ceq/2
π)
on the L-shell of
satellite, and the lower hybrid resonance frequency for electron – proton plasma calculated
under assumption ω
p2>>
ω
c2, where ω
pis electron plasma frequency. Apparently, as the
satellite moves towards the equator, the observed characteristic frequency
ω
changes in a way
that ω/ω
ceqtransforms from ~¼ to ~½. Thus, the characteristic frequency of the emission
increases with the decrease of L-shell and the corresponding increase of the equatorial
electron cyclotron frequency. In the case shown in Fig. 2, the characteristic frequency changes
from 5 kHz at L=3.8 and ILAT=17.9° to 10 kHz at L=3.25 and ILAT=10°. This is quite
typical spectrogram; similar ones are observed in most cases on the descending part of orbits.
The example above corresponds to the observation outside the plasmapause as will be
discussed in Section 3.
In some cases the spectrogram may have a particular character, namely, instead of
forming a continuous band on the spectrogram, the emission may form several “clusters”.
Example of such a spectrogram obtained on the orbit number 5852 is shown in Fig. 3. These
emissions were observed near the plasmapause, as can be seen from the simultaneous density
measurements presented in Fig. 4. One should bear in mind that the plasmapause does not
necessarily represent one distinct density drop, but may have a more complicated wavy
structure as shown in Fig. 5.
Fig. 4 Ion density along the orbit 5852
of Magion 5.
Fig. 5 Ion density along the orbit
5773 of Magion 5.
The high frequency emission on the spectrogram shown in Fig. 6 has most probably
been recorded just inside the plasmapause. This is evidenced by simultaneous registration of
the noise band with lower cut off at the LHR frequency, which is usually observed inside the
plasmasphere. Similarly to Fig. 2, the yellow line marked f
LHMindicates the LHR frequency
calculated for electron-proton plasma under assumption
ω
p>>
ω
c. Since this gives the
maximum possible value of LHR frequency, the observed LHR cut off is bellow this line.
Also, in the vicinity of a distinct, or a “wavy” plasmapause, one can expect quasi-ducted
propagation of the emission, at least in the equatorial region. The question about how far the
plasmapause, and the corresponding duct(s) spread towards the earth is not easy to answer. A
discussion of this problem based on simultaneous ground-based and satellite measurements
could be found in the paper by Jiříček et al. (1981).
Fig. 4. Ion density along the orbit 5852 of Magion 5.
plasma frequency. Apparently, as the satellite moves towards the equator, the observed characteristic frequency ω changes in such a way that ω/ωceq transforms from ∼ 14 to ∼ 12.
Thus, the characteristic frequency of the emission increases with the decrease in L-shell and the corresponding increase in the equatorial electron cyclotron frequency. In the case shown in Fig. 2, the characteristic frequency changes from 5 kHz at L = 3.8 and ILAT = 17.9◦to 10 kHz at L = 3.25 and ILAT = 10◦. This is quite a typical spectrogram;
simi-lar ones are observed in most cases on the descending part of orbits. The example above corresponds to the observation outside the plasmapause, as will be discussed in Sect. 3.
In some cases the spectrogram may have a particular char-acter, namely instead of forming a continuous band on the spectrogram, the emission may form several “clusters”. An example of such a spectrogram obtained on the orbit num-ber 5852 is shown in Fig. 3. These emissions were observed near the plasmapause, as can be seen from the simultaneous density measurements presented in Fig. 4. One should bear in mind that the plasmapause does not necessarily represent one distinct density drop, but may have a more complicated wavy structure, as shown in Fig. 5.
The high frequency emission on the spectrogram shown in Fig. 6 has most probably been recorded just inside the plasmapause. This is evidenced by simultaneous registra-tion of the noise band with a lower cutoff at the LHR fre-quency, which is usually observed inside the plasmasphere. Similar to Fig. 2, the yellow line marked fLHMindicates the
LHR frequency calculated for electron-proton plasma under the assumption ωp ωc. Since this gives the maximum
possible value of LHR frequency, the observed LHR cutoff is below this line. Also, in the vicinity of a distinct, or a “wavy” plasmapause, one can expect quasi-ducted propaga-tion of the emission, at least in the equatorial region. The question about how far the plasmapause, and the correspond-ing duct(s) spread towards the Earth is not easy to answer. A discussion of this problem based on simultaneous
ground-5
number 4740. The orbital data below the spectrogram indicate that the satellite approaches the
equator, moving from L=3.8 to L=3.2. The yellow dashed lines mark one-half (f
ceq/2) and
one-fourth (f
ceq/4) of equatorial electron cyclotron frequency (f
ceq=
ω
ceq/2
π)
on the L-shell of
satellite, and the lower hybrid resonance frequency for electron – proton plasma calculated
under assumption
ω
p2>>
ω
c2, where
ω
pis electron plasma frequency. Apparently, as the
satellite moves towards the equator, the observed characteristic frequency
ω
changes in a way
that
ω/ω
ceqtransforms from ~¼ to ~½. Thus, the characteristic frequency of the emission
increases with the decrease of L-shell and the corresponding increase of the equatorial
electron cyclotron frequency. In the case shown in Fig. 2, the characteristic frequency changes
from 5 kHz at L=3.8 and ILAT=17.9° to 10 kHz at L=3.25 and ILAT=10°. This is quite
typical spectrogram; similar ones are observed in most cases on the descending part of orbits.
The example above corresponds to the observation outside the plasmapause as will be
discussed in Section 3.
In some cases the spectrogram may have a particular character, namely, instead of
forming a continuous band on the spectrogram, the emission may form several “clusters”.
Example of such a spectrogram obtained on the orbit number 5852 is shown in Fig. 3. These
emissions were observed near the plasmapause, as can be seen from the simultaneous density
measurements presented in Fig. 4. One should bear in mind that the plasmapause does not
necessarily represent one distinct density drop, but may have a more complicated wavy
structure as shown in Fig. 5.
Fig. 4 Ion density along the orbit 5852
of Magion 5.
Fig. 5 Ion density along the orbit
5773 of Magion 5.
The high frequency emission on the spectrogram shown in Fig. 6 has most probably
been recorded just inside the plasmapause. This is evidenced by simultaneous registration of
the noise band with lower cut off at the LHR frequency, which is usually observed inside the
plasmasphere. Similarly to Fig. 2, the yellow line marked f
LHMindicates the LHR frequency
calculated for electron-proton plasma under assumption
ω
p>>
ω
c. Since this gives the
maximum possible value of LHR frequency, the observed LHR cut off is bellow this line.
Also, in the vicinity of a distinct, or a “wavy” plasmapause, one can expect quasi-ducted
propagation of the emission, at least in the equatorial region. The question about how far the
plasmapause, and the corresponding duct(s) spread towards the earth is not easy to answer. A
discussion of this problem based on simultaneous ground-based and satellite measurements
could be found in the paper by Jiříček et al. (1981).
Fig. 5. Ion density along the orbit 5773 of Magion 5.
based and satellite measurements can be found in the paper by Jiˇr´ıˇcek et al. (1981).
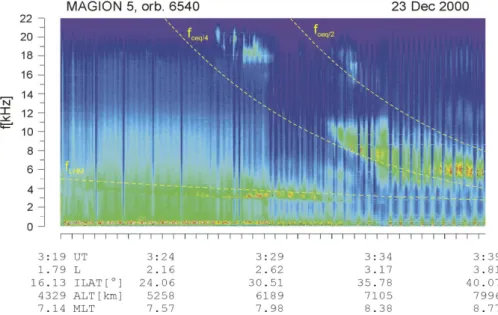
Figure 6, which corresponds to orbit number 6540, gives an example of how the records look from the ascending part of orbits. In the main, the spectrum of the emission fits again between ωceq/4 and ωceq/2. It should be noted that emissions
may be found in different frequency bands simultaneously. Another point which is worth mentioning is that the charac-teristic frequency of the emission does not change much at large L-shells, for instance, at L > 3.5 in the case under dis-cussion. Yet another interesting feature of the spectrogram observed on this orbit is that the emission is registered at un-usually high frequencies, up to ∼ 20 kHz.
We now turn to the discussion of detailed spectrograms and the characteristics of discrete elements that form the emission, proceeding with the orbit number 6540. Figure 7 shows the relatively rare observation of ∼20 kHz emission in two different time intervals. Despite the fact that the el-ements are not very distinct and are partly mixed with the noise, we easily recognize the transition from falling tones (upper panel) to more common rising tones (bottom panel). This phenomenon has also been observed on several other or-bits. For example, on orbit number 4724 (Fig. 8), the change in the spectrum from falling tones to rising tones is accom-panied by the variation of emission central frequency (see Fig. 8), which was not the case on orbit number 6540. (The gap in the middle of this spectrogram is due to technical rea-sons.) We should mention that falling tones, which we ob-served when the satellite moved over low invariant latitudes have never been found at higher latitudes. It is necessary to bear in mind that L-values always decrease with decreas-ing latitude along Magion 5 orbits. The slope and the rep-etition rate of chorus-like emission elements are important characteristics of the phenomena under discussion. Both the generation mechanism and propagation effects should play a part in the formation and evolution of the slope of chorus elements. However, this question, as well as the problem of
J. Chum et al.: Magion 5 observations of chorus-like emissions 2297
Fig. 6. Review spectrogram recorded on the ascending part of Magion 5 orbit number 6540. The emissions at frequencies as high as
∼20 kHz seen in this figure have been rarely observed.
Fig. 7. Detailed spectrograms reproducing two 18-s intervals from the spectrogram shown in Fig. 6. High frequency (∼ 20 kHz) falling tones change to rising tones as the satellite moves towards higher L-shells.
element recurrence, is out of the frame of the present study. Interested readers are referred to recent papers by Trakht-engerts (1995, 1999) and Nunn et al. (1997), which represent the current state of the investigation into this problem.
Figure 9, which presents the recording from orbit num-ber 6954, illustrates that a detailed spectrogram may con-tain spot-like elements. Other records show that discrete ele-ments may appear above (Fig. 10) or below (Fig. 11) a noise band.
3 Propagation of chorus-like emission and conditions for its observation
Let us discuss what can be inferred from the ray tracing regarding chorus-like emission. In the case of nonducted, oblique propagation, the waves with different frequencies propagate along different trajectories, even if they have the same initial wave normal angles (see Fig. 15). So, for the whole chorus element to be observed on a satellite located
2298 J. Chum et al.: Magion 5 observations of chorus-like emissions
Figs. 8, 9, 10, 11. (from top to bottom). Various detailed spectrograms showing different types of chorus-like elements against a background of various VLF emissions (see the text for details).
far enough from the source, either the source region should be wide enough, or each frequency should be emitted with various initial wave normal vectors, or both. In order to de-cide between these variants, we turn to the first results from the Cluster wide-band plasma wave investigations (Gurnett et al., 2001; Santolik and Gurnett, 2003). The correlation analysis of chorus spectrograms recorded on four Cluster satellites in the equatorial region at L∼3.8 has shown that a typical dimension of the chorus source region, over which the chorus elements are significantly correlated, is ∼ 100 km
across the field line. These figures are close to the theoretical estimations by Trakhtengerts (1999). Although the results mentioned above were obtained when the Cluster satellites crossed the equator at higher altitudes than Magion 5, we will take the figures given above as a rough estimate of the dimension of emission source in the equatorial region.
Let us analyse in more detail a typical case of emission observed by Magion 5 on the orbit number 4740 (see Fig. 2). For this orbit, we also have the measurement of ion density (number of ions per cubic meter) shown as a common
loga-J. Chum et al.: Magion 5 observations of chorus-like emissions 2299
10
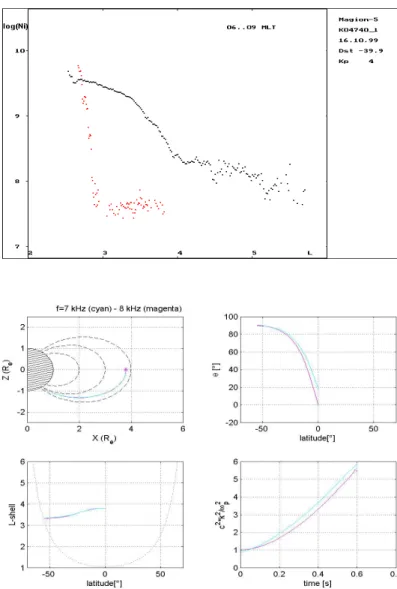
Fig. 12 The common logarithm of ion density as a function of L-shell on Magion 5 orbit
number 4740. The red dots present the ion density on this orbit. The black ones show how the ion density profile looks like under the quiet geomagnetic conditions.
Fig. 13 Top and bottom left panels show the wave trajectories in Cartesian and in the
(latitude, L-shell)-coordinates, respectively. The dotted line on the bottom left panel indicates the altitude of 300 km above the Earth’s surface. Top right panel shows the evolution of the wave normal angle θ as a function of latitude, while the bottom right panel gives the parameter k2c2/ω
p2 as a function of time along the wave trajectory. The value of this
parameter characterises the propagation regime: k2c2/ω
p2 ≤ 1 corresponds to
quasi-longitudinal mode of propagation, while k2c2/ω
p2 >>1 indicates the quasi-resonance mode.
Fig. 12. The common logarithm of ion density as a function of L-shell on Ma-gion 5 orbit number 4740. The red dots present the ion density on this orbit. The black ones show how the ion den-sity profile looks under quiet geomag-netic conditions.
10
Fig. 12 The common logarithm of ion density as a function of L-shell on Magion 5 orbit
number 4740. The red dots present the ion density on this orbit. The black ones show how the ion density profile looks like under the quiet geomagnetic conditions.
Fig. 13 Top and bottom left panels show the wave trajectories in Cartesian and in the
(latitude, L-shell)-coordinates, respectively. The dotted line on the bottom left panel indicates the altitude of 300 km above the Earth’s surface. Top right panel shows the evolution of the wave normal angle θ as a function of latitude, while the bottom right panel gives the parameter k2c2/ω
p2 as a function of time along the wave trajectory. The value of this
parameter characterises the propagation regime: k2c2/ω
p2 ≤ 1 corresponds to
quasi-longitudinal mode of propagation, while k2c2/ω
p2 >>1 indicates the quasi-resonance mode.
Fig. 13. Top and bottom left panels show the wave trajectories in Carte-sian and in the (latitude, L-shell)-coordinates, respectively. The dotted line on the bottom left panel indicates the altitude of 300 km above the Earth’s surface. Top right panel shows the evo-lution of the wave normal angle θ as a function of latitude, while the bot-tom right panel gives the parameter
k2c2/ω2p as a function of time along the wave trajectory. The value of this parameter characterises the propagation regime: k2c2/ωp2 ≤ 1 corresponds to quasi-longitudinal mode of propaga-tion, while k2c2/ω2p 1 indicates the quasi-resonance mode.
rithm in Fig. 12. Comparing the L-shell on which the spec-trogram in Fig. 2 has been taken, with the ion density profile as a function of L on this orbit, we observe that the recording has been taken outside a very distinct plasmapause situated at L ≈ 2.8. As there is no evidence of a duct in that region (in the sense of a density enhancement around a field line), the consideration in the framework of nonducted propagation seems quite plausible. Note that the L-shell decreases with time along the displayed part of satellite orbit number 4740, while the plasma density is plotted as a function of “increas-ing” L-shell, and that the interval of plasma density measure-ment covers the time interval displayed on the spectrogram.
As was mentioned above, in order to observe the whole frequency band of chorus-like emission on a satellite out-side the source region of a small size, the wave should be generated in a finite band of wave normal angles. To esti-mate the necessary wave normal angle span, we perform the ray-tracing simulations, assuming the frequency band of the emission to cover the interval from 7 to 8 kHz, which cor-responds to the case shown in Fig. 2. We take two utmost frequencies in the band, and for both waves, we start the
sim-ulation at the equator on L = 3.79, which corresponds to the equatorial electron cyclotron frequency ωceq =16 kHz, i.e.
twice the upper frequency in the considered band. If we take the initial wave normal angle θ = 0◦ for 8 kHz wave, and
θ =18◦for 7 kHz wave, we find that on the first half-hop the trajectories are very close. This case is illustrated in Fig. 13. The trajectory for the 7 kHz wave is shown in cyan, while the 8 kHz trajectory in shown in magenta. Being guided by this example, we can suppose that if the frequency band 7– 8 kHz is generated in a small region at the equator, then the whole band can be observed at high latitudes, provided that the initial wave normal angle span is |1θ | ∼ 18◦.
The example shown in Fig. 13 corresponds to ω/ωceq∼12.
This case is, in a sense, special for whistler mode waves, as the contour plot ω = constant on (k⊥, kk)-plane, the normal
to which gives the direction of the group velocity, changes its character at this frequency (see, e.g. Sazhin, 1982). In par-ticular, the wave normal angle θ = 0◦for the 8 kHz wave is simultaneously equal to the Gendrin angle (see below). To understand the general case, we recall some well-known facts concerning the direction of the group velocity for whistler
2300 J. Chum et al.: Magion 5 observations of chorus-like emissions
11
when having the initial wave normal angles equal to 18o and 0o, respectively, as in the
example above, but also for other pairs of wave normal angles, including negative ones, for which the wave normal vector is directed towards lower L-shells. For instance, θ0 may be
equal to -18o and -30o respectively for 7 and 8 kHz waves.
For waves generated well below ωc/2, it is more difficult to merge the ray trajectories
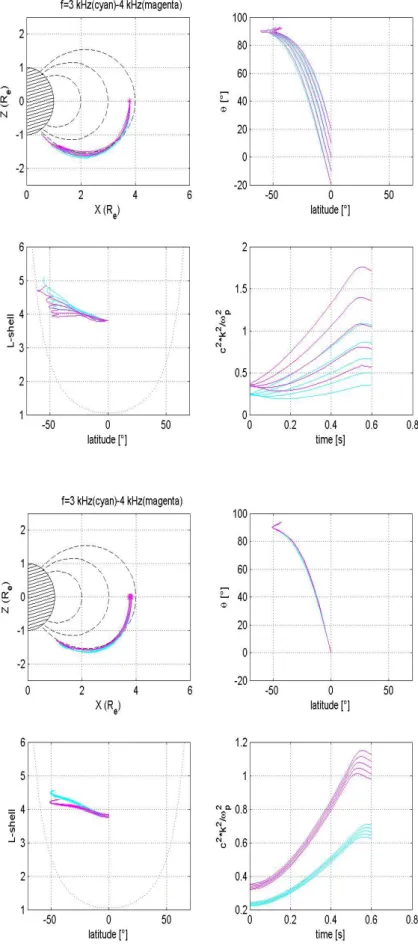
for different frequencies by an appropriate choice of initial wave normal angles, when all waves start from one point at the equator. However, if we launch all frequencies from one point, but in a certain span of wave normal angles, then the whole frequency band may be observed far enough from the source when a satellite moves in the region of overlapping trajectories (Fig. 14).
Fig. 14 Ray tracing calculations for 3 and 4 kHz waves. All waves start at the equator on L
= 3.79, which corresponds to fceq/4 for 4 kHz waves. For both frequencies, the initial wave
normal angles are taken in the span from -20o to 20o (see the top right panel). The
parameters shown on the panels are the same as in Fig. 13.
Fig. 14. Ray-tracing calculations for 3 and 4 kHz waves. All waves start at the equator on L = 3.79, which corre-sponds to fceq/4 for 4 kHz waves. For
both frequencies, the initial wave nor-mal angles are taken in the span from
−20◦to 20◦(see the top right panel). The parameters shown on the panels are the same as in Fig. 13.
12
As was mentioned above, another possibility to make the whole spectrum observable on a satellite at high latitudes could be to launch waves along the field line, but from different L-shells at the equator. This situation would correspond to the case when the wave growth rate has a sharp maximum at θ = 0. However, even if we launch different frequency waves in
a larger L-shells span than the transverse dimension of chorus source observed by CLUSTER, there will be no region at higher latitudes where the whole frequency band of chorus could be observed (see Fig. 15). Thus, we conclude that chorus source has to emit in a sufficiently wide interval of wave-normal directions.
Fig. 15 Ray tracing calculations for 3 and 4 kHz waves with different initial conditions as
compared to Fig. 14. All waves start at the equator with the initial wave normal vector along the magnetic field (θ = 0o), in the span of altitudes ± 300 km centred on L = 3.79.
Fig. 15. Ray tracing calculations for 3 and 4 kHz waves with different initial conditions as compared to Fig. 14. All waves start at the equator with the initial wave normal vector along the magnetic field (θ = 0◦), in the span of altitudes
J. Chum et al.: Magion 5 observations of chorus-like emissions 2301 mode waves (see, for instance, Stix, 1962). The
longitudi-nal group velocity, vgk, i.e. the projection of the group
ve-locity on the magnetic field line, has always the same sign as the parallel wave normal vector kk. As for the sign of
the transversal group velocity vg⊥, it depends on the sign of
k⊥, as well as on the wave frequency and wave normal
an-gle. In fact, far from the LHR frequency, the sign of vg⊥
is determined by the sign of the quantity (2ω − ωccos θ ).
For the so-called Gendrin angle (Gendrin, 1961), i.e. for cos θ = 2ω/ωc, which exists only if ω < ωc/2, of course,
the transversal group velocity vg⊥ is equal to zero, and the
wave propagates along the ambient magnetic field, as in the case θ = 0. For (2ω − ωccos θ ) < 0, the
transver-sal group velocity vg⊥ has the same sign as k⊥, while for
(2ω − ωccos θ ) > 0, vg⊥ and k⊥have opposite signs, i.e.
the wave moves towards lower L-shells if the wave vector is directed towards larger L-shells, and vice versa. In particu-lar, the last situation takes place for quasi-resonance waves when ω ≈ ωccos θ . The wave generation and propagation in
a quasi-resonance regime has been studied, for example, by Alekhin and Shklyar (1980) and Boˇskov´a et al. (1988, 1990). The properties of the wave group velocity mentioned above help to understand the results of computer simulations dis-cussed further. In the case of wave generation with ω close to
ωc/2, the trajectories 7 kHz and 8 kHz will merge far enough
from the equator not only when the initial wave normal an-gles equal 18◦and 0◦, respectively, as in the example above, but also for other pairs of wave normal angles, including neg-ative ones, for which the wave normal vector is directed to-wards lower L-shells. For instance, θ0may be equal to −18◦
and −30◦, respectively, for 7 and 8 kHz waves.
For waves generated well below ωc/2, it is more difficult
to merge the ray trajectories for different frequencies by an appropriate choice of initial wave normal angles, when all waves start from one point at the equator. However, if we launch all frequencies from one point, but in a certain span of wave normal angles, then the whole frequency band may be observed far enough from the source when a satellite moves in the region of overlapping trajectories (Fig. 14).
As was mentioned above, another possibility to make the whole spectrum observable on a satellite at high latitudes could be to launch waves along the field line, but from differ-ent L-shells at the equator. This situation would correspond to the case when the wave growth rate has a sharp maximum at θ = 0. However, even if we launch different frequency waves in a larger L-shells span than the transverse dimension of chorus source observed by Cluster, there will be no region at higher latitudes where the whole frequency band of cho-rus could be observed (see Fig. 15). Thus, we conclude that chorus source has to emit in a sufficiently wide interval of wave-normal directions.
To summarize the previous discussion we can say that the most favourable conditions for the whole spectrum to be ob-served on a satellite far from the equator seem to comply with the situation when the waves are generated in a small region at the equator within a certain span of wave normal angles, on the L-shell, where ωc∼2ω, with ω being a
typi-cal frequency in the generated band. The spread of the wave normal angles of the order of 20◦is necessary if the chorus
is emitted at frequencies below ωc/2. Such a spread is
con-sistent with Geotail observations (Nagano et al., 1996). In a sense, the distribution of the wave normal angles controls the bandwidth of the emission observed at higher latitudes on a satellite.
4 Conclusions
We have presented a variety of spectrograms recorded on the Magion 5 satellite, illustrating different features of chorus-like emissions, and discussed them in the light of recent findings from other satellites like Polar, Cluster and Geotail. A typical frequency band of the discussed emission spans from ωceq/4 to ωceq/2. At the equator, the characteristic
fre-quency of the emission is closer to ωceq/2, while at higher
latitudes it is closer to ωceq/4. We have focused on the
non-ducted propagation of chorus-like emission, and the possibil-ity of observing the whole excited band at higher latitudes, assuming a small transverse dimension of a generation re-gion located near the equator outside the plasmapause, and wave propagation in quasi-longitudinal regime.
Our main conclusion is that, in the case of nonducted prop-agation of the emission from the source, different frequencies in the chorus element should be emitted in a certain span of wave normal angles, so that the whole element could be ob-served far from the generation region. This conclusion con-cerns the small-size generation region located in the equa-torial plane that is consistent with Cluster observations. A typical spread of the wave normal angles around longitudi-nal direction found by Geotail is about 20◦. For a smaller spread of the wave normal angles in the generation region, only part of the frequency band of chorus emission can be observed on the records taken far enough from the source.
Acknowledgements. We wish to thank O. Santol´ik for valuable
dis-cussions. This study was supported by grant No A3042201 of the Grant Agency of the Academy of Sciences of the Czech Repub-lic, including financing the visits of D.R.S. to Upper Atmosphere Department of the Institute of Atmospheric Physics in Prague that is greatly appreciated. A support of D.R.S. by RFBR under grant No.03-05-64345 is also acknowledged.
Topical Editor T. Pulkkinen thanks two referees for their help in evaluating this paper.
References
Alekhin, Ju. K. and Shklyar, D. R.: Some questions of electro-magnetic wave propagation in magnetosphere, Geomagnetism i Aeronomia, 20, 501–507, 1980.
Andronov, A. A. and Trakhtengerts, V. Yu.: Kinetic instability of the Earth’s outer radiation belt, Geomagnetism and Aeronomy, 4, 233–242, 1964.
Bespalov, P. A. and Trakhtengerts, V. Yu.: Cyclotron instability of the Earth’s radiation belts. Reviews on Plasma Physics, edited by Mikhailovskii, A. M., Atomizdat, 10, 88–163, 1980.
2302 J. Chum et al.: Magion 5 observations of chorus-like emissions
Bespalov, P. A. and Trakhtengerts, V. Yu.: Alfven Masers. Preprint of the Institute of Applied Physics, Academy of Sciences of the USSR, 1986.
Boˇskov´a, J., Jiˇr´ıˇcek, F., Lundin, B. V., Shklyar, D. R., and Tr´iska, P.: On the problem of quasi-electrostatic whistler-mode waves: a possible interpretation of discrete plasmaspheric emissions, Stu-dia geoph. et geod., 32, 199–212, 1988.
Boˇskov´a, J., Jiˇr´ıˇcek, F., Lundin, B. V., Shklyar, D. R., and Tr´iska, P.: A possible common nature of equatorial half-gyrofrequency VLF emissions and discrete plasmaspheric emissions, Ann. Geo-physicae, 8, 755–764, 1990.
Gendrin, R.: Le guidage des whistlers par le champ megnetique, Planet. Space Sci., 5, 274–282, 1961.
Gurnett, D. A., Huff, R. L., Pickett, J. S., Persoon, A. M., Mutel, R. L., Christopher, I. W., Kletzing, C. A., Inan, U. S., Martin, W. M., Bougeret, J., Alleyne, H. St. C., and Yearby, K. H.: First re-sults from the Cluster wideband plasma wave investigation, Ann. Geophysicae, 19, 1259–1271, 2001.
Helliwell, R. A.: Whistlers and Related Ionospheric Phenomena, Stanford University Press, 1965.
Helliwell, R. A.: A theory of discrete emissions from the magneto-sphere, J. Geophys. Res., 72, 4773–4790, 1967.
Helliwell, R. A.: Low-frequency waves in the magnetosphere, Rev. Geophys., 7, 281–303, 1969.
Jiˇr´ıˇcek, F., Tr´iska, P., Jurov, V. E., and Titova , E. E.: On the char-acteristics of the VLF emissions in the upper ionosphere and on the ground, Studia geoph. et geod., 25, 81–86, 1981.
Kennel, C. F. and Petschek, H. E.: Limit on stably trapped particle fluxes, J. Geophys. Res., 71, 1–28, 1966.
LeDocq, M. J., Gurnett, D. A., and Hospodarsky, G. B.: Chorus source locations from VLF Poynting flux measurements with the Polar spacecraft, Geophys. Res. Lett., 25, 4063–4066, 1998.
Lyons, L. R. and Williams, D. J.: The storm and poststorm evolution of energetic (35–560 keV) radiation belt electron distribution, J. Geophys. Res., 80, 3985–3994, 1975.
Nagano, I., Yagitani, S., Kojima, H., and Matsumoto, H.: Analysis of Wave Normal and Poynting vectors of Chorus emissions Ob-served by GEOTAIL, J. Geomag. Geoelectr., 48, 299–307, 1996. Nunn, D., Omura, Y., Matsumoto, H., Nagano, I., and Yagitani, S.: The numerical simulation of VLF chorus and discrete emissions observed on Geotail satellite using a Vlasov code, J. Geophys. Res., 102, 27 083–27 097, 1997.
Santol´ik, O. and Gurnett, D. A.: Transverse dimensions of cho-rus in the source region, Geophys. Res. Lett., 30, 2, 1031, doi:10.1029/2002GL016178, 2003.
Sazhin, S. S.: Natural radio emissions in the Earth’s magnetosphere, Nauka, Moscow, (in Russian), 1982.
Sazhin, S. S. and Hayakawa, M.: Magnetospheric chorus emissions: A review, Plannet. Space Sci. 40, 681–697, 1992.
Shklyar, D. R. and Jiˇr´ıˇcek, F.: Simulation of nonducted whistler spectrograms observed aboard the Magion 4 and 5 satellites, J. Atmos. and Solar-Terr. Phys., 62, 347–370, 2000.
Stix, T. H.: Theory of Plasma Waves, Mc Graw-Hill Book Comp., 1962.
Storey, L. R. O.: An investigation of whistling atmospherics, Phil. Trans. Roy. Soc. London, 246, 113–141, 1953.
Thrakhtengerts, V. Y.: Magnetosphere cyclotron maser: back-ward wave oscillator generation regime, J. Geophys. Res., 100, 17 205–17 210, 1995.
Thrakhtengerts, V. Y.: A generation mechanism for chorus emis-sion, Ann. Geophysicae, 17, 95–100, 1999.
Tsuratani, B. T. and Lahkina, G. S.: Some basic concepts of wave-particle interactions in collisionless plasmas, Revs. Geophysics, 35, 491–501, 1997.