Appropriation of decision support tools derived results in the
public-private management of an irrigation scheme in Burkina Faso.
WELLENS Joost1, DIALLO Mamadou2, NITCHEU Martial3, TRAORE Farid4, MIDEKOR Akoly3, SAWADOGO Brehima2, TYCHON Bernard4
1
Regional Board of Hydraulics and Agriculture of the Upper-Basins (DRAHRH-HB), 01 P.O.-Box 3526 Bobo-Dioulasso, Burkina Faso;
2 Association for Water, Development and Environment (AEDE),
P.O. Box 179 Bobo-Dioulasso, Burkina Faso;
3
Water Observatory of the South-western Watersheds (OE), P.O. Box 179 Bobo-Dioulasso, Burkina Faso;
4 University of Liege, Faculty of Sciences, Department of Environmental Sciences and Management,
185 Avenue de Longwy, 6700 Arlon, Belgium.
Summary
Dating back to the late 1960s, a 1.200 ha state run irrigated rice scheme, called the ‘Kou Valley’, has been established in the South-western part of Burkina Faso. Aware of their lack of management skills the responsible Water Users Association solicited external assistance in the form of a Public-Private Partnership (PPP). This paper relates the successful installation of this PPP, and assesses the perimeters state before and during the management intervention.
Keywords : public-private partnership, irrigation, decision support, water management. 1. Introduction
In the framework of a national food sufficiency policy dating back to the late 1960s, a 1.200 ha state run irrigated rice scheme, called the ‘Kou Valley’, has been established in the South-western part of Burkina Faso. Long-time jointly run by state officials and a series of international development agencies, all aid abruptly ended in 1993. To reduce public expenditure, World Banks and IMFs structural adjustment programmes (SAP) forced an Irrigation Management Transfer (IMT) from state operators to a hastily assembled Water Users Association (WUA).
Abandoned, merely prepared and a top-down non-stakeholders initiative, the WUA was doomed to a certain failure (Subramanian et al., 1997; Meinzen Dick et al., 2002; Nkhoma et al., 2004). Maintenance works declined, yields started dropping and the available water no longer seemed to satisfy the schemes water needs resulting in the desertion of a quarter of the parcels.
Discomforted by the sickening state of the perimeters water management and aware of their own lack of management skills, the WUA finally turned towards a private and external operator (AEDE) for support. Inspired by a similar experience in the rural water and sanitation sector (Valfrey and Diallo, 2004), the AEDE initiated a panoply of actions.
An irrigation counsellor was installed on the scheme. His presence helped the farmers regain confidence in a positive outcome and resulted in a more technical inventory of the perimeters problem based on farmer testimonies and proper findings. Later on, more technical studies were carried out in order to quantify the water problems and to propose sustainable solutions: mapping and databasing the perimeter, proposing more efficient land use, evaluating the water distribution through a set of efficiency parameters and adapting FAO’s SIMIS software tool (Mateos et al., 2002) for designing more efficient and equitable water distribution.
This paper presents the different stages of the successful participatory setup of a Public-Private Partnership (PPP) (World Bank, 2007) and its resulting improvement in the schemes water management. Starting with a diagnosis of the ex-ante irrigation practices and efficiencies; followed by the installation of decisions support tools to improve land use and water distribution, accompanied by the necessary participatory meetings; and finally an assessment of the ex-post situation and the repositioned role of the different stakeholders.
2. Materials and methods
2.1. Description of the study area
The region of the Kou Valley (11°23’N; 4°25’W) is characterised as sub-humid. Yearly rainfall varies from 600 to 1.200 mm and is concentrated in the months from June to October. Reference evapotranspiration amounts to 1.700 mm a year and varies from a mildly 4 mm/day (August – December) to a scorching 7 mm/day in March. Soils are ranged in the following groups: clay, loam, clay loam, sandy clay loam, sandy clay and sandy loam (‘Projet Vallée du Kou’ (1986), cited by Wellens et al., 2007). Paddy ice is the principal crop, followed by maize. The plain knows two distinct growing seasons: the rainfed or humid period from July to October and the irrigated or dry season from January to June. Since no water shortages are to be reported during the rainy season, the study focuses on the irrigated season.
The irrigation scheme takes its water from an upstream headwork. During the dry season, the complete river is diverted towards the perimeter. From the headwork, water is gravitationally conveyed in a 11 km long lined canal to the scheme; 3,5 m3/s in rainy season and an average 1,4 m3/s during dry season. From there on, a hierarchical canal system allocates the water over the 1.200 ha. A primary canal encircles the plain and redistributes the water amongst 8 secondary canals followed by more tertiary canals. Irrigation is semi-rotational and the average field size is 1 hectare.
Due to a vast increase in upstream water-users, low irrigation efficiencies on the scheme and lack of respect between the schemes upstream and downstream users, most farmers find themselves regularly faced to water shortages leading to the abandonment of almost a quarter of the fields and drops in yield (IWACO-BERA, 1988; IWACO/BURGEAP, 1998; Wellens et al., 2007, 2009).
2.2. Performance indicators
Amongst the comparative indicators for the assessment of the performance of WUAs and overall irrigation system performance presented by IWMI (listed in Uysal and Atiş, 2010), the ones proposed by Molden and Gates (1990) are widely used (Jahromi and Feyen, 2001; Unal et al., 2004; Vandersypen et al., 2006). Performance will hence be evaluated using their indicators of adequacy (PA), efficiency (PE), dependability (PD) and equity (PE):
∑
∑
= T R A A p R T p 1 1 , with R D A Q Q p = , if QD ≤QR and pA =1otherwise∑
∑
= T R P F p R T p 1 1 , with D R Q Q pF = , if QR ≤QD and pF =1otherwise∑
= QD CV p 1∑
= T R D R E Q Q CV T p 1The indicators compare de the volume of water required (QR) with the water delivered (QD) of a certain subregion (R, the sampled tertiary and secondary blocks) during a certain period (T, the period of February - April). CV is the coefficient of variation. The indicators are defined as follows (Molden and Gates, 1990), “the objective of (i) adequacy states the desire to deliver the required amount of water over the command area served by the system; the objective of water delivery (ii) efficiency embodies the desire to conserve water by matching water deliveries with water requirements; an indicator of the degree of (iii) dependability of water delivery is the degree of temporal variability in the ratio of amount required that occurs over a region; and (iv) if equity is interpreted as spatial uniformity of the relative amount of water delivered, then an appropriate measure of performance relative to equity would be the average spatial variability of the ratio of the amount delivered to the amount required over the time period of interest.” Since dependability and equity are expressed by a coefficient of variation (CV), the lower the value, the higher the dependability and equity.
A physical performance indicator is proposed by Vermillion (2000). With irrigated land referring to the portion of the actually irrigated land in any given irrigation season and irrigable land to the area of potential scheme command area, the rate of irrigation (RI) is:
RI = irrigated land / irrigable land
All these indicators will be calculated for the period before the PPP (2006) and compared with those under PPP management (2009 and 2010).
2.3. Decision support system
The analysis of the perimeters land occupations and performance indicators (see further) clearly demonstrated the need for a decision support tool for the elaboration of a more equitable water distribution. Many models for supporting decisions on water management have been published recently and are listed by Lozano and Mateos (2008). They showed SIMIS to be a useful tool for assisting the management of irrigation schemes; especially for periods with peak water demands when fixed rotation is desired to enhance equity, albeit the fact that water use may be deficient. SIMIS is the FAO decision support system for irrigation scheme management (FAO, 2001; Mateos et al., 2002).
In short, “the water management module in SIMIS deals with four aspects: crop water requirements, seasonal irrigation planning, water delivery scheduling, and recording water consumption. The crop water requirements sub-module follows the FAO approach (Doorembos and Pruitt, 1977; Smith, 1992). It calculates optimal irrigation schedules for all possible crop-planting date combinations and daily crop water requirements for individual crops, plots or network branches. In the irrigation sub-module, the net irrigation requirements throughout the season can be calculated for different cropping patterns with staggered planting dates and, once the distribution efficiencies are accounted for, the results can be compared with the system’s capacity and the water allocation. The water delivery scheduling sub-module can handle three
main water delivery modes: fixed rotation, semi-demand and proportional supply” (Lozano and Mateos, 2008).
For the case of the ‘Kou Valley’, coupled to external GIS and worksheet software, SIMIS was used to elaborate irrigation plans maximising the occupied land and aiming an equitable water distribution amongst the different blocks. In a later stage (out of the scope of this study), irrigation calendars and water distribution up to the parcel level have also been studied using SIMIS (Wellens et al, 2009).
2.4. Collective decision-making
New management scheme combine the technological dimension with the social dimension, based on stakeholders involvement. Decision support tools are becoming the shared platform through which the debate is organised and the different sources of knowledge are integrated (Giordano et al., 2007). There is the hope that participating in decision making will lead people to accept and support those decisions (Raiffa et al., 2002). Moreover, if the stakeholders are not involved, then the decision process outcome could be controversial and the solutions proposed could generate strong opposition, making those solutions unfeasible (Kersten and Concilio, 2002).
A significant correlation exists between problem perception and farmer participation in irrigation management (Khalkheili and Zamani, 2009). Farmers who perceived problems participated more in irrigation management. The same study further stated a significant relationship between farmer participation in irrigation management and the level of trust among farmers participating in irrigation schemes.
Becu et al. (2008) found that stakeholders do not necessary have difficulties understanding a computer model or any other decision support tool. They positively explored the potential of a participatory modelling approach in which stakeholders are directly confronted with the model by interpreting simulation results and suggesting scenarios.
In this context a multidisciplinary research team was put together: containing an AEDE field agent acting as an irrigation advisor, AEDE agricultural engineers and state officials, assisted by a foreign technical assistance from the Walloon Technical Cooperation (APEFE-WBI, Belgium). The irrigation advisor is full-time affected to the scheme. His ‘immersed’ presence intends (i) to arouse farmers’ confidence by providing pragmatic solutions to day-to-day water related problems, (ii) to instruct farmers on the causes of these hardships and on available technical and structural know-how to tackle them, and (iii) to set up a confidence based relationship between the teams engineers, responsible for the decision support tools, the state agents and the farmers.
Throughout the different study and application stages, several participatory meetings were organised attended by all the actors or their representatives. These participatory sessions served several rules: (i) to build a shared view of water allocation and management options, (ii) to support the negotiation and collective decision-making and (iii) to obtain stakeholders validation of the results.
2.5. Data
Agro-meteorological data were obtained from the INERA agricultural research station, situated in the centre of the scheme. Crop parameters came from international and national literature (Dembélé, 1991; Allen et al., 1998). The GIS data were on-screen digitized from an aerial photograph, and local state agents aided in the nomenclature of canals and parcels. Data from an old soil map elaborated by ‘Projet Vallée du Kou’ in 1986 were also integrated (no reference available).
With the installation of the irrigation counsellor in 2006, an intensive discharge measuring campaign was carried out over half the scheme (blocks 1, 2, 4 and 7) up to their tertiary level and sampled throughout the growing season. At the same moment, hydrometric scales have been installed at the head of each secondary canal and calibration curves elaborated. From 2006, discharge readings are carried out daily at the heads of these blocks.
Land occupations during each irrigation season from 2006 on were inventoried by the irrigation advisor and added to the GIS database.
3.1. Pre-PPP assessment
The perimeter scheme is characterised by a very heterogeneous soil type repartitioning: ranging from sandy to clayish soils (Figure 1). 39% of the soils are light-textured, hence less suitable for paddy rice due to the high degree of percolation losses. When combining these soil data with the land-use map for the irrigated season of 2006 (Figure 2), the sandy upstream parts of the scheme are occupied with rice, whereas the clayish downstream parts, more suitable for paddy rice, had to be abandoned due to a lack of water.
Fig.1 - Soil map. Fig.2 - Land use irrigated season of 2006. Based on these findings, a proposed land-use map has been established. The objectives were two-fold: (i) avoiding the allocation of paddy rice to the light-textured soils in order to save water, and (ii) use the gained water to expand the downstream irrigated areas. In order to not become over-ambitious less water-demanding maize was proposed for these freshly gained parcels
The calculated performance indicators for 2006 are presented in Table 1. The assessment has been carried out at scheme level and at the interior of several blocks. For the scheme level evaluation, the inlet form 4 out of 8 blocks was daily monitored. For the assessment of management practices inside the blocks, discharges of the tertiary canals were measured at random times throughout the season. As being based on different discharge measurements (secondary and tertiary inlets), different indicator values are hence noted for the scheme level and for the block levels, in the case of 2006. Most of the indicators show that the management practises inside the blocks are worse than the water distribution amongst the different blocks. Adequacy was ‘less poor’ for block 1, because of its upstream position and the result of more water being available. The efficiency indicator confirms this. Efficiency is poor for block 1 due to losses and over-irrigation; they are good to very good for the other blocks. When water
is scarce and nearly matches the demands, efficiency is always high. Dependability and equity are poor for all the considered blocks and worsen towards the more downstream blocks. When less water is available at the head of a block, it is a harder to guarantee an equal distribution and even harder to deliver the desired amount of water when needed.
The pre-PPP assessment revealed that there is ample space for improvement on land-use and water distribution. A decision-support tool, SIMIS, was instaured for the development of an equitable water distribution policy.
Table 1: Summary of performance indicators; with tertiary canal discharge measurements at the basis for the block level indicators (left) and secondary canal discharge measurements for the scheme level analysis (middle), with legend (right).
Block 1 Block 2 Block 4 Block 7 2006 2009 2010
PA [-] 0,65 0,59 0,44 0,53 0,67 0,75 0,72 poor < 0,8 < fair < 0,9 < good
PF [-] 0,73 0,98 0,90 0,91 0,88 0,80 0,81 poor < 0,7 < fair < 0,85 < good
PD [-] 0,38 0,43 0,59 0,72 0,29 0,28 0,30 poor > 0,2 > fair > 0,1 > good
PE [-] 0,37 0,37 0,40 0,61 0,46 0,34 0,34 poor > 0,25 > fair > 0,1 > good
RI [-] 0,80 0,83 0,81
Qm [l/s] 1 429 1 419 1 313
legend
block level (2006) scheme level
With PA: Adequacy (delivered amount to required amount); PF: Efficiency (required amount to delivered amount);
PD: Dependability (temporal uniformity of the relative amount delivered); PE: Equity (spatial uniformity of the relative amount delivered);
RI: Rate of irrigation (irrigated land to irrigable land); Qm: Mean discharge available for the whole plain. 3.2. Appropriation activities
Prior to proposing a new land-use scheme and elaborating more equitable irrigation calendars with SIMIS, several participatory meetings took place. Most of them were animated by the irrigation advisor assisted by the engineering unit. The WUAs representatives and the state agents were always present. The assessment results were discussed and SIMIS was presented as a possible tool in aiding the decision-making towards a better management for the Kou Valley.
Soon after these popularizing and public awareness sessions, several work sessions were organised in order to discuss and present different water management scenarios. Based on the different soil characteristics (filtering sandy or heavy clayish) and the regions two most cultivated crops, paddy rice and maize, 4 different management scenarios were presented: (i) optimising the land-use by respecting the nature of the different soil types (basically: maize on sandy soil and rice only on clayish soils), (ii) leaving certain sectors fallow, (iii). proposing a systematic rotation of crops (rice on year, followed by maize the next) and (iv) a softer version of the first scenario allowing more paddy rice but under deficit irrigation (Geerts and Raes, 2009). At all times, farmers were heard and fine tunings of the different scenarios were carried out. Finally the WUA adopted the ‘deficit irrigation scenario’.
At the end of this first jointly managed irrigation season (2009) an evaluation was carried out. Proposed vs. actual land use and proposed vs. observed discharges at
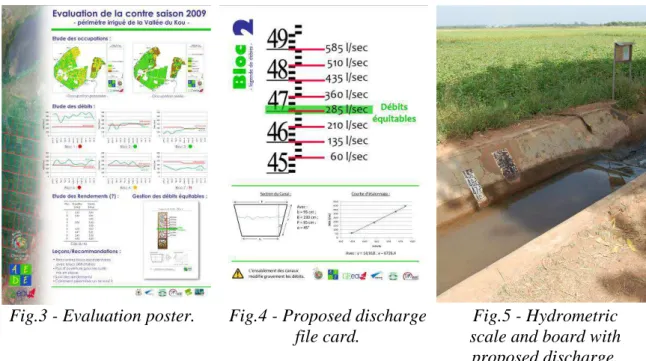
After a general assessment of the past campaign, farmers were heard on the difficulties they had encountered and recommendations for the next irrigated season were made. (i) ‘Discharge legends’ were drafted (Figure 4) and installed at the headwork of each block (Figure 5). It allowed the farmers to have an idea of the water being consumed by the different blocks and stimulated some peer-pressure based control (Aggarwal, 2000) as the proposed discharge for each bock is also indicated. (ii) A yield monitoring was also proposed in order to have an idea of the economic impact of the deficit irrigation scenario. (iii) The farmers, being satisfied as more land had been cultivated (see below and Map 4), agreed for another round of deficit irrigation in 2010.
The campaign of 2010 consolidated the actions of 2009. The ‘discharge legends’ proved to have a major impact on the water regulation. Farmers were now able to monitor the schemes water use: the water they received and the amount for their neighbours. The sometimes faulty behaviour of the water bailiff was easily (and often) spotted by the farmers claiming sanctions from the WUA.
Fig.3 - Evaluation poster. Fig.4 - Proposed discharge file card.
Fig.5 - Hydrometric scale and board with
proposed discharge. 3.3. PPP assessment
Besides the noted approval and satisfaction from the farmers on the current management scheme, a quantitative evaluation of the PPP was carried out. Land use was inventoried for the irrigated seasons of 2009 and 2010. Discharges at the headworks of each block were monitored on a daily basis throughout the irrigation seasons.
The proposed land-use was partly respected (Figures 6 and 7). More downstream land had been cultivated, but most of the upstream sandy parcels were hard to convince into changing the land-use. Nevertheless more maize started being cultivated in block 1. Table 1 shows that for a diminishing available amount of water (Qm goes from 1.429 l/s to 1.313 l/s), the irrigated surface remained stable (RI form 0,80 to 0,81). It even increased for the 2009 campaign, less touched by water scarcity.
The performance indicators for 2009 and 2010 are compared with the one for 2006 in Table 1. For three out of four indicators some improvement can be noted. None of the indicators changed significantly compared to the pre-PPP assessment. But in a situation where water is becoming rapidly scarcer, a further decline in water management was avoided. Adequacy remained poor, but that was to be expected under
deficit irrigation. Efficiency dropped from ‘good’ to ‘fair’, mostly because the water-bailiff had problems respecting the allocated amounts. Dependability remained stable, what can be considered as positive in the light of a diminishing water source. Equity improved, meaning the more equitable water distribution was being respected by the farmers. But a long way is still ahead.
As for the rice yield in 2010, a mean 4,3 tonnes/ha was measured on a sample of 215 fields (Nitcheu et al., 2010). Even under deficient irrigation, this yield beats the one of 3,8 tonnes/ha mentioned in former studies (Ouédrago 1993; Lahcen, 2000).
Fig.6 - Land use irrigated season of 2009. Fig.7 - Land use irrigated season of 2010 4. Conclusions
All in all, substantial progress is being felt in the water management of the Kou Valley irrigation scheme. The farmers’ awareness is genuine; they desire the information and popularization sessions to continue down to the WUAs very bases. They want the irrigation counsellor and the engineering team to continue helping them in the elaboration and follow-up of management scenarios.
The biggest bottleneck in professionalising the schemes water management remains in the non-formalization of the water users and the water bailiffs, who do not necessary feel obliged to follow the collectively decided rules by lack of sanctions.
As results fluctuate from one year to another, it is hard to tell whether the PPP approach actually contributed to a better water management. But the trends can nevertheless be considered as encouraging. It remains also interesting and hopeful to see how all the stakeholders in this PPP willingly repositioned themselves, each in their field of competence. The irrigation counsellor and the engineering team focus on advising by means of popular information sessions for the WUA and its members. They deliver objective, formerly non available, ground data that guides the discussions and helps to adopt water management plans. The state agents assume the accompanying measures, they’re best suited to impose the rules and inflict sanctions. Through all this participatory decision making and positive evolutions, the WUA finds its social capital enlarged granting it a more successful future (Subramanian et al., 1997).
Acknowledgements
This study enters in a larger project entitled: ‘Structural strengthening of the management capacity of water resources for the agriculture in the Kou watershed (Burkina Faso)’ (also on www.ge-eau.org). The authors gratefully acknowledge this
References
AGGARWAL, R.M., 2000. Possibilities and limitations to cooperation in small groups: the case of group-owned wells in Southern India. World Development, Vol. 28, No .8, p. 1481-1497.
ALLEN, R., PEREIRA,L.S., RAES,D., SMITH, M., 1998. Crop evapotranspiration-guidelines for computing crop water requirements. Irrigation and Drainage Paper 56.FAO, Rome, Italy. 300 p.
BECU,N.,NEEF,A.,SCHREINEMACHERS,P.,SANGKAPITUX,C.,2008. Participatory computer simulation to support collective decision-making: Potential and limits of stakeholder involvement. Land Use Policy, Vol. 25, p. 498-509.
DEMBÉLÉ Y., 1991. Etude des besoins en eau du riz irrigué dans différentes conditions
pédoclimatiques du Burkina Faso. Actes semin. intern. ‘L’influence du climat sur la production des cultures tropicales’, Ouagadougou (Burkina Faso), 23-28 sept. 1991, CTA Wageningen (Pays-Bas), ISESCO Rabat (Maroc). p. 118-127.
DOOREMBOS, J., PRUITT, W.O., 1977. Crop water requirements. Irrigation and Drainage Paper 24. FAO, Rome, Italy. 144 p.
FAO, 2001. SIMIS: Scheme Irrigation Management Information System. Version 2.0 for Windows. Sargardoy, J.A., Pastore, G., Yamashita, I., López-Cortijo, I. FAO Land and Water Digital Media Series No. 6. Rome, Italy.
GEERTS, S., RAES, D., 2009. Deficit irrigation as an on-farm strategy to maximize crop
water productivity in dry areas. Agricultural Water Management, Vol. 96, Is. 9, p. 1275-1284.
GIORDANO,R.,PASSARELLA,G.,URICCHIO,V.F.,VURRO,M., 2007. Integrating conflict
analysis and consensus reaching in a decision support system for water resource management. Journal of Environmental Management, Vol. 84, p. 213-228.
IWACO/BERA, 1988. Rapport final de la mission d’appui d’étude des prélèvements d’eau entre la Guinguette et la prise de Diaradougou. Projet Vallée du Kou – Mission Néerlandaise. Bobo-Dioulasso, Burkina Faso. 32 p. + Annexes.
IWACO/BURGEAP, 1998. Diagnostic des grands périmètres irrigués dans le sud-ouest du Burkina Faso : Vallée du Kou – Banzon – Karfiguéla. Tome 2 : Vallée du Kou. RESO. 47 p. + Annexes
JAHROMI,S.S.,FEYEN,J., 2001. Spatial and temporal variability performance of the water delivery in irrigation schemes. Irrigation and drainage Systems, Vol. 15, p. 215-233.
KERSTEN,G.,CONCILIO,G., 2002. Information Technologies for Environmental
Decision-Making in Networked Societies. InterNeg Research Papers INR 04/02. 29 p. [cited 2011-04-28] Available from Internet: http://interneg.org/.
KHALKHEILI,T.A.,ZAMANI, G.H., 2009. Farmer participation in irrigation management: The case of Doroodzan Dam Irrigation Network, Iran. Agricultural Water
Management, Vol. 96, p. 859-865.
LAHCEN O., 2000. Exploitation et entretien des réseaux d’irrigation du périmètre irrigué de la Vallée du Kou. Programme spécial pour la sécurité alimentaire, FAO-Maroc-Burkina Faso. 52 p.
LOZANO,D.,MATEOS,L., 2008. Usefulness and limitations of decision support systems for improving irrigation scheme management. Agricultural Water Management, Vol. 95, p. 409-418.
MATEOS,L.,I.LOPEZ-CORTIJO,I.,SAGARDOY,J.A., 2002. SIMIS: the FAO decision
support system for irrigation scheme management. Agricultural Water Management, Vol. 56, Is. 3. p. 193-206.
MEINZEN-DICK,R.,RAJU,K.V.,GULATI,A., 2002. What affects organization and
collective action for managing resources? Evidence form canal irrigation systems in India. World Development, Vol. 30, No. 4, p. 649-666.
MOLDEN D.J.,GATES,T.K., 1990. Performances measures for evaluation of irrigation
water delivery systems. Journal of Irrigation and Drainage, Vol. 116, p. 804-823. NITCHEU,M.N.,MIDEKOR A.,SAWADOGO,B.,WELLENS,J., 2010. Rapport campagnes
de suivi des rendements à la Vallée du Kou: saison humide 2009 et saison sèche 2010. 11 p. [cited 2011-04-28] Available from Internet: www.ge-eau.org.
NKHOMA B.G.,WAPULUMUKA,O.,MULWAFU,O., 2004. The experience of irrigation management transfer in two irrigation schemes in Malawi, 1960s-2002. Physics and Chemistry of the Earth, Vol. 29, p. 1327-1333.
OUÉDRAOGO S., 1993. Analyse économique de l’allocation des facteurs de production
dans les exploitations rizicoles de la Vallée du Kou. CNRST/INERA. Ouagadougou, Burkina Faso. 61 p.
RAIFFA,H.,RICHARDSON,J.,METCALFE,D., 2002. Negotiation Analysis. Harvard
University Press, Cambridge, MA. 608 p.
SMITH,M., 1992. CROPWAT: A computer program for irrigation planning and
management. Irrigation and Drainage Paper 46. FAO, Rome, Italy. 126 p. SUBRAMANIAN,A.,JAGANNATHAN,N.V., AND MEINZEN-DICK,R., 1997. User
Organizations for Sustainable Water Services. World Bank Technical Paper No. 354. The World Bank, Washington, D.C.. 155 p.
UNAL,H.B.,ASIK,S.,AVCI,M.,YASAR,S.,AKKUZU,E., 2004. Performance of water
delivery system at tertiary canal level: a case study of the Menemen Left Bank Irrigation System. Agricultural Water Management, Vol. 65, Is. 3, p. 173-191 UYSAL Ö.K.,ATIŞ,E., 2010. Assessing the performance of participatory management
over time: a case study from Turkey. Agricultural Water Management, Vol. 97. p. 1017-1025
VALFREY,B.,DIALLO,M., 2004. Etat des lieux et perspectives pour l’eau et
l’assainissement: Burkina Faso. Livre Bleu. Le Secrétariat International de l’Eau, Montréal, Canada. 42 p.
VANDERSYPEN,K.,BENGALY,K.,KEITA,A.C.T.,SIDIBE,S.,RAES,D.,JAMIN,J.Y.,
2006. Irrigation performance at tertiary level in the rice schemes of the Office du Niger (Mali): adequate water delivery through over-supply. Agricultural Water Management, Vol. 83, p. 144-152.
VERMILLION,D.L., 2000. Guide to monitoring and evaluation of irrigation management
transfer. JIID/INPIM, USA.
WELLENS,J.,DIALLO,M.,COMPAORE,N.F.,DEROUANE,J.,TYCHON,B., 2007.
Renforcement structurel de la capacité de gestion des ressources en eau pour
l’agriculture dans le bassin du Kou. Rapport Technique 1 (2005-2006). APEFE-WBI, Bobo-Dioulasso, Burkina Faso. 128 p. [cited 2011-04-28] Available from Internet: www.ge-eau.org.
WELLENS,J.,DIALLO,M.,COMPAORE,N.F.,DEROUANE,J.,TYCHON,B., 2009. Renforcement structurel de la capacité de gestion des ressources en eau pour
l’agriculture dans le bassin du Kou. Rapport Technique 2 (2007-2008). APEFE-WBI, Bobo-Dioulasso, Burkina Faso. 131 p. [cited 2011-04-28] Available from Internet: www.ge-eau.org.
World Bank (2007). Emerging Public-Private Partnerships in Irrigation Development and Management. Water Sector Board Discussion Paper Series. Paper No. 10. The World Bank, Washington D.C.. 50 p.