HAL Id: hal-00299434
https://hal.archives-ouvertes.fr/hal-00299434
Submitted on 13 Jun 2007
HAL is a multi-disciplinary open access
archive for the deposit and dissemination of
sci-entific research documents, whether they are
pub-lished or not. The documents may come from
teaching and research institutions in France or
abroad, or from public or private research centers.
L’archive ouverte pluridisciplinaire HAL, est
destinée au dépôt et à la diffusion de documents
scientifiques de niveau recherche, publiés ou non,
émanant des établissements d’enseignement et de
recherche français ou étrangers, des laboratoires
publics ou privés.
A test for checking earthquake aperiodicity estimates
from small samples
M. Mucciarelli
To cite this version:
M. Mucciarelli. A test for checking earthquake aperiodicity estimates from small samples. Natural
Hazards and Earth System Science, Copernicus Publications on behalf of the European Geosciences
Union, 2007, 7 (3), pp.399-404. �hal-00299434�
Nat. Hazards Earth Syst. Sci., 7, 399–404, 2007 www.nat-hazards-earth-syst-sci.net/7/399/2007/ © Author(s) 2007. This work is licensed under a Creative Commons License.
Natural Hazards
and Earth
System Sciences
A test for checking earthquake aperiodicity estimates from small
samples
M. Mucciarelli
Dept. of Structures, Geotechnics and Engineering Geology, Univ. of Basilicata, Potenza, Italy
Received: 28 February 2007 – Revised: 31 May 2007 – Accepted: 31 May 2007 – Published: 13 June 2007
Abstract. In recent years, many new models for earthquake
recurrence were proposed. Some are focusing on the cluster-ing properties on a small time scale, while others try to model the long term behavior of large mainshocks. To this last pur-pose, there is a growing interest for models that take into ac-count the aperiodicity aiming to a time-dependent hazard es-timate. It is well known that a limited number of inter-event times (IETs) may lead to biased values of the distribution pa-rameters. To overcome this problem different solutions were proposed. This paper focuses on two of them: Monte Carlo simulation of the process and aperiodicity estimated via a sta-tistical proxy. The topics discussed are: 1) how many IETs are needed for a correct estimate, 2) to which extent a Pois-son distribution is equally able to describe the process, 3) the influence of errors associated to paleoseismological IETs, and 4) the goodness of the success ratio from simulations. A simple test is proposed to discriminate real aperiodicity from apparent aperiodicity coming from undersampling.
1 Introduction
The standard Poisson process requires only one parameter to model the occurrence of earthquakes, that is the mean re-currence time (µ). The standard deviation (σ ) is assumed to be equal to the mean. The ratio α=σ/µ (coefficient of variation or aperiodicity) is taken as an indication of statisti-cal properties of the relevant time series and used in renewal models for time-dependent hazard analysis. When α>1, the time series exhibits clustering properties. Values <1 indicate the possible presence of periodicity, with increasing proba-bility for decreasing α. The Log-normal, Weibull and Brow-nian Passage Time (BPT) models require to estimate from sample data both µ and α. Performing a bootstrap
numer-Correspondence to: M. Mucciarelli
ical simulation for 100 realizations of a BPT process with
µ=1 and α=0.5, Ellsworth et al. (1999) showed that α is
un-derestimated when the number of events in the catalogue is small (<10). Parsons (2005) implemented a more sophisti-cated Monte Carlo simulation of a BPT, trying to simulate observed sequences with a range of mean IET and aperiodic-ity. Events were repeatedly drawn at random from each dis-tribution, attempting to match the observed event windows. The two sequences studied occurred both on the San Andreas Fault: 14 event at Wrigthwood (Fumal et al., 2002) and 10 events at Pallet Creek (Sieh et al., 1989). Each distribution was sampled 5 million times, with a success ratio equal to 5.4 10−6for Wrigthwood and 2.8 10−6for Pallet Creek.
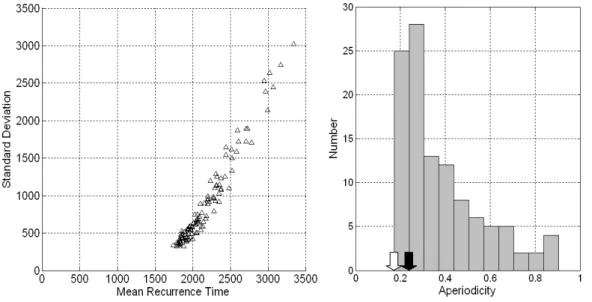
The long paleoseismological records obtained in Califor-nia can be hardly matched in other countries. The increasing number of studies on active seismogenic sources prompted researchers to find new ways of including these data in seis-mic hazard estimates. An example is coming from Italy: in recent years several studies on seismogenic sources al-lowed for the creation of an on-line data base (DISS Working Group, 2006). On the other hand, attempts were made to in-clude paleoseismological data in seismic hazard estimates: the most recent example is given by Pace et al. (2006). In the area they studied (Central Italy) the longest record avail-able is for the Fucino fault, with 5 events in about 8000 years (Galadini and Galli, 1999). Pace et al. (2006) recognized that the number of IETs was not sufficient for an unbiased estimate of α, so they decided to use a statistical proxy of aperiodicity: for each fault they derived µ and σ from the distribution of mean recurrence times obtained with different techniques from the same dataset. The distribution of σ ver-sus µ and the histogram of α are reported in Fig. 1. It can be noted that the aperiodicity is concentrated around few values. If compared with the values obtained by Parsons (2006) it is also very small, leading to suspect a strong bias. At this point a series of simulations were carried out to try to answer some questions:
400 M. Mucciarelli: Earthquake aperiodicity estimates
Fig. 1. The distribution of σ versus µ (left) and the histogram of α (right) for 28 seismogenic sources in Central Italy, according with Pace et al. (2006).
Fig. 2 Numerical estimate of the underestimate of α with a bootstrap procedure on 100 catalogues Poisson
Lognormal
Fig. 2. Numerical estimate of the underestimate of α with a boot-strap procedure on 100 catalogues composed of 100 events each. For the two-parameters distribution the seed values were µ=1 and σ uniformly distributed between 0.95 and 1.05. The investigated parameter is the ratio between the true α and the one retrieved from the synthetic catalogues. For the Poisson case, the statistic is α re-trieved from data, or apparent aperiodicity.
– How many IETs are needed for a correct estimate? – To which extent a Poisson distribution is equally able to
describe the observed processes?
– Which is the influence of errors associated to
paleoseis-mological IETs?
– Which is he reliability of the success ratios obtained
from simulations?
2 Preliminary modeling and simulations
As mentioned above, Ellsworth et al. (1999) showed that for a BPT process the estimate of α is biased when the number of event is <10. In the following of this paper the ability of a Poisson process to reproduce the observed data will be dis-cussed, so it was interesting to compare the bias in aperiodic-ity estimate between a distribution with two free parameters and one with a single parameter.
The first step was the generation of two sets of 100 cata-logues composed of 100 events each. For the two-parameter distribution (Log-normal or BPT), the values were µ=1 and
σ uniformly distributed between 0.95 and 1.05. In this case
the investigated parameter was the ratio between the true α (that is the one used as seed of each simulation) and the one retrieved from the synthetic catalogues. For the Poisson case, the statistic was simply α retrieved from data, or apparent aperiodicity. The desired parameters were estimated for each catalogue using a bootstrap procedure, with the number of events varying from 3 to 100. The results are shown in Fig. 2 for the first 25 events (after that value the asymptotic behav-ior continues smoothly and converges to unity for more than 50 events). The Poisson process shows a slightly larger un-derestimate of the true aperiodicity. It is important to note
M. Mucciarelli: Earthquake aperiodicity estimates 401 3 4 5 6 7 8 9 10 1E-006 1E-005 1E-004 1E-003 1E-002 1E-001 1E+000 Fucino Pallet Creek Pallet Creek no sequence S u cce ss R a ti o
Fig. 3. Bootstrap procedure simulating 100.000 realizations of two Poisson processes having µ estimated from the Fucino data (µ=1498) and from the most recent events of the Pallet Creek se-quence (µ=120). For the Pallet Creek data set the comparison is also with or without the request for exact matching of the sequence (less restrictive, exact Poissonian condition; see text for details).
that here it is not included the effect on the estimate caused by the “seismic drought” (Davis et al., 1989): this issue will be discussed later. Another important point for further dis-cussions is that for a number of events equal to the longer se-quence available in Italy (5 earthquakes on the Fucino Fault), the apparent aperiodicity for a true Poisson process is 0.8, with 50% of the bootstrap values in the interval 0.70÷1.05. According with Galadini and Galli, the last 5 events on the Fucino fault occurred in 1915 AD, 508-618 AD, 1700-1300 BC, 3944-3516 BC, 5979-5576 BC. There are two previous events, but with a large overlapping time window that pre-vent their use in this analysis. Taking the midpoint of the intervals, the estimate of the parameters is µ=1923.1±389.6 years. The aseismic period since the last event is 91 y (less than 5% of µ) so according to Davis et al. (1999) the “seis-mic drought” effect is negligible. The aperiodicity estimates gives α=0.2: if compared with Fig. 2, it may seem unlikely that this distribution is Poissonian. More insights on the statistics of the Fucino sequence may come from simulations similar to those proposed by Parsons (2005). Figure 3 reports the results of a bootstrap procedure simulating 100.000 real-izations of two Poisson processes having µ estimated from the Fucino data and from the most recent events of the Pallet Creek sequence. With a limited number of events, a Pois-son process is able to reproduce the sequences with a suc-cess ratio much higher than the one obtained for the full
se-quence by Parson (2005) with a BPT process (≈10−6). The
simulation was not carried out for the whole Pallet Creek sequence, but the extrapolation of the negative exponential trend in Fig. 3 gives an estimated success ratio ≈10−8.
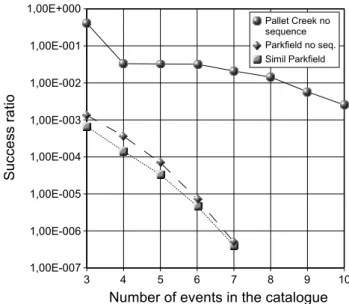
3 4 5 6 7 8 9 10 1,00E-007 1,00E-006 1,00E-005 1,00E-004 1,00E-003 1,00E-002 1,00E-001 1,00E+000 Pallet Creek no sequence Parkfield no seq. Simil Parkfield
Number of events in the catalogue
S u c c e ss ra ti o
Fig. 4. Bootstrap simulation of Pallet Creek and Parkfield se-quences, plus a sequence generated with a Poisson process with the same µ of Parkfield. The difference in success rate is due to the large errors in the paleoseismological datations, which are absent in the historical sequence of Parkfield.
The simulations were carried out imposing that the se-quence of IETs should match exactly the real one. This makes more sense if one aim to simulate a renewal process, where the memory of the system has to be taken into account. But for a Poisson process, the exact temporal sequence of the IETs is not an issue: it is sufficient that each one of the simu-lated recurrence times falls within the boundary of one (and only one) of the intervals from the real data. This new con-dition on the simulations greatly improves the success ratio. Figure 3 shows what happens to the Pallet Creek data set: the whole sequence can be simulated by a single-parameter Pois-son process with a success ratio 10−3times greater than the
one obtained by Parsons (2006) and 10−5times greater than
the one previously estimated. Thus the conditions imposed on the simulation regarding the memory of the system have a very strong influence on the result.
Another factor that has to be investigated is the error as-sociated to the paleoseismological data. The influence of the datation errors can be evaluated using a sequence composed of historical data only. The Parkfield sequence provides a very good example. Bakun and Lindh (1985) suggest that characteristic M = 6 earthquakes occurred in 1857, 1881, 1901, 1922, 1934, and 1966. Then in 2004 the 7th event occurred, spurring a debate on the characteristic earthquake model itself (Jackson and Kagan, 2006). 10 million simula-tions were run, using µ=24.5 and comparing against the real Parkfield sequence and against a Poisson sequence randomly generated using the same µ. Also in this case the less restric-tive rule on sequences was applied. The results are shown in Fig. 4: the two simulations give very similar results, but with
402 M. Mucciarelli: Earthquake aperiodicity estimates
Fig. 5. ECDFs of aperiodicity from the first n IETs and from the whole sequences that match the Fucino data set (Poisson process, µ=1923 from real data, no restriction on exact sequence).
a success ratio much smaller than the Pallet Creek one. The drop in the success ratio is in the range 102−103. It is inter-esting to note that the values obtained for Parkfield are simi-lar to those obtained for Fucino and Pallet Creek sequences in Fig. 3. This means that reducing the errors on paleoseismo-logical data decreased the success ratio of the same amount it is increased by lifting the restrictive condition on the exact match of the sequence.
3 Testing aperiodicity from small samples
The test proposed for checking the earthquake aperiodicity from short catalogues is based on the following assumptions, derived from the insight gained in the previous chapter:
1. When small samples are considered, it is better to start with 1-parameter simulation rather than 2-parameters simulations. If the real sequence has a significant ape-riodicity, it can be observed and proved against the null hypothesis of Poissonian behavior.
2. Dealing with Poisson processes, the restriction on the exact match between observed and simulated sequences can be lifted. Instead, it will be sufficient that each one of the simulated recurrence times must fall within the
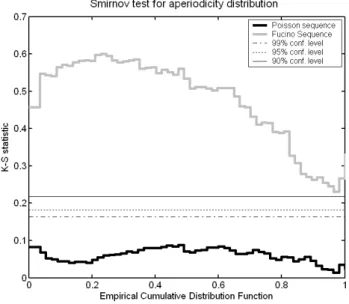
Fig. 6. K-S statistics for the full Fucino sequence (n=4) and for a Poisson process generated with µ=1923 y and an error similar to the paleoseismological data. The confidence limits refer to the rejection of equality hypothesis in the Smirnov test.
boundary of one (and only one) of the intervals from the real data.
3. The errors on the datation of pre-historic events greatly affect the absolute value of success ratio. Their effect on the trend of success ratio versus the number of events in the catalogue is less important. Thus, the success ratio alone is a poor estimate of the goodness-of-fit of our simulations, given its large variability. Instead, the simulations that match real sequences can be compared against single realization of a Poisson process having the same µ.
If the above is true, then a simple procedure is implemented in four steps:
1. Generate a set of two-parameters synthetic sequences (S) longer than the real one (R). Repeated test showed that 50 events are sufficient. Then, check for each S sequence if first n IETs match the n IETs of the R se-quence;
2. For the S sequences that pass the above check, estimate the aperiodicity from the first n IETs (αn)and then from
the whole sequence (α50).
3. Calculate the Kolmogorov-Smirnov statistic (K-S S), that is the absolute value of the maximum difference between the two empirical cumulative distribution func-tions (ECDFs) of αnand α50;
4. generate a Poisson process with the same µ of the R sequence, then repeat step 1 and 2 to obtain the statistic K-S R.
M. Mucciarelli: Earthquake aperiodicity estimates 403
Fig. 7. The distribution of σ versus µ and the histogram of α obtained for the Fucino sequence with 100.000 trials. The black arrow marks the α obtained for the Fucino fault by Pace et al. (2006), while the white one is the α estimated directly from the data given by Galadini and Galli (1999).
5. perform a Smirnov test on the K-S S and K-S R statis-tics. The second one should always pass the test at any significativity level, and act as a control group. If the first set does not pass the test, this means that we may suppose that the real IETs distribution is not Poissonian. Let us examine the practical case of the Fucino sequence. To check if the proposed procedure is reliable also for smaller sequences, the first two steps are performed for n=2,3,4. The results is shown in Fig. 5. The aperiodicity estimated from the whole sequences is much higher, and the mean value is close to 1, as expected for a Poisson process. The aperi-odicity estimated from the first n IETs yields a much lower
value, and the ECDFs are similar for n=2,3,4. Figure 6
shows the K-S statistics for the full Fucino sequence (n=4) and for a Poisson process generated with µ=1923 years and an error similar to the paleoseismological data. While the Kolmogorov-Smirnov test verify if an empirical CDF is dif-ferent from a theoretical one, the Smirnov test checks if the hypothesis that two ECDFs are coming from the same pop-ulation can be rejected. In both cases, the inequality of dis-tributions is proved if the maximum value of K-S statistics exceeds a given confidence level. In this case there are no doubt about rejecting the equality of the ECDFs for the real case. The difference between the ECDF of the aperiodicity estimated for the first 4 IETs and for the full sequence is al-ways greater than the test limits. A collateral advantage of the proposed procedure is that at this point we can use the distribution of aperiodicity estimated from the first n syn-thetics IETs. Figure 7 shows the distribution of σ versus µ and the histogram of α obtained for the Fucino sequence with 100 000 trials. The success rate is about 1.10−3. The black
arrow marks the α obtained for the Fucino fault by Pace et al. (2006), while the white one is the α estimated directly from the data given by Galadini and Galli (1999). Both ap-pears to a lower bound of the distribution.
4 Discussion and conclusions
The simulation of synthetic sequences of earthquakes on a single fault (Parsons, 2005) proved to be an effective tool for the understanding the time distribution of events. However, the success ratio alone is a poor estimate of the goodness-of-fit of our simulations, given its large variability due to the width of errors on paleoseismological datation and more or less restrictive hypothesis on exact match of real data. A sim-ple technique is proposed to evaluate if the aperiodicity es-timated from short catalogues is real. The test was checked on the longest sequence of earthquakes associated to a single fault in Italy, the Fucino sequence. Even for a reduced num-ber of events, it is possible to reject the hypotehsis that the data are coming from a pure Poisson process.
Acknowledgements. I am indebted with E. Di Nardo at the
Math-ematical Dept. of Basilicata University for checking the statistical hypothesis. This work started from discussions had during the workshop “EARTHQUAKE AND SHAKING PROBABILITIES”, Erice (Italy), October 2006: thanks to the organizers for their efforts in making it possible. Many thanks to M. R. Gallipoli and P. Galli for their help and discussions. Thanks to D. Albarello and another anonymous reviewer for improving the manuscript. Financial support was provided by project DPC-INGV-S2.
404 M. Mucciarelli: Earthquake aperiodicity estimates
Edited by: M. Contadakis
Reviewed by: D. Albarello and two other referees
References
Bakun, W. H. and Lindh, A. G.: The Parkfield, California, earth-quake prediction experiment, Science, 229, 619–624, 1985. Davis, P. M., Jackson, D. D., and Kagan, Y. Y.: The longer it has
been since the last earthquake, the longer expected time till the next?: Bull. Seism. Soc. Am., 79, 1439–1456, 1989.
DISS Working Group: Database of Individual Seismogenic Sources (DISS), Version 3.0.2: A compilation of potential sources for earthquakes larger than M 5.5 in Italy and surrounding areas, www.ingv.it/DISS/, 2006.
Fumal, T. E., Weldon II, R. J., Biasi, G. P., Daeson, T. E., Seitz, G. G., Frost, W. T., and Schwartz, D. P.: Evidence for large earth-quakes on the San Andreas fault at the Wrightwood, California, Paleoseismic site: A.D. 500 to present, Bull. Seismol. Soc. Am., 92, 2726–2760, 2002.
Ellsworth, W. L., Matthews, M. V., Nadeau, R. M., Nishenko, S. P., Reasenberg, P. A., and Simpson, R. W.: A Physically-Based Earthquake Recurrence Model for Estimation of Long-Term Earthquake Probabilities, U.S.G.S. Open File 522, 22 pp., 1999.
Galadini, F. and Galli, P.: The Holocene paleoearthquakes on the 1915 Avezzano earthquake faults (central Italy); implications for active tectonics in the central Apennines, Tectonophysics, 308, 143–170, 1999.
Jackson, D. D. and Kagan, Y. Y.: The 2004 Parkfield Earthquake, the 1985 Prediction, and Characteristic Earthquakes: Lessons for the Future, Bull. Seism. Soc. Am., 96, S397–S409, 2006. Pace, B., Peruzza, L., Lavecchia, G., and Boncio, P.: Layered
Seis-mogenic Source Model and Probabilistic Seismic-Hazard Anal-yses in Central Italy, Bull. Seism. Soc. Am., 96, 107–132, 2006. Parsons, T.: Significance of stress transfer in time-dependent earth-quake probability calculations, J. Geophys. Res., 110, B05S02, doi:10.1029/2004JB003190, 2005.
Sieh, K., Stuiver, M., and Brillinger, D.: A more precise chronology of earthquakes produced by the San Andreas fault in southern California, J. Geophys. Res., 94, 603–623, 1989.