HAL Id: hal-00069172
https://hal-insu.archives-ouvertes.fr/hal-00069172
Submitted on 16 May 2006HAL is a multi-disciplinary open access
archive for the deposit and dissemination of sci-entific research documents, whether they are pub-lished or not. The documents may come from teaching and research institutions in France or abroad, or from public or private research centers.
L’archive ouverte pluridisciplinaire HAL, est destinée au dépôt et à la diffusion de documents scientifiques de niveau recherche, publiés ou non, émanant des établissements d’enseignement et de recherche français ou étrangers, des laboratoires publics ou privés.
An excel utility for the rapid characterization of ’funny
filters” in PIXE analysis.
Zdenek Nejedly, John L. Campbell, Sophie Gama
To cite this version:
Zdenek Nejedly, John L. Campbell, Sophie Gama. An excel utility for the rapid characteriza-tion of ’funny filters” in PIXE analysis.. Nuclear Instruments and Methods in Physics Research Section B: Beam Interactions with Materials and Atoms, Elsevier, 2004, 219-220, pp.136-139. �10.1016/j.nimb.2004.01.041�. �hal-00069172�
An Excel utility for the rapid characterization of "funny
filters" in PIXE analysis
Zdenek Nejedly, a, John L. Campbella and Sophie Gamab
a Guelph-Waterloo Physics Institute, University of Guelph, Graduate Work in Physics,
Guelph, ON, Canada N1G 2W1
b Institut des Sciences de la Terre d'Orléans (ISTO), CNRS/Université d'Orléans, 1A, rue de la
Férollerie, 45071, Orléans Cédex 2, France
Abstract
"Funny filters", i.e. compound absorbers with an aperture in one layer, provide an effective means of recording both trace and major element X-ray lines in a single PIXE spectrum. However, the characterization of funny filters has some pitfalls. An Excel utility has been developed to characterize the physical parameters of the filter on the assumption of a constant H-value for the PIXE system. Its application is illustrated using data taken independently at two laboratories.
Author Keywords: PIXE analysis; Funny filter; Data evaluation; Calibration; Analytical
software
1. Introduction
The concept of the "funny filter" was introduced by Harrison and Eldred [1] early in the development of proton-induced X-ray emission (PIXE) as an analytical technique. Most PIXE work is done with an absorbing foil interposed between the specimen and the Si(Li) X-ray detector; this provides preferential absorption of low-energy bremsstrahlung background, thereby increasing the throughput of higher-energy characteristic X-ray signals that carry the desired trace element information. Mylar and aluminum are the most widely used absorbers, although materials of higher atomic number are sometimes used to achieve in addition critical absorption of particular intense characteristic X-rays. The drawback of such an absorber is that it prevents the appearance in the X-ray spectrum of the peaks that arise from very light elements. To take an important example, viz. the analysis of mineral grains, the peaks due to the major element constituents sodium, magnesium, aluminum and silicon may be lost. One solution is to use two detectors, with and without absorbers, recording trace and major element data respectively. Another solution is to employ a "funny filter".
The "funny filter" comprises one or more normal absorbing foils, in one of which is drilled a very small central aperture whose area is a few percent of the detector surface area. A small fraction of the light, major element X-rays is transmitted through this aperture, and because these X-rays are excited with high cross-sections, the resulting peaks in the spectrum have intensities comparable to those of the higher atomic number trace elements (typically Z>22). The small enhancement of bremsstrahlung that is transmitted through the aperture does not have significant deleterious effects upon the analysis.
While it is reasonably straightforward to characterize a normal filter, this is not the case for a funny filter. We therefore present a simple Excel-based method, which enables one to proceed quickly and accurately from the nominal parameters of the detector-filter arrangement to optimized parameters that are physically realistic.
2. Formalism
Our approach is based upon the instrumental constant approach that we have introduced [2] and developed [3 and 4]. A detailed account is found in [5]. The detected characteristic X-ray yield Y(Z) for the principle line from a constituent element having atomic number Z and concentration CZ in a matrix M, is given by
Y(Z)=HY1(Z,M)CZt(Z) (Z), (1)
where Y1(Z,M) is the theoretical X-ray yield per steradian per unit proton charge and per unit
concentration, t(Z) is the transmission of the line in question through any absorbers present, and (Z) is the intrinsic efficiency of the X-ray detector.
Our practice is to employ standards and standard reference materials to measure the instrumental constant H, which is in principle equal to the detector solid angle modified by any calibration factor involved in the beam charge measurement. In practice we find, as expected, that H is constant for X-ray energies above 5 keV. But we and others observe departures from constancy at lower energies [6], and these departures may be attributed to inadequate knowledge of the parameters governing detector efficiency.
In the case of a funny filter consisting of a compact layer with nominal transmission t1(Z) for
the element Z, and a perforated layer with transmission t2(Z) with an aperture of the
proportional area R, the filter transmission term in Eq. (1) is usually of the form
t(Z)=t1(Z)[R+(1−R)t2(Z)]. (2)
Obviously the individual transmission terms depend upon the foil thicknesses and the pertinent mass attenuation coefficients. The foil thicknesses may be known with some accuracy specified by the supplier. R is the ratio of foil aperture area to detector surface area; the area of the small aperture depends on how it is made and may be estimated with a microscope, and the detector area may be specified by the manufacturer or measured by the usual method of scanning a point radio nuclide source.
3. Observations of variable H value with funny filters
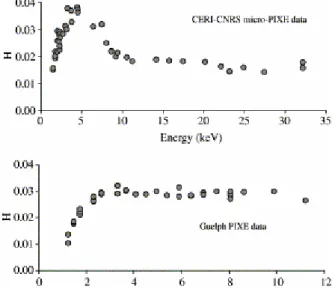
Fig. 1 provides two examples from different laboratories of situations where the instrumental constant H has been found to vary dramatically with X-ray energy. The upper set was taken by Gama et al. [7] using the proton microprobe at the CERI-CNRS laboratory in France. This set was recorded to standardize the micro-PIXE system prior to analysis of a set of ores and minerals including three natural sulfides previously analyzed by EPMA (galena, chalcopyrite and sphalerite), five pure metals and an alloy and a set of 19 standard minerals called C320
and supplied by Oxford Instruments. The lower set was taken recently in the Guelph broad-beam PIXE facility using the suite of thin single- and multi-elemental XRF standards [8 and 9] that are customarily applied in that laboratory's work on air particulate analysis. Table 1 gives the nominal parameters of the two funny filters. In each case, the result does not appear physically tenable and one must conclude that a better description of the composite funny filter is required.
Fig. 1. H values measured using standards and standard reference materials at two laboratories.
Table 1. Nominal and optimized parameters of the two funny filters
4. Funny filter optimization procedure
Our optimization of the funny filter parameters employs the "ActiveX Absorption Component", which has been built using the Component Object Model (COM) software design technology [10]. It provides calculations of X-ray transmission through thin films, using the algorithms and data files from the GUPIX package [11]. The algorithms use parametrization scheme based on the XCOM-generated X-ray attenuation coefficients [12]. In
the present application, the component computes the transmission of a funny filter based upon user-supplied values of the foil thicknesses and aperture fraction. Once the absorption component is installed on a microcomputer, it may be used, for example, within Microsoft Excel, for quick determination of the parameters of a funny filter.
The component provides the X-ray transmission as a function of X-ray energy, and the parameter optimization is performed by Excel's own solver module using a generalized reduced gradient nonlinear approach. The transmission expression may be modified in the spreadsheet to define the absorber atomic numbers and to vary the number of foils. The parameters to be optimized by the solver are the foil thicknesses, the aperture fraction and the
H value (assumed here to be independent of X-ray energy). First, the initial set of measured
reference H values Hri, determined using GUPIX in our two examples, is entered into the
spreadsheet along with the nominal values of the filter parameters. Here the subscript i denotes the set of measurable X-ray lines in the reference targets. Then, a data column Tri is
added, which quantifies the transmission through the absorption layers with the same nominal parameters used to evaluate the reference H-values. A second column Tvi(t1,t2,…,tn) describes
the X-ray transmission as a function of the variable thickness parameters t1,t2,…,tn. Finally,
the fit function Hfi is defined as
Hfi=HriTri/Tvi. (3)
A sum of squares (Hfi−H0)2, where H0 represents the fitted energy-independent H value, is
then minimized by the Microsoft Excel Solver. The solver determines the optimal values
t1,t2,…,tn and H0 in a few minutes via a user-friendly visual method. As well as presenting the
new parameter values the spreadsheet displays a plot of the revised H values that arise from these values. The user must inspect this, and may elect to initiate further iterations to improve the flatness of this plot. We have found that the gradient search may not always converge to a physically realistic outcome without such user intervention. But we also find that this Excel-based approach is much faster than repeated evaluation of the calibration spectra with GUPIX as a means of defining the funny filter.
5. Results
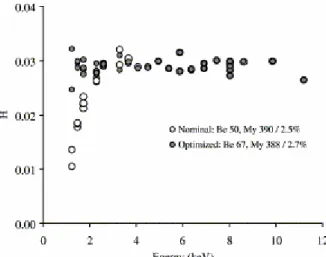
The ActiveX component has been applied to optimize the funny filter parameters for our two examples on the assumption that H should be a constant. The nominal and optimized parameters for the two cases are in Table 1. The graphical results produced by Excel are in Fig. 2 and Fig. 3. In the case of the CERI-CNRS data, our characterization of the funny filter corresponds closely to the values determined independently in [7].
Fig. 2. H values for Guelph PIXE system using nominal filter parameters and parameter values optimized by the ActiveX component (Table 1).
Fig. 3. H values for CERI-CNRS micro-PIXE system using nominal filter parameters and parameter values optimized by the ActiveX component (Table 1).
6. Conclusions
The method described appears to provide satisfactory optimization of the physical parameters of a funny filter, and it does so in a simple and rapid manner. It can be extended within the spreadsheet to any desired number of absorbing layers subject to the restriction that only one layer has an aperture. The ActiveX component is being incorporated in the GUPIX software package.
Acknowledgements
We are grateful to C. Ramboz for sending us the CERI-CNRS data. We acknowledge the financial support of the natural Sciences and Engineering Research Council of Canada.
References
2. J.A. Maxwell, J.L. Campbell and W.J. Teesdale. Nucl. Instr. and Meth. B 43 (1989), p. 218. 3. J.L. Campbell, D. Higuchi, J.A. Maxwell and W.J. Teesdale. Nucl. Instr. and Meth. B 77 (1993), p. 95.
4. J.L. Campbell, T.L. Hopman, J.A. Maxwell and Z. Nejedly. Nucl. Instr. and Meth. B 170 (2000), p. 193.
5. S.A.E. Johansson, J.L. Campbell and K.G. Malmqvist, Particle-Induced X-Ray Emission Spectrometry (PIXE). , John Wiley & Sons Inc., New York (1995).
6. Z. Nejedly, J.L. Campbell, W.J. Teesdale and C. Gielen. Nucl. Instr. and Meth. B 132 (1997), p. 489.
7. S. Gama, M. Volfinger, C. Ramboz and O. Rouer. Nucl. Instr. and Meth. B 181 (2000), p. 150.
8. MicroMatter Co., MicroMatter X-Ray Fluorescence Calibration Standards, 123 Madrona Lane, Deer Harbor, WA 98243
9. National Institute of Standards and Technology: standard reference material 1832 and 1833: Thin glass film on polycarbonate for X-ray fluorescence spectrometry, Gaithersburg, MD
10. Microsoft Corporation (2002), COM: Delivering on the Promises of Component Technology. (online) http://www.microsoft.com/com/, accessed 8 June 2003
11. J.A. Maxwell, W.J. Teesdale and J.L. Campbell. Nucl. Instr. and Meth. B 95 (1995), p. 407.