HAL Id: hal-00304796
https://hal.archives-ouvertes.fr/hal-00304796
Submitted on 1 Jan 2003HAL is a multi-disciplinary open access archive for the deposit and dissemination of sci-entific research documents, whether they are pub-lished or not. The documents may come from teaching and research institutions in France or abroad, or from public or private research centers.
L’archive ouverte pluridisciplinaire HAL, est destinée au dépôt et à la diffusion de documents scientifiques de niveau recherche, publiés ou non, émanant des établissements d’enseignement et de recherche français ou étrangers, des laboratoires publics ou privés.
in sensitive freshwater regions in Europe
W. Schöpp, M. Posch, S. Mylona, M. Johansson
To cite this version:
W. Schöpp, M. Posch, S. Mylona, M. Johansson. Long-term development of acid deposition (1880?2030) in sensitive freshwater regions in Europe. Hydrology and Earth System Sciences Dis-cussions, European Geosciences Union, 2003, 7 (4), pp.436-446. �hal-00304796�
Long-term development of acid deposition (18802030) in
sensitive freshwater regions in Europe
Wolfgang Schöpp
1, Maximilian Posch
2, Sophia Mylona
3and Matti Johansson
1,41International Institute for Applied Systems Analysis (IIASA), A-2361 Laxenburg, Austria 2Coordination Center for Effects/RIVM, NL-3720 BA Bilthoven, The Netherlands 3Norwegian Pollution Control Authority (SFT), N-0032 Oslo, Norway
4Finnish Environment Institute, FIN-00251 Helsinki, Finland
E-mail for corresponding author: [email protected]
Abstract
Time series of the deposition of acidifying substances are a pre-requisite for the study of the acidification and recovery of ecosystems such as surface waters. This paper reports the derivation and calculation of deposition trends of the potentially acidifying compounds SO2, NOx and
NH3 in sensitive freshwater regions in Europe studied in the EU-funded RECOVER:2010 project. The time interval covered is 151 years:
from 1880, which can be considered as the pre-industrial era in most countries, to 2030, taking into account the consequences of current emission reduction agreements in Europe. The historic and predicted emissions for European countries are used to calculate the deposition development in the study areas, using meteorologically averaged atmospheric source-receptor transfer coefficients derived from the EMEP Lagrangian acid deposition model. These time series were used as driving forces for the application of the dynamic acidification model MAGIC to study the acidification and recovery of sensitive freshwater ecosystems in Europe.
Keywords: acid deposition, historic depositions, sensitive lake regions, Europe
Introduction
The acidification of sensitive ecosystems has been a serious environmental problem in Europe in recent decades and considerable resources have been used to monitor and model system behaviour. To test and improve the performance of acidification models that describe the key (chemical) processes in soils and lakes, measured or otherwise estimated long-term input data are required. Monitoring data for the main driving variables, the acidifying depositions of sulphur and nitrogen species, are generally available only for relatively short periods. Therefore, estimating deposition levels (of the past as well as of scenarios) requires estimates of emissions and a general, representative description of atmospheric processes and transport.
This paper presents a consistent derivation of the long-term development of SO2, NOx and NH3 emissions and the
resulting deposition in Europe over a 151-year period (1880 2030) including a 28-year forecast (20032030).
Anthropogenic emissions of acidic precursors increased from the industrial revolution until the 1970/80s. Since the 1980s, international co-operation to combat the environmental effects of air pollutants has intensified. One major result was the signing of the 1999 Protocol to Abate Acidification, Eutrophication and Ground-level Ozone (UNECE, 1999a) to the Convention on Long-range Transboundary Air Pollution (LRTAP) under the auspices of the United Nations Economic Commission for Europe (UNECE).
Historic sulphur emissions in Europe have been assessed in some detail in earlier studies (Mylona, 1996) whilst, for nitrogen compounds, data have been estimated mainly at more aggregate (global) levels. Existing sulphur and nitrogen emission data, allocated to current European country areas, were used in this study. Emission data from 1960 onward, including future scenarios, were calculated using the RAINS (Regional Acidification and INformation
System) model of IIASA (Alcamo et al., 1990; Amann et
al., 1998). Emission estimates are based on energy and
economic data, which are divided into several economic (activity) sectors and fuel types. Multiplying the sector-fuel-combinations with appropriate emission factors and taking into account existing or planned pollution control efficiencies results in the total country emissions for every year.
The depositions of sulphur, nitrogen oxides and ammonia are calculated in this study using the results from the EMEP Lagrangian acid deposition model (EMEP, 1998), which gives results on a 150 km × 150 km grid over Europe. Country-to-grid atmospheric transfer coefficients were derived by dividing the deposition in grid cells by country emissions and averaging over 12 meteorological years. The approach using one continental model provides estimates of deposition for long-term and large-scale assessments that are consistent (all three pollutants), comprehensive (all Europe) and comparable with observations. The resulting time-patterns can be used as input to site-specific acidification models, calibrated to locally observed deposition levels if required.
Emission modelling
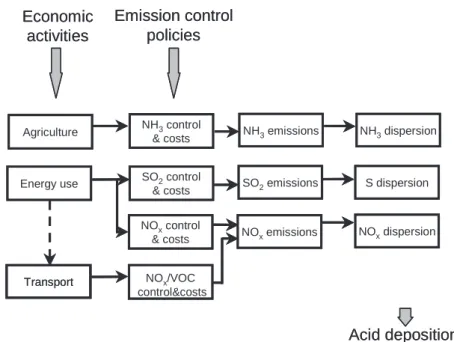
Necessary input data for an atmospheric transport model include historical and regional emission inventories of the acidic precursors SO2, NOx and NH3. The modelling
principle is illustrated in Fig. 1. A country-specific emission factor for each sectors fuel consumption (or activity
parameters for process emissions) is applied to calculate the unabated emission level. Until 1960 emission abatements were not considered, so this simple approach can be used for this period. From 1960 onwards, however, the RAINS model is used to take into account measures to control emissions. For the broad analysis of this study, different levels of detail are necessary for different time periods as the data quality varies. Therefore, three periods are distinguished in this study:
l 18801960: The process of industrialisation has already
taken place and has become the main driving force and the cause for the increase in emissions and deposition. The spatial allocation of air pollution is changing because the industrialisation varies over time in different places. Moreover, the amount of data available is limited and the data are of variable quality. One reason is the changes in the national borders during that period. The quality of the historic data cannot be compared to the quality of todays economic data.
l 19601990: For this period, good documentation of
economic activities can be relied upon. The factors determining emissions can be ascertained: e.g., sulphur content of coal used and NOx emissions of vehicle
engines. In the 1970s the acidifying deposition (of sulphate) was recognised as an environmental problem by scientists and the public. Political processes started and the LRTAP Convention was signed. As a consequence, the first Parties to the Convention started to enforce abatement measures for sulphur.
Acid deposition Economic activities Emission control policies Agriculture NOxemissions SO2emissions Energy use NH3dispersion S dispersion NH3emissions Transport NOxdispersion NH3control & costs NOx/VOC control&costs SO2control & costs NOxcontrol & costs Acid deposition Economic activities Emission control policies Agriculture NOxemissions SO2emissions Energy use NH3dispersion S dispersion NH3emissions Transport NOxdispersion NH3control & costs NOx/VOC control&costs SO2control & costs NOxcontrol & costs
l 19902030: Starting around 1990, strict environmental
legislation forces wide-ranging abatement measures in Europe. Politicians begin to consider nitrogen as a problem. As the effects and sustainability of the abatement strategies are not reflected immediately in emission reductions, it is necessary to extend the trend into the future. For this, a forecast of economic activities is needed. Climate change policies cause a number of structural changes in energy use. Country borders change and the EU enlarges from 10 to 25 Member States.
THE PERIOD 18801960
Trends in historic sulphur emission are based on work of Mylona (1996), who estimated SO2 emissions for each
European country in the period 18801990 with a time step of five years, based on energy and industry statistics. The change of national borders in Europe emerges as a major difficulty for the compilation of historical emission inventories. Thus, emission estimates for years before 1945 often relate to territories different from today, so that the spatial allocation of emissions had to be adjusted accordingly. Using national and international statistics, a careful inspection of data prior to the first and second world wars showed that major territorial changes are reflected in the data used. An assessment of the spatial allocation for the pre-war, inter-war and post-war periods reveals coal combustion as the dominant emission source throughout the years.
Country-specific ammonia emissions for the years 1870, 1920, 1950 and 1980 were compiled by Asman et al. (1988). These emissions are interpolated linearly to obtain annual NH3 emissions for the period 18801960. Data from this
period are further adjusted to ensure a smooth transition to RAINS model results from 1960 onwards.
European emissions of nitrogen oxides for the decades 1930 to 1980 were derived by regression analyses from fuel consumption by Dignon and Hameed (1989). For the period 1860-1930 the same authors provide only global estimates of NOx emissions. From these, European NOx emissions
for the period 18801930 have been inferred by assuming that the European/global emission ratio of 1930 holds also for earlier decades. The allocation to individual European countries is carried out by assuming that the relative proportion of a countrys NOx emissions in the European
total prior to 1960 equals that of 1960. With these simplifying assumptions, annual country-specific NOx
emissions for the period 1880-1960 are obtained by linear interpolation. Again, adjustments are made to fit RAINS emissions from 1960 onwards.
THE PERIOD 19601990
For this period, emissions were calculated with an old version of the RAINS model. A detailed description of the approach followed in RAINS is given in Alcamo et al. (1990). Version 6.1 of RAINS, developed for the negotiations of the 1994 Oslo Protocol, includes the years back to 1960 and allows scenario analyses in 5-year intervals up to 2010. It calculates emissions of SO2, NOx and ammonia
to analyse their acidifying effects.
The RAINS model calculates emissions based on energy and other activity data. The model distinguishes between actual emission levels and a hypothetical level of unabated emissions. For each sector/fuel combination, it applies a country-specific emission factor to the sectors consumption of the fuel (or other activity parameter for process emissions) to calculate the unabated emission level. The difference between the actual and the unabated emission level is determined by measures to control emissions. Data for 1960, 1970, 1975, 1980 and 1985 are extracted from version 6.1 of RAINS. This version of RAINS was calibrated to its base year 1980. No data for 1965 are included, so emission data are interpolated for that year.
Activity data
Both SO2 and NOx emissions originate almost entirely from
energy combustion and consequently the estimation of emissions is based on energy data. The RAINS model follows the sectoral aggregation of the available energy balances (e.g., the energy statistics of UNECE, OECD/IEA, EUROSTAT and DG Energy of the European Commission). Based on the RAINS structure, this study applies a simplified scheme for grouping the most important emission-generating activities into sectors of economic activities. The energy data used in RAINS 6.1 is derived from the UNECE energy database of 1993 (UNECE, 1993).
Abatement policies
The model assumes that uncontrolled emission factors remain constant over time and all changes in emissions per unit of energy in a given sector/fuel combination result by definition from control measures.
For SO2, the RAINS model covers the following five broad
categories of technical control measures: use of low-sulphur fuels, including fuel desulphurisation; in-furnace control of SO2 emissions (e.g. through limestone injection or with
several types of fluidised bed combustion); conventional wet flue gas desulphurisation processes; advanced, high efficiency methods for capturing sulphur from the flue gas
(FGD); measures to control process emissions.
For NOx, the model distinguishes the following groups
of measures: in-furnace control of NOx emissions for
stationary sources, i.e. the so-called combustion modifications (CM) or primary NOx reduction measures;
secondary measures for the treatment of flue gases (selective catalytic reduction (SCR), selective non-catalytic reduction (SNCR)); measures to control process emissions; measures in the transport sector.
Ammonia emissions from livestock occur at four stages, i.e. in the animal house, during storage of manure, its application and during the grazing period. At every stage, emissions can be controlled by applying various techniques: low nitrogen feed (dietary changes); bio-filtration (air purification); animal house adaptation by improved design and construction; covered outdoor storage of manure; low ammonia application techniques; substitution of urea by ammonium nitrate for fertiliser application; stripping and absorption techniques in the chemical industry (e.g. during fertiliser production). Not many countries have applied control measures for ammonia.
THE PERIOD 19902030
Data for this period are taken from the recent and most detailed version of RAINS. This version 7.5 of RAINS is calibrated to its base years 1990 and 2000, so that the reliability of data for these years is, therefore, largest. All data for the years from 2005 onwards are based on projections, as explained below. Again, the year 2010, the target year of the Gothenburg Protocol, has received the most attention, while other years have been modelled based on best available knowledge, but without subsequent refinements or review by national experts.
During this period important political changes took place in Europe. Some of these led to changes in national boundaries. Historic data have been adjusted to reflect current country areas by distributing emissions or energy consumption to the new territorial units and present territorial units were used throughout the period.
A comprehensive description of the RAINS model and its databases is provided in Amann et al. (1998), and is available on the Internet under http://www.iiasa.ac.at/rains. The RAINS model was used for the analytical support of the negotiations under the LRTAP Convention that led to the 1999 Protocol to Abate Acidification, Ground-level Ozone and Eutrophication (UNECE, 1999a).
Activity data
For EU member states and some accession countries (Czech Republic, Estonia, Latvia, Lithuania, Hungary and Poland),
the 1995 energy balances in RAINS 7.5 have been modified according to the information provided by the National Technical University of Athens within the Shared Analysis Project of the European Commission (EC, 1999). That project also provides scenarios for the other accession countries.
Energy projections until 2030 are based on the official energy pathways for most non-EU member states. The data have been submitted by the governments to the UNECE and are published in the UNECE Energy Database (UNECE, 1996).
Agricultural activities are a major source of ammonia emissions; and ammonia through the process of nitrification can, potentially, contribute to the acidification of the environment. Next to specific measures directed at limiting the emissions from livestock farming, the development of the animal stock is an important determinant of future emissions. IIASA has compiled a set of forecasts of European agricultural activities, based on national information (Marttila, 1995; Pipatti, 1996; Henriksson, 1996; Riseth, 1990; Menzi, 1995; Menzi et al., 1997), on studies performed for DG-VI of the Commission of the European Communities (EC DG-VI, 1995) for Eastern Europe, and on Stolwijk (1996), Folmer et al. (1995) for EU countries. The forecast for the EU is based on the ECAM (European Community Agricultural Model) model. Documentation on this forecast can be found in Folmer et
al. (1995). Projections for the republics of the Former Soviet
Union are derived from an OECD study (OECD, 1995).
Current legislation
The CLE (current legislation) scenario starts from a detailed inventory of present regulations on emission controls, taking into account the legislation in the individual European countries, the relevant Directives of the European Union, and the obligatory clauses regarding emission limits from the relevant Protocols to the LRTAP Convention (EEA, 2002).
For stationary sources, the following legislation has been included:
l For parties and signatories of the 1994 Sulphur Protocol (UNECE, 1994), the emission limit values for new plants and the limits on the sulphur content of gas oil for stationary and mobile sources;
l Gothenburg Protocol to Abate Acidification,
Eutrophication and Ground-level Ozone (UNECE, 1999a)
l For EU member states: emission limit values for new
609/EEC), taking into account the proposal for a revision of the LCPD adopted by the Commission on 8. 7. 1998 (COM (98) 415 final) and the limits on the sulphur content of gas oil for stationary and mobile sources and for heavy fuel oil (Directives 98/70/EC and 1999/32/EC);
l National emission standards for stationary sources, if
stricter than the international standards.
For the control of NOx emissions from mobile sources,
the CLE scenario considers the implementation of the current UNECE legislation as well as country-specific standards (if stricter), which are based on EU legislation in most cases. For the Member States of the European Union, as well as Norway and Switzerland, the current EU standards for new cars, light commercial vehicles and heavy duty vehicles (HDV) have been taken into account: the Directives 70/220/EEC as amended by 96/69/EC, and 88/77/EEC as amended by 96/1/EC. Additionally, the scenario takes into account: EU Directive 98/70/EC of 13 October 1998 relating to the quality of petrol and diesel, amending Council Directive 93/12/EEC; and Directive 98/69/EC of 13 October 1998 relating to measures to be taken against air pollution from motor vehicles, amending Council Directive 70/220/ EEC. For heavy-duty vehicles, the post-2005 standards reflect the Common Position reached in December 1998 between the European Parliament and the Council on amending the Directive 88/77/EEC (on the approximation of laws of the Member States relating to the measures to be taken against the emissions of gaseous and particulate pollutants from diesel engines for use in vehicles). The implementation of these standards is assumed in two stages (2005/2006 and 2008/2009).
For ammonia, the CLE scenario considers controls only in the Netherlands and Denmark. These controls will come into force by 2010.
RESULTING EUROPEAN EMISSIONS
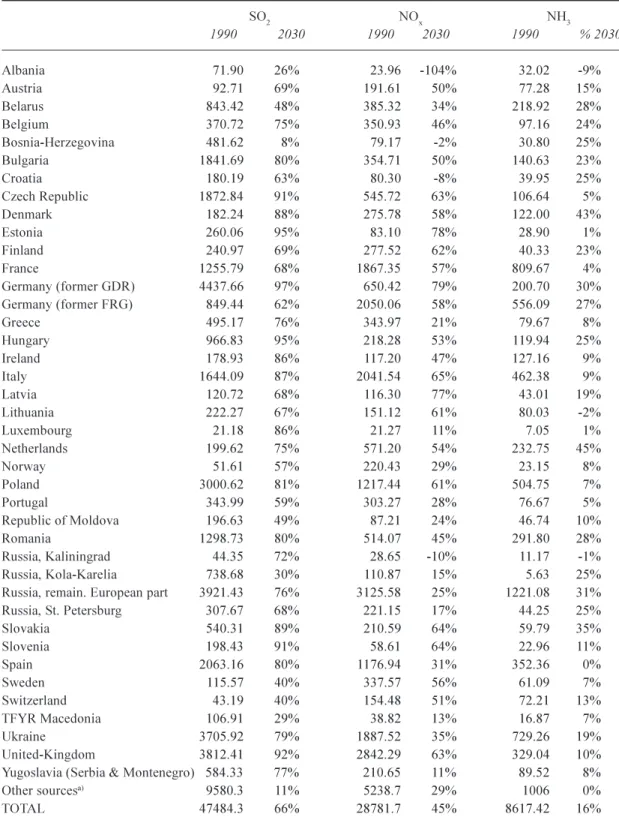
Table 1 shows the reduction of emissions between 1990 and 2030. These are calculated using the RAINS model. To fit RAINS 6 with RAINS 7, some adjustments based on expert knowledge, particularly for estimates of emissions for years before 1990, were made. In some cases, differences between the two RAINS model versions were unreasonably high and adjustments to estimates for years before 1990 are made, using nationally reported emission estimates (UNECE, 1999b) as a benchmark. The national emission ceilings for 2010 are introduced, and these 2010 ceilings are kept for subsequent years in addition to current legislation. The temporal development of European emissions of SO2, NOx
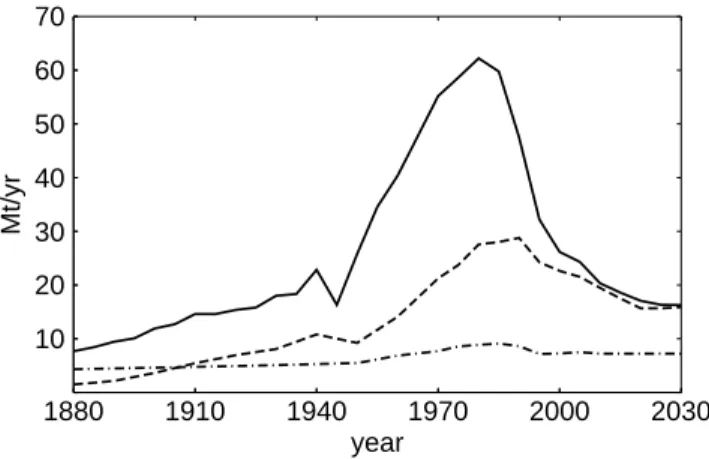
and NH3 is presented in Fig. 2. Note that the decrease in
SO2 and NOx emissions after 2010 is not caused by the
assumption of further measures after that date, but by the fact that some of the measures (technologies) implemented by 2010 take longer to penetrate the market fully.
Deposition Trends
ATMOSPHERIC TRANSPORT AND SOURCE-RECEPTOR MATRICES
For modelling the atmospheric processes and long-range transport of air pollutants, use is made of the results of the EMEP Lagrangian acid deposition model (EMEP, 1998). The data available from EMEP/MSC-W were used to derive country-to-grid atmospheric transfer coefficients by dividing the deposition in grid cells with source area emissions and averaging over the years. Using the results of one continental model enables consistent (all three pollutants), comprehensive (all Europe) and comparable with observations (separate wet and dry fraction) estimates of deposition for long-term and large-scale assessment.
The EMEP model calculates total annual sulphur, nitrogen and ammonium depositions in grid cells of 150 km × 150 km over Europe. The model traces backwards trajectories terminating at each grid cell at six-hourly intervals to describe the history of air parcels arriving at the receptor. The model then distinguishes emissions originating from different countries and simulates the transport, chemical transformation and depletion along each trajectory. The chemistry in the model is simplified. Sulphate and nitrate are produced by chemical oxidation in the atmosphere from emissions of SO2 and NOx and further homogeneous or
heterogeneous nucleation. Ammonium sulphate and ammonium nitrate result from subsequent irreversible
Fig. 2. Temporal development (18802030) of European emissions of
SO2 ( ), NOx (--- ) and NH3 ( ) in Mt yr1 of SO2, NO2 and NH3, respectively. 1880 1910 1940 1970 2000 2030 10 20 30 40 50 60 70 year Mt/yr
Table 1. Emissions (kt) SO2, NOx and NH3 in 1990 and forecasted reduction in percent until 2030
(Note: negative percentages denote an increase).
SO2 NOx NH3 1990 2030 1990 2030 1990 % 2030 Albania 71.90 26% 23.96 -104% 32.02 -9% Austria 92.71 69% 191.61 50% 77.28 15% Belarus 843.42 48% 385.32 34% 218.92 28% Belgium 370.72 75% 350.93 46% 97.16 24% Bosnia-Herzegovina 481.62 8% 79.17 -2% 30.80 25% Bulgaria 1841.69 80% 354.71 50% 140.63 23% Croatia 180.19 63% 80.30 -8% 39.95 25% Czech Republic 1872.84 91% 545.72 63% 106.64 5% Denmark 182.24 88% 275.78 58% 122.00 43% Estonia 260.06 95% 83.10 78% 28.90 1% Finland 240.97 69% 277.52 62% 40.33 23% France 1255.79 68% 1867.35 57% 809.67 4% Germany (former GDR) 4437.66 97% 650.42 79% 200.70 30% Germany (former FRG) 849.44 62% 2050.06 58% 556.09 27% Greece 495.17 76% 343.97 21% 79.67 8% Hungary 966.83 95% 218.28 53% 119.94 25% Ireland 178.93 86% 117.20 47% 127.16 9% Italy 1644.09 87% 2041.54 65% 462.38 9% Latvia 120.72 68% 116.30 77% 43.01 19% Lithuania 222.27 67% 151.12 61% 80.03 -2% Luxembourg 21.18 86% 21.27 11% 7.05 1% Netherlands 199.62 75% 571.20 54% 232.75 45% Norway 51.61 57% 220.43 29% 23.15 8% Poland 3000.62 81% 1217.44 61% 504.75 7% Portugal 343.99 59% 303.27 28% 76.67 5% Republic of Moldova 196.63 49% 87.21 24% 46.74 10% Romania 1298.73 80% 514.07 45% 291.80 28% Russia, Kaliningrad 44.35 72% 28.65 -10% 11.17 -1% Russia, Kola-Karelia 738.68 30% 110.87 15% 5.63 25%
Russia, remain. European part 3921.43 76% 3125.58 25% 1221.08 31% Russia, St. Petersburg 307.67 68% 221.15 17% 44.25 25% Slovakia 540.31 89% 210.59 64% 59.79 35% Slovenia 198.43 91% 58.61 64% 22.96 11% Spain 2063.16 80% 1176.94 31% 352.36 0% Sweden 115.57 40% 337.57 56% 61.09 7% Switzerland 43.19 40% 154.48 51% 72.21 13% TFYR Macedonia 106.91 29% 38.82 13% 16.87 7% Ukraine 3705.92 79% 1887.52 35% 729.26 19% United-Kingdom 3812.41 92% 2842.29 63% 329.04 10%
Yugoslavia (Serbia & Montenegro) 584.33 77% 210.65 11% 89.52 8%
Other sourcesa) 9580.3 11% 5238.7 29% 1006 0%
TOTAL 47484.3 66% 28781.7 45% 8617.42 16%
a)Other sources within the modelling domain are taken from EMEP (2002).
reactions with ammonia. These and other processes are parameterised and the ability of the model to reproduce actual levels in air concentrations and precipitation have
been assessed (Tsyro, 1998). The model describes rural background conditions by assuming complete mixing of emissions, concentrations and depositions in the relatively
large 150 km × 150 km cell. The within-grid cell variability and ecosystem-specific depositions are difficult to assess with these model results.
EMEP/MSC-W made deposition data available for 12 meteorological years (19851996) as well as the related total annual country emissions (EMEP, 1998). The only exception was that, at the time of the model runs, 1996 emission data were unavailable so 1995 data were used instead. The annual grid cell specific deposition due to an emission source (generally a whole country or sea area) was divided by the source area emission. This results in a set of country-to-grid transfer coefficients, often referred to as a transfer matrix, describing the contribution to deposition in every grid cell due to a unit emission of a country.
The annual transfer matrices were averaged for each pollutant over the 12 simulation years available from the EMEP model and kept separate for wet and dry fractions. The average matrix for SO2, NOx and NH3 was then
multiplied with historic and future country emissions to derive deposition levels at each point of time in the 151-year period. The meteorological variability of country-specific average transfer matrices was preliminarily estimated at ±525% (coefficient of variation) for total deposition, being larger for the wet and smaller for the dry fraction. The variability due to the uncertainties in emissions and meteorology has been estimated ±1030% of total deposition in a study employing the same EMEP data (Suutari et al., 2001). An early study, using ten years of deposition simulations with the EMEP model, found the inter-annual variability to be around 10% in European land areas, being largest for sulphur and smallest for ammonium (Barrett et al., 1995). An analysis on the 12-year trends using data from observations and the EMEP model resulted in a fairly good agreement on the model performance (EMEP, 1998).
EMEP/MSC-W has allocated total country emissions to the 150 km × 150 km grid and different emission heights using either officially submitted country data or based on expert judgements, and the same distribution was used also for other years (EMEP, 1998). The within-country spatial allocation of emissions was not a subject of this study, and no direct information was available on its influence on the average source-receptor transfer coefficients. Effects of dynamic gridded emission data were studied for sulphur depositions by EMEP (Mylona, 1996). She generated historical gridded emission data, which had significant impact on the calculated deposition. As the EMEP model has been further developed, results from the study could not be taken on board here.
DEPOSITION PATTERNS IN EUROPEAN LAKE REGIONS
The temporal patterns of the deposition of sulphur and nitrogen compounds due to emissions in Europe were computed by multiplying country emissions for individual years with country-to-grid transfer matrices derived from 12 years (1985-96) of simulations of the EMEP Lagrangian acid deposition modelling results on a 150 km × 150 km grid.
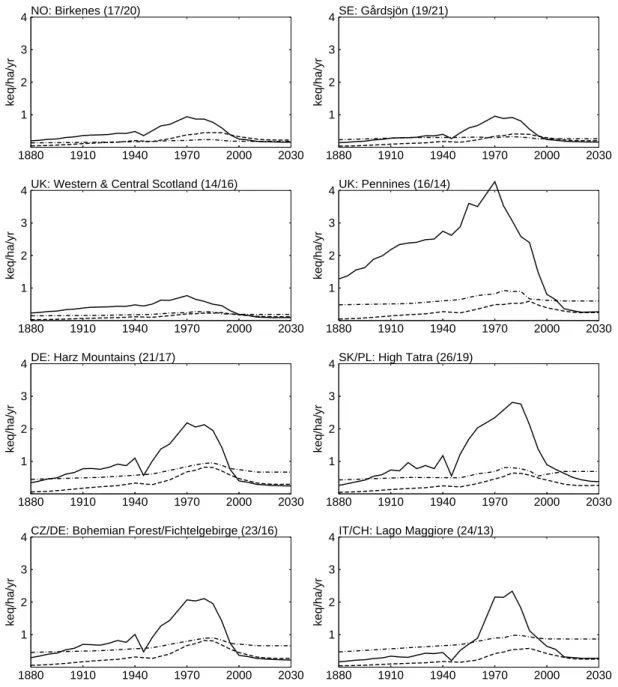
Figure 3 shows the resulting trends in sulphur and nitrogen deposition for the period 18802030 in eight European lake regions: Birkenes (southern Norway), Gårdsjön (south-western Sweden), (south-western and central Scotland, the Pennines (northern England), the Harz mountains (central Germany), the High Tatra mountains (Slovakia/Poland), the Bohemian Forest and Fichtelgebirge (Czech Republic/ Germany), Lago Maggiore (Italian/Swiss Alps). These are almost all the regions covered by the RECOVER 2010 project. In general, all pollutants increased nearly linearly until 1945. Thereafter, sulphur deposition increased to a peak between 1980 and 1995. In this interval, sulphur was the dominant pollutant across Europe. Due to strict abatement policies, sulphur will lose its dominant role in all regions; in future, nitrogen deposition will be of greater importance. Particularly for reduced N deposition, a moderately but steadily increasing path can be observed.
Birkenes (southern Norway):
Birkenes is, in a European context, quite a remote location and deposition of acidifying pollutants is relatively low. But, because the region has one of the most sensitive ecosystems, even this low level of deposition suffices to cause widespread acidification of freshwaters. As most of the nitrogen input is absorbed by the ecosystem, sulphur is largely responsible for this effect. Compared to the peak (about 1 keqha-1yr) in 1970, sulphur deposition has declined
to about one third of this value in 2000, which may not be enough to recover all freshwater systems. According to forecasts, it will be hard to reduce European emissions to a level low enough for this area to recover completely.
Gårdsjön (south-western Sweden):
Like southern Norway, this region receives most of its deposition through long-range transport, and deposition levels are also comparable for most of the period.
Western and Central Scotland:
Fig. 3. Temporal development (18802030) of the deposition of sulphur (solid line), NOx-N (dashed line) and NH3-N (dashed-dotted line) in
eight of the RECOVER:2010 regions (EMEP-150 grid squares). Depositions are in keq ha1yr and all graphs have the same vertical scale to
facilitate comparisons.
Scandinavia. This is also a remote (but sensitive) location like Birkenes and Gårdsjön, and the 1970 peak in sulphur deposition is little more than 1 keq ha1yr.
The Pennines (northern England):
This is the lake region with the highest acid deposition. Other non-lake areas in Europe, exposed to much higher depositions, are not considered in this paper. In this area, sulphur plays the dominant role in acidification. Starting from an already high level in 1880, sulphur deposition
increased steadily to a peak above 4 keq ha1yr. Since 1970,
the UK reduced the use of coal drastically and introduced the same abatement technologies as other European countries. According to the forecast for 2030, sulphur deposition will be reduced to one third of the value of 1880. The models used in this paper deal only with national UK emissions. The spatial distribution of these emissions depends very much on local coal and oil use. Dealing only with national data over the period 19602030 might introduce an error. More historic research would be needed to investigate the influence of this simplification.
1880 1910 1940 1970 2000 2030 1 2 3 4 keq/ha/yr NO: Birkenes (17/20) 1880 1910 1940 1970 2000 2030 1 2 3 4 keq/ha/yr SE: Gårdsjön (19/21) 1880 1910 1940 1970 2000 2030 1 2 3 4 keq/ha/yr
UK: Western & Central Scotland (14/16)
1880 1910 1940 1970 2000 2030 1 2 3 4 keq/ha/yr UK: Pennines (16/14) 1880 1910 1940 1970 2000 2030 1 2 3 4 keq/ha/yr
DE: Harz Mountains (21/17)
1880 1910 1940 1970 2000 2030 1 2 3 4 keq/ha/yr SK/PL: High Tatra (26/19) 1880 1910 1940 1970 2000 2030 1 2 3 4 keq/ha/yr
CZ/DE: Bohemian Forest/Fichtelgebirge (23/16)
1880 1910 1940 1970 2000 2030 1 2 3 4 keq/ha/yr
Harz Mountains (central Germany):
A typical area in central/western Europe with high sulphur depositions between the late 1960s and 1980s, followed by a sharp decline during the 1990s. The present deposition of sulphur has fallen below that of oxidised nitrogen, and the deposition is dominated by ammonia due to the intensive agricultural activity in that grid.
High Tatra (Slovakia/Poland):
Deposition in this area follows the European trend until Word War II. Afterwards, heavy industrial production and a sharp increase in energy consumption primarily based on lignite combustion in East Germany, the Czech Republic and Slovakia caused a sharp increase of sulphur deposition until 1970 followed by a stable period with high deposition. Due to the political and economic transformation of the last decade, a sharp decline to a rather low level of sulphur deposition occurred, and this is expected to remain in the future. The development of oxidised nitrogen follows a similar but much more moderate path, except that the decline in nitrogen is less than that for sulphur. As the region is remote from major arable land, ammonia does not play an important role in this region.
Bohemian Forest/Fichtelgebirge (Czech Republic/ Germany):
This region is equally affected by sulphur and nitrogen deposition. As in the other European regions, sulphur deposition peaks during the period 19701980. The oxidised nitrogen peak in 1980 is more significant than in other parts of Europe. For the period 2000 onward, sulphur and nitrogen oxides will be largely controlled. Ammonia emission from intensive farming in the region will become the important
acidifying driving force. Intensified control on agricultural emissions will be necessary in this region to curb pollution. It should be noted that the S deposition in the grid square to the north-east (23/17) reaches the highest deposition in Europe, almost 8 keq ha1yr in 1980.
Lago Maggiore (Italy/Switzerland):
In the Lago Maggiore region, nitrogen is the most important acidifying pollutant. There is a large share of reduced nitrogen because of the high agricultural activities around Milan and the valley of the river Po. Whereas nitrogen depositions did not show large variations from 1960 to the mid-nineties, there is a peak in sulphur deposition during the 1970s.
INTER-ANNUAL METEOROLOGICAL VARIABILITY OF DEPOSITION
The methodology applied in this paper produces hind- and fore-casts of deposition patterns based on transfer matrices that describe the characteristic dispersion of a unit of emission per region (country) across the modelling domain. In such matrices, a long-term (12 years) average meteorology is assumed. It is well known, however, that wind and precipitation patterns vary from year to year. The effect of this variability is illustrated in Fig. 4. It shows the 90% confidence interval of the S and N deposition due to inter-annual meteorological variability in the EMEP grid (23/16) (Germany) (Suutari et al., 2001). For use in the environmental effects model, this variability should not generate any problems as the environmental impact is caused by long-term exposure; in this way, the variability over years will be compensated. The influence of meteorological variability on sulphur concentrations has also been investigated by Mylona (1997).
Conclusions
This paper presents a reasonable long-term development of acid deposition on a European scale, as required for dynamic acidification and eutrophication models. Integrated assessment models like RAINS provide a framework for extrapolating sulphur and nitrogen emissions beyond existing observations. In particular, model tools and databases are available to address acidification and eutrophication questions.
When using the results, the limitations of the models used in the calculations must be remembered. In particular, the model calculates changes in national emission levels. Due to assumed complete mixing of 150 × 150 km grid cell emissions into the atmosphere, the calculated depositions represent a large-scale average rural background value. The spatial distribution of emissions within each country has been kept constant over long time intervals, as implemented in the EMEP model (EMEP, 2002). This simplification might introduce errors into the trend, if a grid is very much dependent on local sources. This could typically be a problem, e.g. in the Pennines region and more research would be needed to investigate the influence of this simplification. Therefore, application of these depositions to site-specific analysis must be made with caution.
The deposition is calculated with average grid cell specific land cover, which affects dry deposition velocities. This is introducing a large error in the deposition calculations, and ecosystem-specific depositions will be provided as soon as EMEP has incorporated them into the transfer matrix calculation.
The results of the application presented in this paper were input to the RECOVER:2010 project. The aim has been to make these data also available for forthcoming modelling of effects on a European scale. For this to be successful, the present results will have to be updated, to take into account new information on emission control policies in individual countries as well as improvements of the EMEP dispersion model.
Acknowledgement
This work was partially funded by the Commission of the European Communities under the RECOVER:2010 (EVK1-CT-1999-00018) project.
References
Alcamo, J., Shaw, R. and Hordijk, L. (Eds.), 1990. The RAINS Model of Acidification. Kluwer, Dordrecht, The Netherlands.
Amann, M., Bertok, I., Cofala, J., Gyarfas, F., Heyes, C., Klimont, Z., Makowski, M., Schöpp, W. and Shibayev, S., 1998. Cost-effective Control of Acidification and Ground-level Ozone. ISBN 92-828-4346-7, European Communities, Brussels.
Asman, W.A., Drukker, B. and Janssen, A.J., 1988. Modelled historical concentrations and depositions of ammonia and ammonium in Europe. Atmos. Environ., 22, 725735. Barrett, K., Seland, Ø., Foss, A., Mylona, S., Sandnes, H., Styve,
H. and Tarrasón, L., 1995. European transboundary acidifying air pollution, Ten years calculated fields and budgets to the end of the first Sulphur Protocol. EMEP/MSC-W Report 1/95, Norwegian Meteorological Institute, Oslo, Norway. 150pp. Dignon, J. and Hameed, S., 1989. Global emissions of nitrogen
and sulfur oxides from 1860 to 1980. JAPCA, 39, 180186. EC (European Communities), 1999. Energy in Europe: European
Union Energy Outlook to 2020. Special issue - December 1999. Commission of European Communities, Directorate - General for Energy, Brussels.
EC DG VI (European Commission Directorate-General for Agriculture), 1995. Agricultural Situation and Prospects in the Central and Eastern European Countries. EC DG VI Working Document. Brussels.
EEA, 2002. The ShAIR scenario. Towards air and climate change outlooks, integrated assessment methodologies and tools applied to air pollution and greenhouse gases. EEA Topic Report 12/ 2001. European Environment Agency, Copenhagen, Denmark. EMEP, 1998. Transboundary acidifying air pollution in Europe. EMEP/MSC-W Report 1/98, Norwegian Meteorological Institute, Oslo, Norway. 150pp.
EMEP, 2002. Emission data reported to UNECE/EMEP: Quality assurance and trend analysis & Presentation of WebDab. EMEP/ MSC-W NOTE 1/2002, Norwegian Meteorological Institute, Oslo, Norway.
Folmer, C., Keyzer, M.A., Merbis, M.D., Stolwijk, H.J.J. and Veenendaal, P.J.J., 1995. The Common Agricultural Policy beyond the MacSharry Reform. North-Holland, Contributions to Economic Analysis: 230. Elsevier Science, Amsterdam. Henriksson, M., 1996. Personal communication. Swedish
Environmental Protection Agency, Stockholm, Sweden. IEA (International Energy Agency), 1997. Energy statistics and
Balances of the OECD Countries 1994 - 4995. OECD Paris, France.
Marttila, J., 1995. Personal communication. Agricultural Economics Research Institute (MTTL), Helsinki, Finland. Menzi, H., 1995. Personal communication. Swiss Federal
Research Station for Agricultural Chemistry and Hygiene of Environment. Liebefeld-Bern, Switzerland. October 1995. Menzi, H., Frick, R. and Kaufmann, R., 1997.
Ammoniak-Emissionen in der Schweiz: Ausmass und technische Beurteilung des Reduktionspotentials. Schriftenreihe der FAL 26. Eidgenössiche Forschungsanstalt für Agrarökologie und Landbau, Zürich-Reckenholz, Institut für Umweltschutz und Landwirtschaft, Liebefeld-Bern, Switzerland.
Mylona, S., 1996. Sulphur dioxide emissions in Europe 1880-1991 and their effect on sulphur concentrations and depositions. Tellus, 48B, 662-689; and corrigendum, Tellus, 49B, 447448. Mylona, S., 1997. Historical development of airborne sulphur climate in Europe. Ph.D. thesis, University of Oslo, Institute of Geophysics, Norway. 84pp.
OECD (Organisation for Economic Co-operation and Development), 1995. Agricultural Policies, Markets and Trade in the Central and Eastern European Countries, Selected New Independent States, Mongolia and China - Monitoring and Outlook 1995. OECD, Paris.
Pipatti, R., 1996. Personal communication. VTT Energy, Energy and Power Systems, Espoo, Finland.
Riseth, O., 1990. Personal communication. Norsk Institutt for Landbruksøkonomisk Forskning (NILF), Oslo, Norway. October 1990.
Stolwijk, H., 1996. Personal communication. Central Planning Bureau, Den Haag, The Netherlands.
Suutari, R., Amann, M., Cofala, J., Klimont, Z., Posch, M., Schöpp, W., 2001. CIAM/CCE. From economic activities to critical load exceedances in Europe, an uncertainty analysis of two scenarios of the RAINS integrated assessment model. CIAM/ CCE Report 1/2001, International Institute for Applied Systems Analysis, Laxenburg, Austria. 57pp.
Tsyro, S., 1998. 12-year acidification trends over Europe with the Lagrangian model: quality assessment. In: EMEP, 1998, op.cit., 81102.
UNECE, 1993. Energy Balances for Europe and North America. United Nations Economic Commission for Europe, Geneva, Switzerland.
UNECE, 1994. Protocol to the 1979 Convention on Long-range Transboundary Air Pollution on Further Reduction of Sulphur Emissions, ECE/EB.AIR/40, United Nations Economic Commission for Europe, Geneva, Switzerland.
UNECE, 1996. Energy Balances for Europe and North America 1992, 1993-2010. United Nations Economic Commission for Europe, Geneva, Switzerland.
UNECE, 1999a. Protocol to the 1979 Convention on Long-range Transboundary Air Pollution to Abate Acidification, Eutrophication, and Ground-level Ozone. United Nations Economic Commission for Europe, Geneva, Switzerland. UNECE, 1999b. Strategies and Policies for Air Pollution
Abatement. Economic Commission for Europe (ECE.EB.AIR/ 65), Convention on Long-range Transboundary Air Pollution. United Nations, New York and Geneva.