HAL Id: hal-00301721
https://hal.archives-ouvertes.fr/hal-00301721
Submitted on 23 Aug 2005HAL is a multi-disciplinary open access
archive for the deposit and dissemination of sci-entific research documents, whether they are pub-lished or not. The documents may come from teaching and research institutions in France or abroad, or from public or private research centers.
L’archive ouverte pluridisciplinaire HAL, est destinée au dépôt et à la diffusion de documents scientifiques de niveau recherche, publiés ou non, émanant des établissements d’enseignement et de recherche français ou étrangers, des laboratoires publics ou privés.
Optical properties of humic-like substances (HULIS) in
biomass-burning aerosols
A. Hoffer, A. Gelencsér, P. Guyon, G. Kiss, O. Schmid, G. Frank, P. Artaxo,
M. O. Andreae
To cite this version:
A. Hoffer, A. Gelencsér, P. Guyon, G. Kiss, O. Schmid, et al.. Optical properties of humic-like substances (HULIS) in biomass-burning aerosols. Atmospheric Chemistry and Physics Discussions, European Geosciences Union, 2005, 5 (4), pp.7341-7360. �hal-00301721�
ACPD
5, 7341–7360, 2005 Optical properties of humic-like substances A. Hoffer et al. Title Page Abstract Introduction Conclusions References Tables Figures J I J I Back CloseFull Screen / Esc
Print Version Interactive Discussion
EGU Atmos. Chem. Phys. Discuss., 5, 7341–7360, 2005
www.atmos-chem-phys.org/acpd/5/7341/ SRef-ID: 1680-7375/acpd/2005-5-7341 European Geosciences Union
Atmospheric Chemistry and Physics Discussions
Optical properties of humic-like
substances (HULIS) in biomass-burning
aerosols
A. Hoffer1, A. Gelencs ´er2, P. Guyon1, G. Kiss2, O. Schmid1, G. Frank1, P. Artaxo3, and M. O. Andreae1
1
Max Planck Institute for Chemistry, Department of Biogeochemistry, Mainz, Germany
2
Air Chemistry Group of the Hungarian Academy of Sciences, Veszpr ´em, Hungary
3
Instituto de Fisica, Universidade de Sao Paulo, Sao Paulo, Brazil
Received: 1 July 2005 – Accepted: 28 July 2005 – Published: 23 August 2005 Correspondence to: A. Hoffer ([email protected])
ACPD
5, 7341–7360, 2005 Optical properties of humic-like substances A. Hoffer et al. Title Page Abstract Introduction Conclusions References Tables Figures J I J I Back CloseFull Screen / Esc
Print Version Interactive Discussion
EGU
Abstract
We present here the optical properties of humic-like substances (HULIS) isolated from the fine fraction of biomass burning aerosol collected in the Amazon basin during the LBA-SMOCC (Large scale Biosphere atmosphere experiment in Amazonia – SMOke aerosols, Clouds, rainfall and Climate) experiment in September 2002. From the
iso-5
lated HULIS, aerosol particles were generated and their scattering and absorption co-efficients measured. The size distribution and mass of the particles were also recorded. The value of the index of refraction was derived from “closure” calculations based on particle size, scattering and absorption measurements. On average, the complex index of refraction at 532 nm of HULIS collected during day and nighttime was 1.65–0.00187i
10
and 1.69–0.00163i, respectively. In addition, the imaginary part of the complex index of refraction was calculated using the measured absorption coefficient of the bulk HULIS. The mass absorption coefficient of the HULIS was found to be quite low at 532 nm (0.031 and 0.029 m2g−1 for the day and night samples, respectively). However, due to the high ˚Angstr ¨om exponent of HULIS (6–7) the specific absorption increases
15
substantially towards shorter wavelengths (∼2–3 m2g−1at 300 nm), causing a relatively high (up to 50%) contribution to the absorption at this wavelength. For the relative contribution of HULIS to light absorption in the entire solar spectrum, lower values (6.4–8.6%) are obtained, but those are still not negligible.
1. Introduction
20
During large-scale biomass burning events, vast amounts of aerosol are emitted di-rectly into the atmosphere. The carbonaceous components of this aerosol are of ut-most importance, since they make the dominant part of the particulate mass (PM) (Ar-taxo et al., 2002; Decesari et al., 2005). These aerosols scatter and absorb the incident light affecting the energy transfer through the atmosphere, and thereby the Earth’s
en-25
ACPD
5, 7341–7360, 2005 Optical properties of humic-like substances A. Hoffer et al. Title Page Abstract Introduction Conclusions References Tables Figures J I J I Back CloseFull Screen / Esc
Print Version Interactive Discussion
EGU black carbon (BC) can be formed. Generally higher amounts of BC are emitted from
flaming fires than from smoldering fires. Beside the soot (or BC), high amounts of car-bonaceous compounds (including brown carbon or HULIS) can be found in the aerosol from biomass burning. Since HULIS are known to absorb light in the UV and visible range (Havers, 1998), the study of the absorption properties of this fraction is
partic-5
ularly important. We have some information about the absorption characteristics of the HULIS measured in continental urban and background aerosols (Havers, 1998), but their importance in the radiation transfer and their index of refraction, which is a fundamental parameter, are not very well known. Recently Kirchstetter et al. (2004) reported the optical parameters of the organic carbon from biomass burning aerosol
10
using a filter-based method.
Since the specific absorption cross section of BC is the highest among the carbona-ceous constituents of the aerosols, its contribution to the atmospheric absorption by aerosols is considerable. The brown carbon (including HULIS) is expected to be a weaker absorber, however, due to its higher abundance, its contribution to the
absorp-15
tion may also be important. In this study we present experimentally determined optical properties of humic-like substances isolated from biomass burning aerosol.
2. Method
2.1. Sampling, collection and preparation
The samples were collected at a tropical pasture site in Rond ˆonia, Brazil, during the
20
LBA-SMOCC campaign in September 2002, which corresponds to the most active biomass burning period in this region. Information about the sampling site can be found elsewhere (Andreae et al., 2002). Sampling was performed with a dichotomous virtual impactor (Solomon et al., 1983) mounted on a 10 m high tower. The samples were collected on Pallflex quartz filters, preheated at 600◦C for at least 10 h. The air was
25
ACPD
5, 7341–7360, 2005 Optical properties of humic-like substances A. Hoffer et al. Title Page Abstract Introduction Conclusions References Tables Figures J I J I Back CloseFull Screen / Esc
Print Version Interactive Discussion
EGU in order to separate fine and coarse particles, respectively, with a 50% aerodynamic
diameter (Dp) cutpoint of 2.5 µm (Solomon et al., 1983). Aerosols were collected separately during day and night, so that each filter corresponds to either daytime or nighttime aerosol to allow some investigation of diel effects. The typical sampling time for a given filter was about 10 h during daytime and about 12 h during nighttime.
5
The HULIS were isolated with the one-step procedure described by Varga et al. (2001) from the filters containing the fine fraction of the aerosol (Dp<2.5 µm). First,
the water-soluble aerosol components were extracted by placing the filters for 24 h in MilliQ water. Then the extract was filtered through a Millipore membrane filter of 0.45 µm pore size and the pH was adjusted to pH=2 with hydrochloric acid. The
sep-10
aration of HULIS from other dissolved components was performed on an Oasis HLB (1 g) column conditioned with methanol and activated with hydrochloric acid prior to the application of the samples. The HULIS fraction was then eluted with methanol and dried at room temperature. In order to have sufficient HULIS mass for subsequent measurements, all day and night sample extracts were combined into one daytime and
15
nighttime sample, respectively.
2.2. Measurement setup and procedure
Figure 1 shows the measurement setup for determination of the optical parameters of the isolated HULIS. For particle generation by a TSI 3076 atomizer, the HULIS extract was redissolved in acetonitrile (∼0.3 g/l) containing 7% MilliQ water to ensure
com-20
plete dissolution. Then the particles were dried (RH∼26%) and diluted by mixing the atomizer output flow with dry, filtered air. Subsequently, the aerosol was neutralized by a bipolar charger (65Ni) and passed through an impactor (1 µm cutoff diameter) as required for measuring the size distribution of submicron particles with a scanning mobility particle sizer (SMPS). Here we used a Grimm SMPS (Model 5.400). The
gen-25
erated HULIS particles were predominantly in the size range between 50 and 100 nm. For this size range, the performance deterioration of the SMPS due to particle diffusion is negligible and the sizing accuracy is about 3% (Kinney et al., 1991). For spherical
ACPD
5, 7341–7360, 2005 Optical properties of humic-like substances A. Hoffer et al. Title Page Abstract Introduction Conclusions References Tables Figures J I J I Back CloseFull Screen / Esc
Print Version Interactive Discussion
EGU particles, the uncertainty in particle number concentration is about 10% mainly due to
the relatively large uncertainties in particle charge distribution.
The particulate mass was recorded by a Tapered Element Oscillating Microbalance (TEOM, Rupprecht and Patashnick, Model 1400a), which was operated at a filter tem-perature of 30◦C. We estimate the experimental uncertainty of the TEOM as few
per-5
cent.
The scattering coefficient was measured at a wavelength of 545 nm by an integrating nephelometer (Radiance Research, Model: M903) with an integrated temperature and
RH sensor. Since this device is non-destructive and has negligible loss of submicron
particles (less than 3%), it was operated upstream of the other aerosol devices. The
10
nephelometer was calibrated with CO2(Anderson and Ogren, 1998) and the systematic error due to angular truncation of the viewing volume in the near forward (0 to 9◦) and backward directions (170 to 180◦) were corrected based on Mie calculations. The ab-sorption coefficient was determined at 532 nm by a photoacoustic spectrometer (PAS). Since the operating wavelengths of the PAS and nephelometer are very close to each
15
other (within 13 nm), we neglected the wavelength dependence of the measured pa-rameters within the 13 nm range, therefore we referred our measurements to 532 nm. The uncertainty of the absorption coefficient measured by the PAS is 5%. This was confirmed by calibration with NO2 gas (Arnott et al., 2000) and for soot and biomass burning aerosol by comparison with an optical extinction instrument (Schnaiter et al.,
20
2005).
The experiments were carried out at RH∼26%. One should recall that the isolated HULIS was redissolved in an acetonitrile-water mixture of 13:1. It is critical to make sure that all solvents volatilize from the particles under these conditions. Therefore, we checked whether the particles were indeed dry in the measurement unit by measuring
25
the size distribution of the generated HULIS particles with and without drying the sheath air in the SMPS system. The calculated values of the densities were basically the same. If the particles had contained solvents, which would have been lost in the dry sheath air, the densities of the particles would have had to be different. Furthermore,
ACPD
5, 7341–7360, 2005 Optical properties of humic-like substances A. Hoffer et al. Title Page Abstract Introduction Conclusions References Tables Figures J I J I Back CloseFull Screen / Esc
Print Version Interactive Discussion
EGU according to our best knowledge, acetonitrile and water does not make an azeotropic
mixture, which would affect the drying process.
In addition to these on-line experiments, the absorption spectra of aqueous HULIS solutions were recorded by a Shimadzu UV-160A spectrophotometer from 300 to 700 nm in a 4 cm cell against water.
5
2.3. Calculation of refractive index
The complex index of refraction is derived from Mie “closure” calculations based on par-ticle size, scattering and absorption measurements. The Mie code used was a modified version of that described by Guyon et al. (2003). Using the measured particle size dis-tribution, the Mie code first takes the refractive index of water (1.33–0i) and calculates
10
the corresponding scattering and absorption coefficients. These values are then com-pared to the observed scattering and absorption coefficients and the imaginary and real part of the refractive index are then increased stepwise until the calculated and measured optical coefficients agree to within 0.5%. The only noteworthy difference to the original code described by Guyon et al. (2003) is that in the present study the size
15
distribution is fixed (determined by the SMPS) and does not need to be re-adjusted with refractive index as required for the optically determined size distribution used by Guyon et al. (2003).
In order to obtain information about the morphology of the generated aerosol, we collected particles on gold coated Nuclepore filters for SEM analysis. As shown in
20
Fig. 2, the particles are indeed spherical and thus the application of the Mie code is justified.
ACPD
5, 7341–7360, 2005 Optical properties of humic-like substances A. Hoffer et al. Title Page Abstract Introduction Conclusions References Tables Figures J I J I Back CloseFull Screen / Esc
Print Version Interactive Discussion
EGU
3. Results
3.1. Absorption properties of HULIS
Table 1 summarizes the experimentally determined optical and physical properties of the HULIS isolated from pyrogenic fine aerosol. It can be seen from these data that there is no diel variation in either the real or the imaginary part of the refractive index
5
of the HULIS.
In the literature the imaginary part of the refractive index of BC was found to vary from −0.45 to −1 (Reid et al., 2005 and references therein). However, it is important to note that for biomass burning aerosol a significantly lower imaginary part is obtained than for pure BC, indicating that soot represents only a minor fraction relative to
or-10
ganic compounds in pyrogenic aerosol. Recently, Guyon et al. (2003) reported values of 1.41–0.013i and 1.46–0.016i for the complex refractive index for ambient aerosols affected by biomass burning. Based on field measurements, D. Chand (personal com-munication, 2005) obtained 1.47–1.53 for the real part and 0.01–0.02i for the imaginary part of the refractive index of the very same dry biomass burning aerosol that we used
15
for our experiments. It should be kept in mind that their values refer to the entire fine aerosol including its black carbon fraction, whereas our data refer only to the HULIS fraction, a specific subset, which contains most of the light-absorbing organic com-pounds (Havers, 1998).
For one nighttime sample we also measured the spectrally resolved imaginary part
20
of the index of refraction of the HULIS with a spectrophotometric method. We recorded the absorption spectra of the HULIS redissolved in water in a 4-cm cell, in order to minimize the contribution of baseline instabilities to the measurements at 532 nm. Con-sidering the HULIS solution as a bulk material the index of refraction can be calculated using the equation (Bohren and Huffman, 1983; Gelencs´er, 2004): −Im(m)=αλ/4π
25
where α is the absorption coefficient (m−1) and λ is the wavelength (m). Assum-ing that the index of refraction is volume additive and the bulk density of HULIS is 1.5 g cm−3, the imaginary part of the index of refraction at 532 nm was calculated to be
ACPD
5, 7341–7360, 2005 Optical properties of humic-like substances A. Hoffer et al. Title Page Abstract Introduction Conclusions References Tables Figures J I J I Back CloseFull Screen / Esc
Print Version Interactive Discussion
EGU −0.00184±0.0002 in the concentration range of 2.37×10⁻²and 7.11×10⁻³g l−1HULIS.
In order to validate our on-line method described in Fig. 1, we calculated the scatter-ing coefficient of pure, dry ammonium sulfate for the measured size distribution (using the index of refraction given in the literature) and compared with the measured scatter-ing coefficient. We have found good agreement between the calculated and measured
5
values (<10% difference). Furthermore we measured the index of refraction for water-soluble nigrosin (Aldrich) both with our spectrophotometric (imaginary part only) and on-line method. The difference in the real part of the refractive index between the on-line and literature value was about 4%. With the spectrophotometric method we obtained almost the same imaginary part (−0.255) reported in the literature (−0.26)
10
by Pinnick and Auvermann (1979). But the imaginary refractive index of nigrosin mea-sured with the on-line method (−0.1795) was different from that measured in aqueous solution. One explanation for this discrepancy might be some water uptake by the nigrosin particles (Pinnick, personal communication).
Since there were no diel variations in the imaginary part of the refractive index of
15
HULIS particles, it is obvious that the same holds for the calculated mass absorption coefficients. Its value is low at 532 nm, at least relative to those of BC reported in the lit-erature (e.g. Fuller et al., 1999). One should recall, however, that the mass absorption coefficient obtained for biomass burning fine aerosol is not high either (compared to that of the BC), the average value being 0.37 m2g−1 at 532 nm (Chand et al., 2005).
Sec-20
ondly, the mass absorption coefficient of the HULIS increases sharply towards shorter wavelengths as indicated in Fig. 3 based on the spectrophotometric measurements.
In our experiments, the maximum of the number size distribution of the particles was at about 50–100 nm (diameter). Since for slightly absorbing particles the mass absorption coefficient is independent of particle size below 100 nm, increases by a
25
factor of ∼2 in the range between 100 and 500 nm, and just slightly decreases again for 1–2 µm particles (at a wavelength of 550 nm) (Horvath, 1993; Bohren and Huffman, 1983), our value may also be applied as a lower limit for absorbing organic aerosol (HULIS) present in ambient fine aerosol.
ACPD
5, 7341–7360, 2005 Optical properties of humic-like substances A. Hoffer et al. Title Page Abstract Introduction Conclusions References Tables Figures J I J I Back CloseFull Screen / Esc
Print Version Interactive Discussion
EGU The relatively high value of the mass scattering coefficients imply that HULIS
effi-ciently scatter light in the visible range. The high value of the single scattering albedo obtained in our measurements (0.98) confirms this finding. Contrary to the absorption properties, the scattering properties seem to be different in HULIS isolated from day and night aerosol samples. It is known that HULIS may both be a primary aerosol
com-5
ponent and be produced in photochemical processes, and the properties of these two components may well be different. The average mass scattering coefficient of biomass burning aerosol from the same sampling site in 2002 September was reported to be 5.3 m2g−1(Chand et al., 2005). Note that the density of the HULIS particles, an impor-tant parameter in calculations dealing with the role of HULIS in cloud formation, does
10
not show diel variation.
3.2. Contribution of HULIS to light absorption in the visible range
Figure 3 shows the absorption spectra of HULIS isolated from day and night aerosol samples. Fitting power-law functions to the measured spectra reveals that the
˚
Angstr ¨om exponents are similar, and that in both cases the absorption is
overesti-15
mated by the power-law relationship below about 350 nm. The ˚Angstr ¨om exponent ( ˚a) can be calculated for any range using the following equation (Reid et al, 2005):
˚aλ
1,λ2 = − ln(A1/A2)/ ln(λ1/λ2),
where A1 and A2 are the absorbances measured at wavelengths λ1 and λ2, respec-tively. Using this equation we obtain 6.4 and 6.8 for the ˚Angstr ¨om exponents of HULIS
20
in day and night samples, respectively, in the wavelength range of 300–700 nm. Since ˚a has a marked influence on the calculated absorption properties at shorter wavelengths, in our calculations we used two extreme values: 6 and 7. Important to note that Kirch-stetter et al. (2004) obtained similar results (5.9) for the acetone soluble organic carbon in the range between 350 and 650 nm.
25
In this section the relative contribution of HULIS to light absorption in the visible will be estimated for typical conditions observed in the biomass burning period in Rond ˆonia
ACPD
5, 7341–7360, 2005 Optical properties of humic-like substances A. Hoffer et al. Title Page Abstract Introduction Conclusions References Tables Figures J I J I Back CloseFull Screen / Esc
Print Version Interactive Discussion
EGU during the SMOCC campaign. For the calculations, the absorption parameters of
HULIS isolated from daytime samples are used. Based on our measurements, the absorption coefficient of HULIS is 0.031 m2g−1 at 532 nm (see Table 1). Using the power-law relationship, the mass absorption coefficient of HULIS can be estimated for any wavelength. Since there is enhanced wavelength dependence in aerosol phase
5
compared to the bulk phase (infinite large diameter), our results can be considered as a lower bound (Bond, 2001). According to our preliminary measurements we as-sumed a 1.9 organic mass-to-carbon ratio for HULIS in order to calculate the HULIS-contribution to the absorption on a carbon mass basis. The same mass-to-carbon ratio was found for the same fraction of the WSOC from a rural site (Kiss et al., 2002). We
10
also assumed that the mass-to-carbon ratio of BC equals to 1.
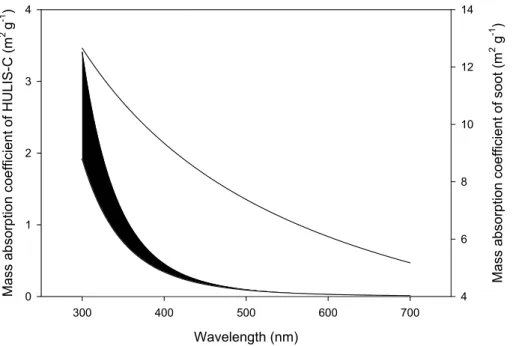
Figure 4 shows the wavelength-dependence of the mass absorption coefficient of BC and that of the HULIS between 300 and 700 nm, using lower and upper estimates of the ˚Angstr ¨om exponents of 6 and 7 as realistic lower and upper bounds, respectively. The mass absorption coefficient of soot was taken from the literature using the data
15
reported by (Schnaiter et al., 2003). We used the value of 1.056 derived from the data in this article for the ˚Angstr ¨om exponent of the diesel soot. We assumed that the average fine TC concentration during the biomass-burning dominated part of the LBA-SMOCC campaign is 47.6 µg m−3 (Hoffer et al., 2005), and that 10% of the TC is BC with the same optical properties as the soot reported by Schnaiter et al. (2003).
20
Furthermore, based on our preliminary chemical analysis of biomass burning aerosols from the LBA-SMOCC campaign we assumed that 35% by mass of TC represents the HULIS carbon fraction. The relative contribution of HULIS-carbon to the absorption can now be calculated using the mass absorption coefficients and the mass concentrations of soot and HULIS.
25
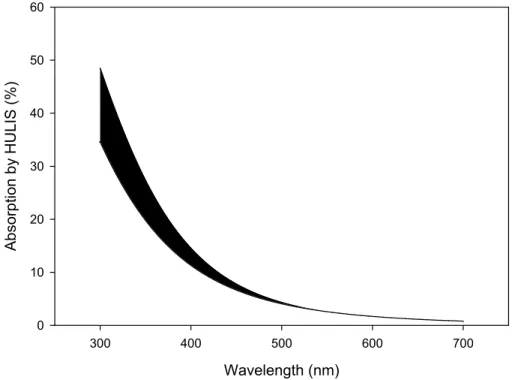
As we can see from Fig. 5, the contribution of HULIS to light absorption is only a few percent at 532 nm and continuously decreases towards longer wavelengths, but near the photochemically most active range, the absorption of organic compounds becomes significant relative to that of BC. For instance, at 300 nm, 35–50% of absorption may
ACPD
5, 7341–7360, 2005 Optical properties of humic-like substances A. Hoffer et al. Title Page Abstract Introduction Conclusions References Tables Figures J I J I Back CloseFull Screen / Esc
Print Version Interactive Discussion
EGU be attributed to HULIS. It should be noted that HULIS may be formed in photochemical
reactions (Gelencs ´er et al., 2003; Hoffer et al., 2005), and since light-absorbing HULIS may also initiate the formation of OH and HO2radicals (Anastasio et al., 1994) a posi-tive feedback mechanism is set up which could make the process particularly effective in the troposphere.
5
When integrating the contribution of HULIS to light absorption across the solar spec-trum to asses their significance for the atmospheric radiation budget, lower total contri-butions are obtained. For a scale height of 3000 m, assuming the same concentrations and composition of biomass burning aerosol as before, the fraction of solar energy (between 300 and 700 nm) absorbed by organic compounds (HULIS) is 8.5 and 11.5%
10
for ˚a=6 and 7, respectively. In the 300–1200 nm range, the corresponding values are 6.4 and 8.6%. It is noteworthy that, even if we take 4 as the most conservative esti-mate of the ˚Angstr ¨om exponent of the HULIS, the contribution to the absorption is still about 5% in the visible range, and about 3.9% in entire tropospherically relevant solar spectrum (300–1200 nm).
15
4. Conclusions
The absorption properties of the humic-like substances (HULIS) isolated from biomass burning aerosols were similar in day and nighttime samples. While the single scatter-ing albedo of pure HULIS particles of about 50–100 nm diameter is high, about 0.98 at 532 nm, they still absorb light rather effectively in the UV and visible range. Hence,
20
due to this strong spectral dependence of light absorption by HULIS and due to the el-evated amount of HULIS in biomass burning aerosol, a significant fraction of the light is absorbed by HULIS at shorter wavelengths. For instance, during the biomass burning period in the LBA-SMOCC campaign, up to 50% of the light absorption (at 300 nm) by aerosols in our study region in the Amazon basin is caused by (water-soluble) HULIS.
25
Since the intensity maximum of the tropospherically relevant solar spectrum is at higher wavelengths, however, the contribution of the HULIS to the absorption over the entire
ACPD
5, 7341–7360, 2005 Optical properties of humic-like substances A. Hoffer et al. Title Page Abstract Introduction Conclusions References Tables Figures J I J I Back CloseFull Screen / Esc
Print Version Interactive Discussion
EGU spectrum is about 7%. Consequently the humic-like substances could have an active
role in the radiative transfer and in photochemical processes. The absorption of HULIS in the UV range can contribute to the up to now unaccounted fraction of the absorption observed in the troposphere.
Acknowledgements. This work was carried out within the frame work of the Smoke, Aerosols,
5
Clouds, Rainfall, and Climate (SMOCC) project, a European contribution to the Large-Scale Biosphere-Atmosphere Experiment in Amazonia (LBA). The authors gratefully acknowledge financial support by the European Commission (contract No. EVK2-CT-2001-00110 SMOCC) and by the Max Planck Society. We are thankful to all members of the SMOCC and LBA-RACCI Science Teams for their support during the field campaign, in particular J. von Jouanne
10
and A. Camargo for their support in setting up the sampling location. We are thankful to the Hungarian Science Foundation (OTKA T/F043578) for its financial support and to Katalin Gall ´o-B ´ekefi for the preparation of the HULIS samples. We are thankful to J. Huth and P. Gwaze for the SEM images.
References
15
Anastasio, C., Faust, B. C., and Allen, J. M.: Aqueous-Phase Photochemical Formation of Hydrogen-Peroxide in Authentic Cloud Waters, J. Geophys. Res.-Atmos., 99, 8231–8248, 1994.
Anderson, T. L. and Ogren, J. A.: Determining aerosol radiative properties using the TSI 3563 integrating nephelometer, Aerosol Sci. Technol., 29, 57–69, 1998.
20
Andreae, M. O., Artaxo, P., Brandao, C., Carswell, F. E., Ciccioli, P., da Costa, A. L., Culf, A. D., Esteves, J. L., Gash, J. H. C., Grace, J., Kabat, P., Lelieveld, J., Malhi, Y., Manzi, A. O., Meixner, F. X., Nobre, A. D., Nobre, C., Ruivo, M., Silva-Dias, M. A., Stefani, P., Valentini, R., von Jouanne, J., and Waterloo, M. J.: Biogeochemical cycling of carbon, water, energy, trace gases, and aerosols in Amazonia: The LBA-EUSTACH experiments, J. Geophys.
Res.-25
Atmos., 107, 8066, doi:10.1029/2001JD000524, 2002.
Arnott, W. P., Moosm ¨uller, H., and Walker, J. W.: Nitrogen dioxide and kerosene-flame soot calibration of photoacoustic instruments for measurement of light absorption by aerosols, Rev. Sci. Instrum., 71, 4545–4552, 2000.
ACPD
5, 7341–7360, 2005 Optical properties of humic-like substances A. Hoffer et al. Title Page Abstract Introduction Conclusions References Tables Figures J I J I Back CloseFull Screen / Esc
Print Version Interactive Discussion
EGU Artaxo, P., Martins, J. V., Yamasoe, M. A., Procopio, A. S., Pauliquevis, T. M., Andreae, M. O.,
Guyon, P., Gatti, L. V., and Leal, A. M. C.: Physical and chemical properties of aerosols in the wet and dry seasons in Rondonia, Amazonia, J. Geophys. Res.-Atmos., 107, NO. D20, 8081, doi:10.1029/2001JD000666, 2002.
Bohren C. F. and Huffman D. R.: Absorption an Scattering of Light by Small Particles, Wiley
5
Interscience, New York, 1983.
Bond, T. C.: Spectral dependence of visible light absorption by carbonaceous particles emitted from coal combustion, Geophys. Res. Lett., 28, 4075–4078, 2001.
Chand, D., Guyon, P., Artaxo, P., Schmid, O., Frank, G. P., Rizzo, L. V., Mayol-Bracero, O. L., Gatti, L. V., and Andreae, M. O.: Optical and physical properties of aerosols in the boundary
10
layer and free troposphere over the Amazon Basin during the biomass burning season, At-mos. Chem. Phys. Discuss., 4, 4373–4406, 2005,
SRef-ID: 1680-7375/acpd/2005-5-4373.
Decesari, S., Fuzzi, S., Facchini, M. C., Mircea, M., Emblico, L., Cavalli, F., Maenhaut, W., Chi, X., Schkolnik, G., Falkovich, A., Rudich, Y., Claeys, M., Pashynska, V., Vas, G., Kourtchev,
15
I., Vermeylen, R., Hoffer, A., Andreae, M. O., Tagliavini, E., Moretti, F., and Artaxo P.: Char-acterization of the organic composition of aerosols from Rond ˆonia, Brazil, during the LBA-SMOCC 2002 experiment and its representation through model compounds, Atmos. Chem. Phys. Discuss., 4, 5687–5749, 2005,
SRef-ID: 1680-7375/acpd/2005-5-5687.
20
Fuller, K. A., Malm, W. C., and Kreidenweis, S. M.: Effects of mixing on extinction by carbona-ceous particles, J. Geophys. Res.-Atmos., 104, 15 941–15 954, 1999.
Gelencs ´er, A., Hoffer, A., Kiss, G., Tomb´acz, E., Kurdi, R., and Bencze, L.: In-situ formation of light-absorbing organic matter in cloud water, J. Atmos. Chem., 45, 25–33, 2003.
Gelencs ´er, A.: Carbonaceous Aerosol. Springer, Dordrecht, 2004.
25
Guyon, P., Boucher, O., Graham, B., Beck, J., Mayol-Bracero, O. L., Roberts, G. C., Maenhaut, W., Artaxo, P., and Andreae, M. O.: Refractive index of aerosol particles over the Amazon tropical forest during LBA-EUSTACH 1999, J. Aerosol. Sci., 34, 883–907, 2003.
Havers, N., Burba, P., Lambert, J., and Klockow, D.: Spectroscopic characterization of humic-like substances in airborne particulate matter, J. Atmos. Chem., 29, 45–54, 1998.
30
Hoffer, A., Gelencs´er, A., Blazs´o, M., Guyon, P., Artaxo, P., Andreae, M. O.: Chemical transfor-mations in organic aerosol from biomass burning, Atmos. Chem. Phys. Discuss., accepted, 2005.
ACPD
5, 7341–7360, 2005 Optical properties of humic-like substances A. Hoffer et al. Title Page Abstract Introduction Conclusions References Tables Figures J I J I Back CloseFull Screen / Esc
Print Version Interactive Discussion
EGU Horvath, H.: Atmospheric Light-Absorption – a Review, Atmos. Environ. Part a-General Topics,
27, 293–317, 1993.
Kinney, P. D., Pui, D. Y. H., Mulholland, G. W., and Bryner, N. P.: Use of the Electrostatic Classification Method to Size 0.1 Mu-M Srm Particles – a Feasibility Study, J. Res. Natl. Inst. Stand. Technol., 96, 147–176, 1991.
5
Kirchstetter, T. W., Novakov, T., and Hobbs, P. V.: Evidence that the spectral dependence of light absorption by aerosols is affected by organic carbon, J. Geophys. Res.-Atmos., 109, D21208, doi:10.1029/2004JD004999, 2004.
Kiss, G., Varga, B., Galambos, I., and Ganszky, I.: Characterization of water-soluble or-ganic matter isolated from atmospheric fine aerosol, J. Geophys. Res.-Atmos., 107, 8339,
10
doi:10.1029/2001JD000603, 2002.
Pinnick, R. G. and Auvermann, H. J.: Response Characteristics of Knollenberg Light-Scattering Aerosol Counters, J. Aerosol. Sci., 10, 55–74, 1979.
Reid, J. S., Eck, T. F., Christopher, S. A., Koppmann, R., Dubovik, O., Eleuterio, D. P., Holben, B. N., Reid, E. A., and Zhang, J.: A review of biomass burning emissions part III: intensive
15
optical properties of biomass burning particles, Atmos. Chem. Phys., 5, 827–849, 2005,
SRef-ID: 1680-7324/acp/2005-5-827.
Schnaiter, M., Horvath, H., Mohler, O., Naumann, K. H., Saathoff, H., and Schock, O. W.: UV-VIS-NIR spectral optical properties of soot and soot-containing aerosols, J. Aerosol. Sci., 34, 1421–1444, 2003.
20
Schnaiter, M., Schmid, O., Petzold, A., Fritzsche, L., Klein, K. F., Andreae, M. O., Helas, G., Thielmann, A., Gimmler, M., Mohler, O. M., Linke, C., and Schurath, U.: Measurement of wavelength-resolved light absorption by aerosols utilizing a UV-VIS extinction cell, Aerosol Sci. Technol., 39, 249–260, 2005.
Solomon, P. A., Moyers, J. L., and Fletcher, R. A.: High-volume dichotomous virtual impactor
25
for the fractionation and collection of particles according to aerodynamic size, Aerosol Sci. Technol., 2, 455–464, 1983.
Varga, B., Kiss, G., Ganszky, I., Gelencs ´er, A., and Krivacsy, Z.: Isolation of water-soluble organic matter from atmospheric aerosol, Talanta, 55, 561–572, 2001.
ACPD
5, 7341–7360, 2005 Optical properties of humic-like substances A. Hoffer et al. Title Page Abstract Introduction Conclusions References Tables Figures J I J I Back CloseFull Screen / Esc
Print Version Interactive Discussion
EGU Table 1. Optical (at 532 nm) and physical parameters of HULIS isolated from biomass burning
aerosol. Assuming 5% uncertainty in the measurement of the absorption and scattering coeffi-cient and 10% uncertainty in the determination of the number concentration, the uncertainty of the refractive index is within 3%. The intervals in the table show the confidence intervals of the parameters. Index of refraction, real part Index of refraction, imaginary part Mass absorp-tion coeff. (m2g−1) Mass scatter-ing coeff. (m2g−1) Density (g cm−3) HULIS – day 1.653±0.013 0.00187±0.00016 i 0.031±0.003 1.96±0.14 1.569±0.031 HULIS – night 1.685±0.010 0.00163±0 i 0.029±0.001 2.53±0.13 1.502±0.018
ACPD
5, 7341–7360, 2005 Optical properties of humic-like substances A. Hoffer et al. Title Page Abstract Introduction Conclusions References Tables Figures J I J I Back CloseFull Screen / Esc
Print Version Interactive Discussion
EGU Fig. 1. Experimental setup to measure the optical properties of HULIS.
ACPD
5, 7341–7360, 2005 Optical properties of humic-like substances A. Hoffer et al. Title Page Abstract Introduction Conclusions References Tables Figures J I J I Back CloseFull Screen / Esc
Print Version Interactive Discussion
EGU Fig. 2. SEM picture of particles generated by the TSI atomizer from a homogeneous solution of
HULIS, which was isolated from the fine fraction of biomass burning aerosol from the Amazon basin.
ACPD
5, 7341–7360, 2005 Optical properties of humic-like substances A. Hoffer et al. Title Page Abstract Introduction Conclusions References Tables Figures J I J I Back CloseFull Screen / Esc
Print Version Interactive Discussion EGU Wavelength (nm) 300 400 500 600 700 Ab so rb an ce 0.0 0.5 1.0 1.5 2.0 2.5 3.0 y = 8E+17x-7.0639 R2 = 0.9942 y = 1E+18x-7.1684 R2 = 0.9963 HULIS night HULIS day
fitted curve (HULIS day) fitted curve (HULIS night)
ACPD
5, 7341–7360, 2005 Optical properties of humic-like substances A. Hoffer et al. Title Page Abstract Introduction Conclusions References Tables Figures J I J I Back CloseFull Screen / Esc
Print Version Interactive Discussion EGU Wavelength (nm) 300 400 500 600 700 Ma ss abso rpt io n coeff icient of HUL IS -C (m 2 g -1 ) 0 1 2 3 4 Mass a bsorpt ion coef ficient of soot (m 2 g -1 ) 4 6 8 10 12 14
Fig. 4. The estimated wavelength-dependence of the (carbon) mass absorption coefficient of
ACPD
5, 7341–7360, 2005 Optical properties of humic-like substances A. Hoffer et al. Title Page Abstract Introduction Conclusions References Tables Figures J I J I Back CloseFull Screen / Esc
Print Version Interactive Discussion EGU Wavelength (nm) 300 400 500 600 700 Ab so rp tion b y HU LIS (%) 0 10 20 30 40 50 60
Fig. 5. Estimated relative contribution of HULIS to light absorption in biomass burning aerosol