Dose-Rate-Effects in XRCC1 Wild-type and
Mutant CHO Cell Lines Using An
24 1Am Source
MASSCHUSETTS INSTITUTE
by
OF womatoevDwight McCoy Chambers
AUG 1 9 2009
B.S. Massachusetts Institute of Technology (2007)
LIBRARIES
Submitted to the Department of Nuclear Science and Engineering
in partial fulfillment of the requirements for the degree of
Master of Science in Nuclear Science and Engineering
at the
ARCHIVES
MASSACHUSETTS INSTITUTE OF TECHNOLOGY
September 2008
@
Massachusetts Institute of Technology 2008. All rights reserved.
Author .
Department of Nuclear Science and Engineering
n
j
Septembyr 5, 2008
Certified by ...
...
I
/
Jdcquelin C. Yanch
Professor, Department of Nuclear Science and Engineering
.-
Tesis
Supervisor
Read by ...
...
Bevin Engelward
Associate Professor, Department of Biological Engineering
/1
Tesis Reader
Accepted by ...
1/
-Jacquelin C.
Yanch
Dose-Rate-Effects in XRCC1 Wild-type and Mutant CHO
Cell Lines Using An
241Am Source
by
Dwight McCoy Chambers
Submitted to the Department of Nuclear Science and Engineering on September 5, 2008, in partial fulfillment of the
requirements for the degree of
Master of Science in Nuclear Science and Engineering
Abstract
This work explores the effects of low-dose-rate radiation on both the AA8 (wild-type CHO cells) and EM9 (XRCC1 null CHO mutants) cell lines. In particular, this study performed clonogenic survival and growth assays to determine the radiations/ effect on the cells pro-liferative capacity. It was hypothesized that the XRCC1 null mutants would show greater radiosensitivity during continuous low-dose-rate radiation since the inability to rapidly re-spond to DNA damage would result in the gradual accumulation of cytotoxic double strand DNA breaks and/or chromosome exchanges/aberrations. The cells were irradiated for 7 days with photons from unencapsulated 241Am plate sources for chronic, low-dose-rate studies, at dose-rates between 1.99 ± .610 x 10-3 cGy/h and 1.23 ± .0325 cGy/h, and irradiated with a Phillips RT250 X-ray machine at 250 kVp and 2.5 Gy/min to doses between 0.02-10 Gy for acute studies. There were significant differences in the growth rates of the unirra-diated controls and the irraunirra-diated flasks at all dose-rates for both AA8s and EM9s (except for the EM9 9.08 ± .390 x 10- 3 cGy/h flask where p<.10). There were also suggestive (p<.20) differences in the clonogenic survival for both cell lines compared to controls with significant (p<.05) differences observed in the EM9 irradiated population at dose-rates of:
6.89 ± .315 x 10- 3 cGy/h, 3.30 + .80 x 10- 3 cGy/h, and 1.99 + .61 x 10- 3 cGy/h. More-over, there are suggestive (p<.15) trends indicating that XRCC1 deficient cells are more susceptible to chronic low-dose-rate radiation (dose-rates compared were between 1.99 ± .61 x 10-3 cGy/hand 9.08 + .39 x 10- 3 cGy/h) as compared with acute exposures at the same dose. Despite some procedural differences with other published works, these results may be evidence of the "inverse dose-rate" effect noted by other authors.
Thesis Supervisor: Jacquelin C. Yanch
Title: Professor, Department of Nuclear Science and Engineering
Thesis Reader: Bevin Engelward
Acknowledgments
I am fortunate to have so many people to thank for helping me to get where I am today. First and foremost, I would like to thank my brother and my parents. Their love and encouragement is essential to my success. I would also like to sincerely thank Profs. Yanch and Engelward for affording me the opportunity to be a part of this work and mentoring me through the process.
I must also take special care to thank Matt Davidson. Beyond his numerous acts of technical assistance, his fun spirit helped make this an enjoyable project.
I am also grateful to Anurag Maheshwari for his expert assistance.
There are so many people who have made my MIT journey so special that I do not have space to thank you all properly. So, Sigma Nu brothers, rowers, Course 22 Nuclear Family members, office-mates, lab-partners, ex-boyfriends, and friends, please accept my gross group thank you in lieu of more personal recognition.
Finally, thank you to Tom Larsen for shaming me into writing this up in LaTeX and offering me the critical assistance necessary to make that a reality. It almost
Contents
1 Introduction
1.1 Overview of this work .. ... ... 1.2 Literature Review ...
1.2.1 Radiobiology Overview . . . . . . . .. 1.2.2 Construction of Low-Dose-Rate Facilities . . . . 1.2.3 Findings from the Edge: Low-Dose-Rate Phenomena 1.2.4 Biological Characterization of AA8 and EM9 Lines 1.2.5 Acute AA8-EM9 Clonogenic Survival Studies . . . .
2 Dosimetry and Experimental Design
2.1 Optically Stimulated Dosimeters . . . . . . . . .. 2.1.1 T heory . . . . . . . . .. . 2.1.2 Thermal Effects and Quenching . . . .. 2.1.3 Linearity . . . .... ...
2.1.4 Landauer pStar Dot Dosimeters . . . . 2.2 Experimental Setup . . . . . . . . . . . . ..
2.2.1 Decay Characteristics of the 241Am Sources . . . . . 2.2.2 Physical Characteristics of the Americium Foils . . . 2.2.3 Energy Spectra of the 241Am Sources . . . . . . 2.2.4 Dose-Rate Characterization . . . . . . . . .. 2.2.5 Incubator Arrangement .... . . . . . .. 2.2.6 Characteristics of the 250 kVp X-Ray Generator . . .
21 . . . . 21 ... . 22 . . . . 22 . . . . 22 . . . . 23 . . . . 27 . . . . 27 31 32 32 34 34 35 36 36 37 39 40 47 47
3 Biological Protocols
3.1 Cell Handling and Maintenance 3.1.1 Medium Preparation . 3.1.2 Cell Passaging ... 3.2 Biological Assays ...
3.2.1 Clonagenic Survival Assay 3.2.2 CyQUANT Growth Assay
4 Results And Discussion 4.1 Results ...
4.1.1 Clonogenic Assay: 4.1.2 CyQUANT Assay 4.2 Discussion ...
Continuous and Acute .
. . . . . . . . .
List of Figures
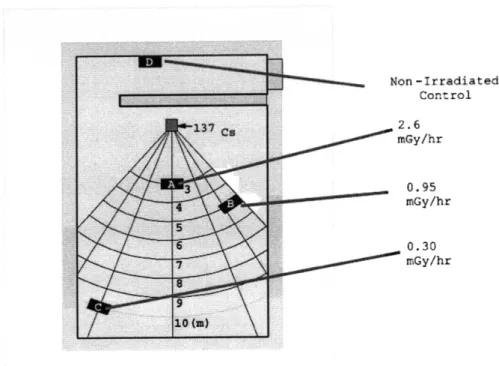
1-1 Schematic summarizing the design features of a typical low-dose-rate facility. Shelves in a 9 m x 12 m x 5 m concrete shielded room surround a 370 GBq 137Cs source radially. The dose-rates at several of the distances from the source are noted. Control samples are shielded by a 60 cm thick concrete wall, behind which the dose-rate is the same as it is outside the facility. Because of the mono-energetic nature of the source (a 667 keV 7-ray) and the radiations/ long mean free path, the various dose-rate positions generally receive the same radiation energy
spectrum [29] ... ... ... ... . 24 1-2 Induction of HPRT mutations at various dose-rates in a number of
different cell lines. ] symbols refer to data from CHO V-79 cells, A and x shapes refer to data from TK6 lymphoblastiod, and x refers to mouse lymphoma L5178Y cells. Two parabolic lines, fitting particular cell lines, are shown as well. The data suggest there is a minimally sparing dose-rate for the various cell lines and that dose-rates above and below that point cause more damage [41]. . ... . . 26 1-3 Clonogenic survival curves from Skov et al. for AA8 and EM9 cell lines
exposed to 250 kVp x-rays at 0.016 Gy/min-0.44 Gy/min dose-rates. The Figure demonstrates the inferior repair capacity of EM9s with respect to AA8s through the shallowness of the EM9 shoulder and the increased radiosensitivity of EM9s with respect to AA8s through the increased slope of the linear portion of the EM9 curve [32]. ... . 29
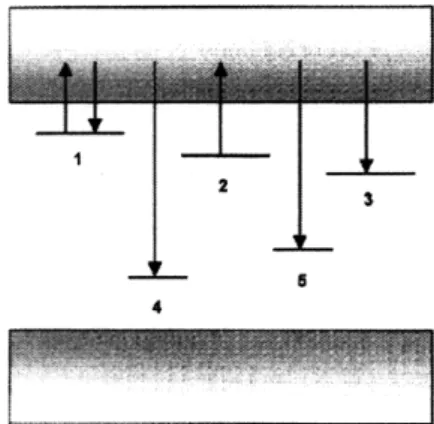
2-1 This cartoon shows most of the possible ionization paths in OSL mate-rials. (1) shows a full transition from the valence to conduction band; (2) shows an ionization to a very shallow (and hence, unstable) defect trap; (3a) shows an ionization from a localized defect to the conduction band while (3b) shows an ionization to a deep trap; (4a) illustrates ion-izations from a deep trap back into the conduction band; (4b) shows an ionization from the valence band into a localized defect trap; (5) shows a defect to defect transition [9, 22]. . ... . . 32 2-2 This illustration depicts the possible transitions during optical
stim-ulation of the OSL material. (1) depicts promotion and trapping by a shallow trap while (2) depicts promotion from a more typical OSL defect trap. (3) shows a deep trap into which ions can become local-ized while (4) and (5) depict radiative and non-radiative recombination centers respectively [9]. ... ... ... . 33 2-3 Part (a) of this figure depicts thermal quenching of the OSL signal in
A1203:C. At higher and higher temperatures, more charges are reunited
during periods where the OSL is not being stimulated (and observed) or are being reunited through more non-radiative pathways. There is
a general region of stability for A1203:C materials through 400 K [9]. 35
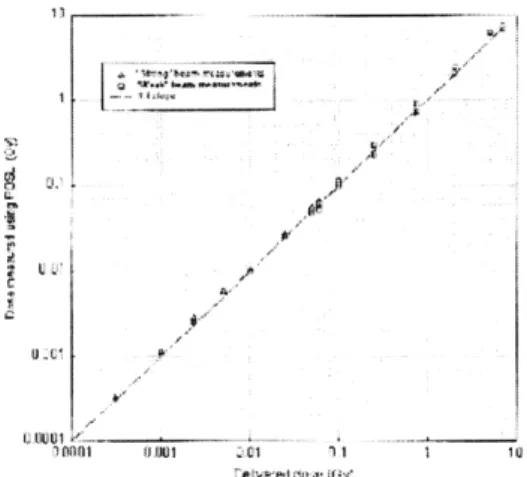
2-4 This figure depicts the linear A120 3:C response to dose from 90Sr/90Y
0 decay. The linear range extends up to 50 Gy for this material. The "weak" and "strong" beam conditions refer to the intensity of laser light used to perturb the meta-stable states in the irradiated crystal. Under both reading conditions, the response is linear [9]. ... 35 2-5 Crystalline structure of A1203 with the aluminum ions in grey and the
oxygen ions in red. The general structure of the crystal is a series of interlocking hexagons and octagons [13]. . ... 36 2-6 A decay scheme showing likely transitions for 241Am. The probabilities
for each transition are given relative to all possible decays and all energies indicated are keV [18]. . ... .. 38
2-7 Schematic depiction of the 241Am foils manufactured by NRD, LLC. The 24 1Am powder is mixed with gold and sandwiched between gold,
silver and palladium foils. The varying composition and thickness of the surrounding material gives directionality to the radiation quality and dose-rate [45]. ... . .... ... . ... 38
2-8 This curve shows the energy dependent efficiency correction that must be applied to raw spectra from the Amptek X123 Sn-PIN spectrometer. While the detector is highly efficient at very low energies, it has low efficiency much above 15 keV. . ... ... 40
2-9 Energy spectra of Dr. Yanchs 241Am foil (3 of 32). The spectrum was collected on an Amptek X123 Sn-PIN spectrometer for 10 minutes. The raw counts (red) were corrected using the manufacturers energy-efficiency data to produce the adjusted spectrum (blue). . ... 41
2-10 Energy spectrum from Dr. Coderre/s 241Am foil (Coderre-1). The spectrum was collected on an Amptek X123 Sn-PIN spectrometer for 18 hours. The raw counts were corrected using the manufacturers energy-efficiency data to produce the adjusted spectrum (blue). . . . 42
2-11 Energy spectrum from Dr. Coderrels 241Am foil (Coderre-2). The
spec-trum was collected on an Amptek X123 Sn-PIN spectrometer for 30 minutes. The raw counts (red) were corrected using the manufacturers energy-efficiency data to produce the adjusted spectrum (blue). . . . 43
2-12 Energy spectrum from Dr. Coderrels 241Am foil (Coderre-3). The
spectrum was collected on an Amptek X123 Sn-PIN spectrometer for 30 minutes. The raw counts were corrected using the manufacturers energy-efficiency data to produce the adjusted spectrum (blue). . . . 44
2-13 Energy spectrum from Dr. Coderrels 241Am foil (Coderre-4). The spectrum was collected on an Amptek X123 Sn-PIN spectrometer for 90 minutes. The raw counts were corrected using the manufacturer/s energy-efficiency data to produce the adjusted spectrum (blue). While the additional noise is due to the combination of low foil activity and a short measurement time, the underlying energy spectrum of this foil is the same as other foils. ... . . . ... . 45 2-14 The dose per photon deposited at various depths of polyethylene by
241Am 59.5 keV y-rays, 237Np x-rays and a mixed source of those two
radiations all normalized to the same initial dose/photon value as es-timated by an MCNP simulation. In the Figure, it is clear that the
237Np x-rays are less penetrating and are preferentially moderated
com-pared to the 241Am y-rays. The 241Am plate sources are a combination of these two radiations and behave as their weighted average. This Figure was produced and provided by Matthew Davidson. ... . 46 2-15 The energy spectrum of an 241Am foil from the gold plated side through
0.2 mm of lead shielding. The lead differentially attenuates the low energy 237Np x-rays leaving a field that is dominated by the 59.5 keV
y-ray. This figure is courtesy of Matthew Davidson. . ... 47 2-16 Geometric dose-rate effects as seen on the Coderre-1 foil. The cells are
modeled to be in a dish approximately i of an inch off the surface of the foil. The foil is 3 inches by 3 inches. . ... 48 2-17 Image of one of Dr. Yanchis 241Am foils taken with BAS Imaging Plate
by An Vu. The imaging plate has a spatial resolution of 100 pm2. . . 48 2-18 Figure depicting the arrangement of the incubator for continuous
ir-radiation experiments. The top shelf holds the higher activity Yanch foils and the smaller, lower activity Coderre foils are on the bottom shelf. The Yanch foils are shielded on their bottoms with 6.35 mm of lead to prevent their radiation from contributing to the dose received by samples on the Coderre foils ... ... ... 48
2-19 A Figure depicting the gun-stand arrangement in the Phillips RT250 irradiation chamber. The gun is oriented toward the ground and the stand is directly underneath. Markings on the table help to properly orient the stand to minimize position induced variance in the dose delivered by the generator. The stand also has marking on its surface to help orient samples properly. ... ... . . . . . 49
2-20 Dose-Rate as a function of distance as measured by Landauer Dot Dosimeters, Luxel personal dosimeter badges and by previous researchers. All measurements were conducted in a 250 kVp field at 15 mA and into a 0.4 Th target (except the 100 cGy/min Reference point which had a current of 12 mA). The puStar Dots were exposed for 9 minutes while the Luxel badges were exposed for 5 minutes each. Both the badges and the dots have different ratios between their measurements at the 11.25 in. and 9.7 in. stand height positions and the reference dose-rates given at those points. Both the dots and the badges have good fits to a - curve: Rdot = .952 and Radge = .987... 51
4-1 A picture of a flask whose colonies are representative of the distribu-tion of colony sizes found on both the AA8 and EM9 clonogenic flasks. While visible to the eye, the largest colonies were often only tenths of a millimeter in diameter. The smaller colonies, which were consider-ably smaller, had to be compared to a standard sized colony that was counted under a light microscope and found to have approximately 50 cells. The colonies ranged in size, with some of the largest colonies being around 0.1 mm in diameter. ... . 60
4-2 Colony forming assay results for AA8 (red) and EM9 (blue) cells ex-posed acutely to a 250 kVp x-ray field and allowed to grow for 7 days. The x-ray dose-rate was 2.5 Gy/min with doses between 0.02 Gy and 10 Gy as reported in Table 4.2. The survival data were fit with both a "multi-target single hit" (MTSH) model and a "linear-quadratic" model. For the linear-quadratic model, the AA8 cell lines a = 0.5656, / = 0, and the goodness of fit, as assessed by R2, was 0.8941. The parameters for the EM9 fit are: a = 1.498, 0 = 0, and R2 = .9144. For the MTSH model, the parameters for the AA8 fit are: n = 1, Do = 1.768 and R2 = 0.8941. The parameters for the EM9 fit are: n = 1, Do = 0.6675, and R2 = .9144. These two models are reducible to
-D
each other in the form: y(D) = e Do where Do is I. The error bars
are calculated based on the Poisson "counting" error associated with random processes ... ... .. ... . 62
4-3 Colony forming assay results for AA8 and EM9 cells exposed chron-ically to low-dose-rate radiation from 241Am sources for 7 days. The dose-rates, as reported in Table 4.2, range from 0.00199 ± 0.00061 cGy/h to 1.23 + 0.03 cGy/h. There is a pronounced difference be-tween the survival of the AA8 and EM9 pairs at all dose-rates. There is also a lack of conclusive dose-rate structure to both curves as seen by the hypothesis testing reported in Table 4.3. The error bars represent the error derived from a technical repeat at each dose-rate (except on the 9.08 ± .390 x 10- 3 cGy/h (Coderre-2) foil in which case no error bars are indicated) ... . ... ... 63
4-4 A bar chart summarizing the average number of AA8 and EM9 cells in at least five wells at each dose-rate after 4.5 days. The error bars are based on the pooled error from 5 technical repeats. Each well was initially plated at a density of 400 cells / well. While there is a signif-icant difference (see Table 4.6) between irradiated and non irradiated samples for each cell line, the inter-cell line differences and cell line differences at any particular dose-rate are not significant. ... . 66 4-5 Clonogenic survival curve for AA8 and EM9 cell lines exposed acutely
to 40 kVp x-rays at a dose-rate between 2.2-4 Gy/min. The (Do, n) for the AA8s and EM9s lines are (1.2, 100) and (0.6, 100) respectively. For both cell lines, a repair shoulder is prominent at the low end of the Dose axis. [35]. . ... ... . 68
List of Tables
1.1 Clonogenic survival parameters for AA8 and EM9 cells line from both "Multi-Target Single Hit" and "Linear Quadratic" models from vanAnkeren
et al. [40] ... ... ... ... .. 28
2.1 Photons associated with 241Am decay and present in at least 0.1% of all decays [21] ... ... ... 37
2.2 Summary of the physical characteristics and activities of all the foils in use during the experiment. ... ... 39
2.3 Summary of the dose-rates measured from the interior of the 241Am foils gold sides using the pStar Dot Dosimeter System. There are con-siderable discrepancies in the dose-rate both from the nominal activity provided by NRD and from the a-particle fluence measured by Dr. Rong Wang [27]. ... ... ... ... 42
4.1 Parameters describing the Linear-Quadratic and Multi-Target Single Hit Models for both cells lines. Despite having different forms, the models' parameters reduce the two models into a single function of
-D
the form: y(D) = e Do . R2 is used to determine how well the models parameters fit the particular data. ... . 60
4.2 Summary of data from continuous and acute clonogenic assays. The colony-forming fraction was computed by dividing the average number of colonies observed at a particular dose or dose- rate by the average number of colonies formed in that particular exposure regime. The individual errors associated with any one condition (as represented by the standard deviation of measurements in that set) were propagated to give the error to the colony-forming fraction. Conditions in bold represent an RBE dose-rate achieved by shielding a Yanch foil with 0.8 mm of lead. ... .... .. .. ... ... ... 61
4.3 A matrix with the T-values from various intra-cell line comparisons and intra-dose-rate comparisons for the continuous exposure Colony Forming Fraction (CFF) data from Students T-test. The diagonal line compares the AA8 and EM9 fractions at a particular dose-rate. The lower half of the matrix compares a particular EM9 dose-rate to other EM9 dose-rates. The top half of the matrix compares a particular AA8 dose-rate to the other AA8 dose-rates. The p-values for 0.05, 0.10, 0.15, and 0.20 for two degrees of freedom are 2.920, 1.886, 1.386, and 1.061. The dose-rate in bold indicates that the dose-rate was achieved by shielding a Yanch Foil with 0.8 mm of lead and has a 59.5 keV 7-ray dominated energy profile. These T-values indicate that there are significant differences between the control and irradiated population's CFF values for both AA8 and EM9 lines. They also indicate that there are significant differences between the CFF values between AA8 and EM9 lines for any particular dose-rate. However, there do not generally appear to be any significant CFF differences between different dose-rates inside the same cell line. . ... .. 64
4.4 A table comparing the significance of the differential AA8-EM9 colony forming fraction (CFF) between the continuous and acute exposures for a given dose and the significance of the difference between exposure regimes at any given point for either AA8s or EM9s. Based on models derived for the acute survival data, CFF fractions for the AA8 and EM9 lines were extrapolated for the lowest three dose-rates since the model behaves well in this region. The error associated with these values scales with the goodness of fit metric, R2. The differences between AA8 and EM9 CFF were then compared across exposure modalities and used to generate a T-value for a paired data ("AA8-EM9 Differential Difference T-Value"). The differences between the CFFs of the two exposure modalities for any one cells line at a particular dose were also tested for both EM9s and AA8s ("Chronic-Acute Difference T-Value"). The p-values for one degree of freedom for 0.05, 0.10, 0.15, and 0.20 are 6.314, 3.078, 1.936, and 1.376. These T-values indicate that there is a significant enhancement of the AA8-EM9 CFF difference between exposure modalities at all dose-rates and a significant difference for the CFFs of AA8s and EM9s between the chronic and acute exposures. 64
4.5 A table summarizing the results of the CyQUANT growth assay for AA8s and EM9s under various dose-rates. The table reports the num-ber of cells after 4.5 days from an intial plating of 200 cells / well. The errors in the measurements are calculated by the standard deviation of the group of wells in that particular dose-rate ... 65
4.6 A matrix with the T-values from various intra-cell line comparisons and intra-dose-rate comparisons for the continuous exposure CyQUANT data from Students T-test. The diagonal line compares AA8 growth behavior to EM9 growth behavior normalized by the negative control for the same dose-rate. The lower half of the matrix compares a partic-ular EM9 dose-rate to other EM9 dose-rates. The top half of the matrix compares a particular AA8 dose-rate to the other AA8 dose-rates. The p-values for 0.05, 0.10, 0.15, and 0.20 for two degrees of freedom are 1.860, 1.397, 1.108, and 0.889. These values indicate that the radia-tion significantly changes the normal growth rate of each particular cell line, but there are no significant differences among the growth rates of irradiated cells both in lines and in dose-rates in a single line .... 67
Chapter 1
Introduction
1.1
Overview of this work
This work will explore the effects of low-dose-rate radiation on both the AA8 (wild-type CHO cells) and EM9 (XRCC1 null CHO mutants) cell lines. In particular, this study will perform clonogenic survival and growth assays to determine the radiations/ effect on the cells/ proliferative capacity. The cells will be irradiated with unencapsu-lated 241Am plate sources for chronic, low-dose-rate studies, between 1.99 ± .610 x 10- 3 cGy/h and 1.23 + 0.0325 cGy/h, and irradiated with a Phillips RT250 X-ray ma-chine at 250 kVp and 2.5 Gy/min for acute studies. These results will be used to reach conclusions concerning the effects of low-dose-rate radiation in vitro and concerning the importance of the XRCC1 protein in DNA repair in this regime. The acute stud-ies will serve as a point of contrast for the low-dose-rate studstud-ies and as a connection to the body of published literature. It is hypothesized that the XRCC1 null mutants will show greater radiosensitivity during continuous low-dose-rate radiation since the inability to rapidly respond to DNA damage will result in the gradual accumulation of cytotoxic double strand DNA breaks and/or chromosome exchanges/aberrations. As part of this work, some preliminary work necessary to compare the relative biological effect (RBE) of the 241Am -y-rays and the 237Np x-rays is also preformed.
1.2
Literature Review
This review will provide an overview of the radiobiological methods and published results for experiments in the low-dose-rate regime. Specifically, this chapter will dis-cuss the construction of large-scale, low-dose-rate facilities and unique radiobiological phenomena that manifest in the low-dose-rate regime. The chapter will conclude with a brief overview of the biological differences and previous clonogenic survival studies conducted on the two CHO cell lines under study, AA8 and EM9.
1.2.1
Radiobiology Overview
Radiation biology studies the intersections between ionizing radiation and biology. The goal of this field is to provide insights into how to evaluate the risks posed by environmental and man-made radiological conditions as well as to help to develop ra-diologic solutions to various pathological conditions. While there is a strong scientific consensus on the effects of acute, high dose, high dose-rate radiation on biological sys-tems, most living things develop in radiation environment characterized by a chronic background of approximately 3.6 mSv/year (4.1 x 10⁻⁴ mSv/hr), 2.53 mSv/year of which comes from a combination of Radon and medical procedures [14]. Currently, the effects of low dose-rate radiation are extrapolated from the well-characterized set of high dose, high dose-rate radiation studies. As the field develops, there is an in-creasing desire to directly study the biological effects of low-dose-rate and low dose radiation. These studies have been catalyzed by the advent of specialized DNA repair mutants that help elucidate the supposedly subtle effects of low-dose-rate radiation. Furthermore, radiation as a cellular and DNA damaging agent has helped provide in-sights into the basic biology of cell signaling and DNA damage repair through studies of specially designed / isolated mutants.
1.2.2
Construction of Low-Dose-Rate Facilities
Several groups around the world have begun constructing large-scale, low-dose-rate, chronic exposure facilities such as the Low Dose Radiation Research Center at the
Central Research Institute of Electric Power Industry, Tokyo, Japan and the Low-Dose-Rate Irradiation Facility at Colorado State University. These and other such facilities generally exploit a 7-ray source (a or / emitters typically have undesirable
range and/or linear energy transfer (LET) characteristics), typically 13 7Cs or 60Co
because of their desirable energy (nearly mono-energetic, penetrating radiation) and half life characteristics (long half lives provide essentially constant dose-rate over the duration of an experiment), and use - effects to generate various dose-rates [29, 23, 11]. The design of the Japanese facility is shown in Figure 1-1 to give a sense of the materials and distances involved in the construction of a low-dose-rate facility for in vivo studies [29]. The same construction principles are used for in vitro studies except that additional constrains must be taken to maintain the correct atmosphere and temperature conditions inside the irradiation chamber [23, 11]. This can typically be achieved by placing the cells on a variable height table inside an incubator with a shuttered high activity source [11].
There are other research groups pursuing alternative low-dose-rate designs to the 7-ray facilities described above. One group in France is conducting in vitro studies using cells cultured directly on top of a thin layer of thorium nitrate crystals, achieving dose-rates as low as 40 mrad/day [12]. A Japanese group introduced tritiated water (HTO) water directly into the cell medium and achieved dose-rates between 5 cGy/h and 40 cGy/h [38]. While these alternative solutions give the researcher additional flexibilities in terms of radiation types and qualities over the more standard 7-ray sources, they are often burdened by issues of source homogeneity and stability [38].
1.2.3
Findings from the Edge: Low-Dose-Rate Phenomena
Given the number of cell types available, the diversity of radiation sources, and the resolution of biological tools from the level of populations to DNA sequences, it is difficult to provide a complete summary of all the activity occurring in the field of low-dose-rate radiation. That said, there are a number of important phenomena that manifest at low-dose-rates including: dose-rate sparing, sub-limiting dose-rates,
Non - Irradiated Control 2.6 0.95 mGy/h.r 6 0.30 rGy/hr 10(a)
Figure 1-1: Schematic summarizing the design features of a typical low-dose-rate facility. Shelves in a 9 m x 12 m x 5 m concrete shielded room surround a 370 GBq 137Cs source radially. The dose-rates at several of the distances from the source are noted. Control samples are shielded by a 60 cm thick concrete wall, behind which the dose-rate is the same as it is outside the facility. Because of the mono-energetic nature of the source (a 667 keV y-ray) and the radiations/ long mean free path, the various dose-rate positions generally receive the same radiation energy spectrum [29].
radiation hormesis, and inverse dose-rate effects.
Dose-rate sparing or the "dose-rate effect" is the idea that the radiation end-points are correlated to the intensity of the radiation source. This effect is the most commonly observed low-dose-rate phenomenon, seen across most cell types and bi-ological assays. For example, many studies have observed a decrease in cell killing [38, 25, 4, 44], micronuclei induction [8, 42, 38], growth rates retardation [12, 43], mu-tation induction [20], and y-H2AX foci induction [19] as the dose-rate of the radiation is lowered. This effect is not unique to low-dose-rate radiation and similar effects are observed from variable high-dose-rate and dose fractionation studies [15]. Dose-rate sparing is often used as evidence of a deterministic (as opposed to stochastic) model of radiation interactions [6].
Other groups have found dose-rates for acute exposures beneath which there are no radiation-induced effects. This threshold is referred to as the sublimiting dose-rate. For example, some authors report critical radiation dose-rates for various lines necessary to induce some survival reaction or inhibit cell division completely. For CHO V79 cells, one group found no clonogenic survival effects were observed below 37 cGy/h while cell division were only completely inhibited at rates above 90 cGy/h [6, 28]. The same group found, for HeLa cells, that division was inhibited at 38 cGy/h [6]. Interestingly, researchers also found that the sublimiting clonogenic dose is often specific to a particular phase of the cell cycle. G2 cell cycle blocks can be accomplished at doses as low as 9 cGy as compared to doses of 300-500 cGy necessary to inhibit division in G1 or S phase [6].
Radiation hormesis is the idea that radiation exposure may have benign or even beneficial effects for living organisms [15]. A number of hormetic effects have been observed by the research group (PI K. Sakai) operating out of the Low Dose Radi-ation Research Center at the Central Research Institute of Electric Power Industry, Tokyo, Japan. Their findings and related work done by other groups, done with 137Cs 7-rays, include optimal radiation induce tumor suppression at 1 mGy/h [34, 29], life-lengthening in mice with auto-immune disorders at approximately 0.35 mGy/h and 1.2 mGy/h [16] and in healthy populations at approximately 7-14 cGy/year [1], sup-pression of murine AIDS [31] and a general stimulation of the immune system [30]. Generally, the hypothesis is that low-dose-rate radiation can stimulate the bodyfs natural DNA repair and defense mechanisms while not introducing serious damage [37]. It is worth noting that most (if not all) of the Sakai group findings have been conducted in vivo and may not be reproducible in vitro if there are higher order biological signaling and phenomena helping to organize the bodily reaction to the radiological insert.
The inverse dose-rate effect is the hypothesis that a decrease in dose-rate leads to an increase in the magnitude of the biological endpoint. This seemingly counter-intuitive
theory has been demonstrated experimentally by Mitchell in clonogenic survival stud-ies with an explanation that the irradiated cells were becoming trapped in an infinite repair loop in a radiosensitive cell cycle phase [23]. More recent work by Vilenchik and Knudson has sought to synthesize dose-rate sparing and the inverse dose-rate effect into a coherent picture of repair activity inside a cell. In this new framework, cells are thought to only be able to detect levels of insult above the rate of endogenous DNA damage. Thus, dose-rates below a certain critical level damage the cell/s DNA while remaining below the repair radar -giving rise to a parabolically shaped DNA damage versus dose-rate curve. An example of such a curve for the induction of mutations in the HPRT locus is shown in Figure 1-2, although their paper extends the analysis to other mutagenic endpoints as well [41]. It is interesting to note that despite the difference in cell lines, all the lines have an inflection point around 1 cGy/min for mutations to the HPRT locus [41].
>- 14 -+ " K3X K2 X &4 ++
/41
E X 2/ X -3 -2 -1 0 1 2c log dose rate, cGytmin
Figure 1-2: Induction of HPRT mutations at various dose-rates in a number of dif-ferent cell lines. H symbols refer to data from CHO V-79 cells, A and x shapes refer to data from TK6 lymphoblastiod, and x refers to mouse lymphoma L5178Y cells. Two parabolic lines, fitting particular cell lines, are shown as well. The data suggest there is a minimally sparing dose-rate for the various cell lines and that dose-rates above and below that point cause more damage [41].
1.2.4
Biological Characterization of AA8 and EM9 Lines
In the early 1980s, a research group at Lawrence Livermore National Laboratory led by L.H. Thompson isolated a CHO mutant, labeled EM9, through the use of an ethyl methanesulfonate (EMS) screen from a wild-type CHO line, AA8 [35, 32]. Originally notable for having a 10-fold higher sensitivity to EMS as compared to its parent, AA8, the EM9 line was discovered to have an increased sensitivity to ionizing radiation and other chemical mutagens as well as a much higher endogenous rate of sister-chromatid exchanges [35].
Based on its sensitivity to particular DNA damaging agents, researchers classified EM9 as a single strand break (SSB) and/or base-excision repair (BER) mutant. More specifically, they found that normal CHO cells had a fast followed by slow phase of SSB repair and that EM9 cells were particularly inefficient at executing the fast phase of SSB repair as compared to AA8s [2]. The kinetics of this repair deficiency have been shown to be modulated by several experimental factors including pH [40] and oxygen level [28].
Later, additional work by Thompson identified the X-ray repair cross complement-ing protein 1 (XRCC1) as the defective protein in the EM9 cell line [36]. XRCC1 appears to have a conserved function in the human genome and is involved with a complex of proteins including: DNA ligase III, polymerase 3, and poly (ADP-ribose) polymerase [40]. While the biochemical picture is still incomplete for XRCC1, there is some evidence that it is associated with DNA ligase III. Specifically, purification tech-niques such as immobilized metal ion affinity chromatography (IMAC) revealed that DNA ligase III and XRCC1 copurify, indicating a biochemical or physical connection between the two proteins [10].
1.2.5
Acute AA8-EM9 Clonogenic Survival Studies
Many different research groups have characterized the clonogenic survival after acute irradiation of both AA8s and EM9s. Shortly after isolating the pair, Thompson
Table 1.1: Clonogenic survival parameters for AA8 and EM9 cells line from both "Multi-Target Single Hit" and "Linear Quadratic" models from vanAnkeren et al. [40].
Cell Line Do (Gy) n De (Gy) a (Gy- 1) f (Gy- 2) AA8 1.11 ± 0.08 18.2 + 3.6 3.22 ± 0.68 0.189 ± 0.016 0.036 ± 0.0018 EM9 1.03 + 0.04 4.0 ± 0.9 1.43 ± 0.32 0.559 + 0.014 0.0365 ± 0.002
studied their survival in a 40 kVp X-ray field administered at approximately 2.2-4 Gy/min. His group fit the data to a "Multi-Target Single Hit" (MTSH) Model and reported (Do,De) parameters of (0.6 Gy, 2.9 Gy) and (1.2 Gy, 5.3 Gy) for EM9s and AA8s, respectively [35]. A group, vanAnkeren et al., used AA8 and EM9 survival curves from a 5.0 Gy/min 137Cs source to compare the predictions of the MTSH and "Linear Quadratic" survival models. Their survival parameters are summarized in Table 1.1 [40].
Some groups have even been exploring AA8 and EM9 clonogenic survival at dose-rates approaching the low-dose-rate limit. Skov et al. used a 250 kVp x-ray field with dose-rates between 0.016 Gy/min 0.44 Gy/min with doses between 0-2 Gy. While they fit their data to a repair-misrepair (RMR) model, they did not report their parameters. One of their figures is reproduced in Figure 1-3 [32].
General findings from these groups show that EM9s have inferior repair kinetics (as evidenced by the width of the cell survival curve shoulder) and increased radiosensi-tivity (as evidenced by smaller Do values) as compared to the AA8 line.
f"
0)04
1
*4Dose (Gy)
Figure 1-3: Clonogenic survival curves from Skov et al. for AA8 and EM9 cell lines exposed to 250 kVp x-rays at 0.016 Gy/min-0.44 Gy/min dose-rates. The Figure demonstrates the inferior repair capacity of EM9s with respect to AA8s through the shallowness of the EM9 shoulder and the increased radiosensitivity of EM9s with respect to AA8s through the increased slope of the linear portion of the EM9 curve [32].
Chapter 2
Dosimetry and Experimental
Design
This chapter will explore the characteristics of the dosimetry and radiological sys-tems used in this study. Since the dosimeters are a critical piece of equipment for measuring the dose and dose-rate enviroment, fully exploring their qualities is neces-sary. This section will begin by summarizing the theoretical behavior of A1203:C, the
dosimetry material used in this work, as an optically stimulated dosimeter and work towards addressing practical aspects of this material in the radiation environment. The dosimetry section will conclude with a discussion of the specifics of the Landauer InLight pStar Dot Dosimetry system. The section on experimental design will open with a summary of the decay process for 24 1Am and then describe the physical, spec-tral and dose-rate qualities of the radiative foils used. The design summary will also describe how incubator space was managed and conclude by detailing the spectral and dose-rate characteristics of the X-ray generator used for acute experiments.
2.1
Optically Stimulated Dosimeters
2.1.1
Theory
Generally, the theory of optically stimulated luminescence (OSL) relies on the per-turbation of the electronic ground state to some meta-stable state, which will, after the introduction of additional perturbation, return to the group state while
radiat-ing [9, 22, 3]. More specifically, the OSL materials rely on the electronic structure present in most electrically insulating and semi-conducting material. Incident radi-ation, mainly through photoelectric or Compton scattering mechanisms, will impart sufficient energy to promote a valence band electron (or to an electron already in a band-gap state) either directly into the conduction band or into some band-gap "defect" electron trap [9]. All possible ionization paths considered during ionization are shown in Figure 2-1.
.~ ..i...A
_.
I4
3P~ f
T
,b
:1T411e
Figure 2-1: This cartoon shows most of the possible ionization paths in OSL mate-rials. (1) shows a full transition from the valence to conduction band; (2) shows an ionization to a very shallow (and hence, unstable) defect trap; (3a) shows an ioniza-tion from a localized defect to the conducioniza-tion band while (3b) shows an ionizaioniza-tion to a deep trap; (4a) illustrates ionizations from a deep trap back into the conduction band; (4b) shows an ionization from the valence band into a localized defect trap; (5) shows a defect to defect transition [9, 22].
The promoted electrons will come to settle in some meta-stable energy state created by naturally occurring defects in the crystalls electric structure [9]. A slight perturba-tion (usually in the form of coherent light) will re-promote these meta-stable states, allowing them the chance to recombine with their opposite charge carriers (electrons
"
1
and electron-holes are the two typical charge carriers). Some of these recombination events are radiative decays and emit characteristic light [9, 22]. A general summary of the stimulation pathways is illustrated in Figure 2-2.
'.T8
Figure 2-2: This illustration depicts the possible transitions during optical stimulation of the OSL material. (1) depicts promotion and trapping by a shallow trap while (2) depicts promotion from a more typical OSL defect trap. (3) shows a deep trap into which ions can become localized while (4) and (5) depict radiative and non-radiative recombination centers respectively [9].
To a first order approximation, the intensity of an OSL signal, IOSL, is proportional to the dose absorbed during irradiation, D (discussed later in the Linearity Section). The signal intensity is also proportional to the decay rate of i, the meta-stable states originally induced. This, in turn, is proportional to the number of charge pairs created and the probability of a single pair recombining. The probability, p, of a recombina-tion event is expressed as P(E)a(E) where 4(E) is the intensity of stimulating light with energy, E, and a(E) is the photo-interaction cross section for that material at that particular energy (there is also an assumption that E is equal to or greater than the band-gap necessary to liberate the trapped charge) [9]. Equation 2.1 summarizes these relationships:
IOSL oc D oc L oc * D(E) * o(E) (2.1)
2.1.2
Thermal Effects and Quenching
Besides optical stimulation, OSL material can be thermally stimulated [9, 22, 3]. Generally, the effect of higher temperatures is to destabilize the meta-stable states formed during the initial irradiation [9, 22]. Often, these states are destabilized through some non-radiative pathway [9] or during some time when the resultant lu-minescence is not detected [9, 22]. Both of these effects contribute to the thermal quenching of OSL materials. Seemingly counter-intuitive, an increase in temperature during optical stimulation can increased the observed signal since additional meta-stable states are destroyed during a period of observation [9]. These effects may be important to in vitro studies particularly if measurements are being done in both a room temperature and incubator environment. However, for A1203:C dosimeters,
the temperature difference required for noticeable thermal effects is much larger than discrepancy between these two environments. Figure 2-3 illustrates the relative tem-perature stability of the A120 3:C detectors in the experimental range. As seen from
Figure 2-3, both room temperature and the incubator are in a linear temperature re-sponse phase. Over the course of approximately 75 K (350 K to 425 K), the intensity of the material only drops off by 10% [9]. This would imply that the variation of 13 K (between room temperature and the incubator temperature) would cause at most a 1.7% variation in the reported dose.
2.1.3 Linearity
One powerful feature of A1203:C is the large linear range for OSL signal response
to incident radiation. The linear range extends from approximately 10 mrad up to 50 Gy. After 50 Gy, there is a saturation effect and non-linear calibration techniques must be used to extend the dynamic range of the material [9]. Figure 2-4 shows experimental confirmation of the linear response of the Al203:C dosimeters to doses
i
Ii
I
35 400 450 5 0o 550
Tepertus (K)
Figure 2-3: Part (a) of this figure depicts thermal quenching of the OSL signal in A1203:C. At higher and higher temperatures, more charges are reunited during periods
where the OSL is not being stimulated (and observed) or are being reunited through more non-radiative pathways. There is a general region of stability for A1203:C
materials through 400 K [9].
I I -.. ,
..
...
....
Figure 2-4: This figure depicts the linear Al203:C response to dose from 90Sr/90Y
0 decay. The linear range extends up to 50 Gy for this material. The "weak" and "strong" beam conditions refer to the intensity of laser light used to perturb the meta-stable states in the irradiated crystal. Under both reading conditions, the response is linear [9].
2.1.4
Landauer uStar Dot Dosimeters
The specific OSL dosimetry system used for this experiment was the InLight bStar Dot Dosimetry system (Landauer, Glenwood, IL). This system uses small A1203:C
chips, encased in plastic as the OSL material. To prevent any photo-bleaching from other light sources, the A120 3:C chips are always enclosed in this plastic slip except when being measured. Figure 2-5 is a representation of the A1203:C material. The
chips are approximately 0.75 cm in diameter and the plastic casing is approximately 2.5 cm by 1 cm in size. After irradiation (either at 37oC or at room temperature), the chips are read in a tabletop system that opens the plastic casing and exposes the dosimeter chip to pulses of laser light [33]. The resulting luminescent intensity is reported to Landauer software on an attached PC computer. The dots have been calibrated in a filtered 80 kVp x-ray field (average energy of 44 keV) [33]. After use, the dots are opened and photo-bleached on the FujiFilm IP Eraser (Stamford, CT).
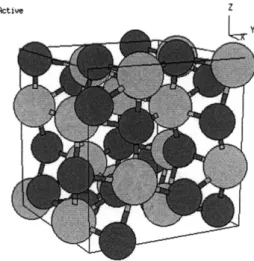
Active Z
Figure 2-5: Crystalline structure of A1203 with the aluminum ions in grey and the
oxygen ions in red. The general structure of the crystal is a series of interlocking
hexagons and octagons [13].
2.2
Experimental Setup
2.2.1
Decay Characteristics of the
241Am Sources
241
Americium is an alpha emitter with a half-life of 432.2 years. [21]. While tran-siting to the 237Np ground state, the Americium nucleus can be left in a variety of
promi-nent among the possible -y-rays, a 59.5 keV photon is observed in 35.9% of decays [21, 7]. The Neptunium nucleus can also be left in an excited state, which decays through internal conversion. Accordingly, there are a number of low energy X-rays and higher energy 7-rays associated with the decay of 241Am [7, 18]. Table 2.1 sum-marizes the photon energies that occur in more that 0.1% of all 241Am decays [21]. The predominant decay modes for 24 1Am are summarized in Figure 2-6.
Table 2.1: Photons associated with 241Am decay and present in at least 0.1% of all decays [21].
Photon Energy (keV) Source Branching Ratio (%)
11.871 Np L (1) 0.66 13.761 Np L (a2) 1.07 13.946 Np L (al) 9.6 15.861 Np L (h) 0.153 16.109 Np L (b6) 0.184 16.816 Np L (b2) 2.5 17.505 Np L (b5) 0.65 17.751 Np L (bl) 5.7 17.992 Np L (b3) 1.37 20.784 Np L (gl) 1.39 21.099 Np L (g2) 0.65 21.342 Np L (g3) 0.59 21.491 Np L (g6) 0.29 26.3448 241mAm 2.4 33.1964 241mAm 0.126 59.5412 241mAm 35.9
2.2.2
Physical Characteristics of the Americium Foils
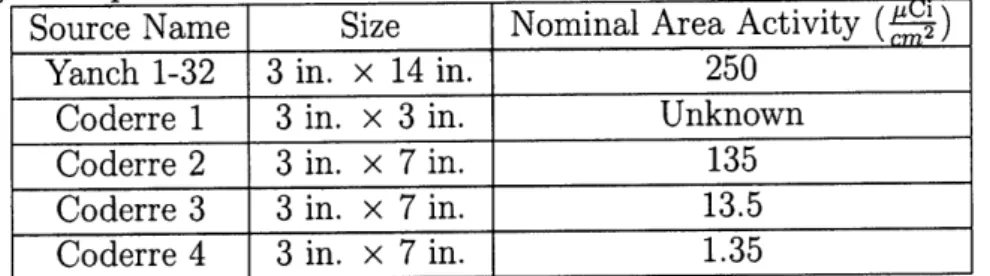
Five different radiological conditions were created through the use of sources pro-vided by Drs. Jacquelyn Yanch and Jeffrey Coderre. All sources, manufactured by NRD (Grand Island, NY), sandwiched 241Am powder between a series of gold,
palladium and silver sheets as illustrated in Figure 2-7.
The foils vary considerably in size and activity per unit area. Dr. Yanch/s foils, an
Figure 2-6: A decay scheme showing likely transitions for 241Am. The probabilities for each transition are given relative to all possible decays and all energies indicated are keV [18].
Figure 2-7: Schematic depiction of the 241Am foils manufactured by NRD, LLC. The
24 1Am powder is mixed with gold and sandwiched between gold, silver and
palla-dium foils. The varying composition and thickness of the surrounding material gives directionality to the radiation quality and dose-rate [45].
an area activity of 250 4. Most of Dr. Coderre/s four foils are 135 cm2 (one foil is 58 cm2) with reported nominal area activities of 135 , 13.5 -ci,', 1.35 ci, and one foil with unreported activity. The activity per area and dimensions of all the foils are summarized in Table 2.2.
~ I~ _~ 11_1~
Table 2.2: Summary of the physical characteristics and activities of all the foils in use during the experiment.
Source Name Size Nominal Area Activity ( U )
Yanch 1-32 3 in. x 14 in. 250 Coderre 1 3 in. x 3 in. Unknown Coderre 2 3 in. x 7 in. 135 Coderre 3 3 in. x 7 in. 13.5 Coderre 4 3 in. x 7 in. 1.35
2.2.3
Energy Spectra of the
241Am Sources
Owing to the similarities in composition and construction, the various Americium foils have very similar energy characteristics. As discussed earlier, the energy spectra are primarily composed of a mixture of 241Am ~-rays and 237Np x-rays.
Extrane-ous photon peaks have been linked to characteristics x-rays from the materials used to encase the sources. The energy spectra were measured using an X123 Si-PIN photodiode spectrometer (Amptek, Bedford, MA) and efficiency adjusted using an energy-efficiency table provided by Amptek [5]. The energy efficiency curve is shown in Figure 2-8. Figures 2-9, 2-10, 2-11, 2-12, and 2-13 are the energy spectra collected from the gold-side of all the 241Am foils. Some figures show the spectra for before and after the energy-efficiency correction is applied.
These collected energy spectra demonstrate conclusively the homogeneity of the energy spectrum across all the radiative foils used in this experiment. A common energy profile is important for isolating the biological effects due solely to a variable dose-rate.
The higher interaction probabilities of the lower energy x-rays compared to the 59.5 keV 7-ray allow for differing qualities of radiation to be observed depending on the distance from the foil through some moderator. That is, the energy spectrum of the source changes through any moderating material. This feature of the sources allows for the construction of doses which are predominately contributed by the 237Np x-rays or predominately composed of the 59.5 keV -y-ray. Figure 2-14 shows the
1 08
S0.6
10,4 - --- - - --0.2 0. 10 20 30 40 50 60 70 80 90 11 -0.2 Enlry (key)Figure 2-8: This curve shows the energy dependent efficiency correction that must be applied to raw spectra from the Amptek X123 Sn-PIN spectrometer. While the detector is highly efficient at very low energies, it has low efficiency much above 15 keV.
results a MCNP simulation, provided by Matthew Davidson, of the dose deposited by Americium 7-rays and Neptumium x-rays through various depths of polyethylene. The construction of a nearly mono-energetic 59.5 keV 7-ray source is demonstrated experimentally in Figure 2-15. Here, the gold side of the 24 1Am source was shielded
by 0.2 mm of lead before detection in the same X123 Sn-PIN diode detector described earlier. There is clear differential attenuation of the x-rays as compared to the 7-rays. The ability to create two distinct radiation qualities allows for studies that test the relative biological effect (RBE) of the x-rays as compared to the y-rays.
2.2.4
Dose-Rate Characterization
Two factors influencing the dose-rate to a target on the foils surface are the platels activity and the geometric considerations of the plate. The dose-rates measured from the center of the plates are summarized in Table 2.3. These dose-rates were measured using the pStar Dot Dosimeters (Landauer, Glenwood, IL) in polystyrene dishes on
2.00E+06 1.80E+06 1.60E+06 1.40E+06 1.20E+06 1.00E+06 8.00E+05 6.OOE+OS 6.00E+05 4.00E+05 2.00E+05 O.OOE+O0
-Emdwtcy Adjusted Counts ~ _ __~
- Efttemy Adjusted Counts - Unadutd Counts .--. . L L... - - - -- -- - - - -.. .- ... ....- -.... -.- ... -.- ... ... ... ...- ... ... ... - .. -... .... ... -... .. ... ... ... .. ... - ... - - ... .. ... ENerg (keY) omrv u V
Figure 2-9: Energy spectra of Dr. Yanchs 2 41Am foil (3 of 32). The spectrum was
collected on an Amptek X123 Sn-PIN spectrometer for 10 minutes. The raw counts (red) were corrected using the manufacturers energy-efficiency data to produce the adjusted spectrum (blue).
the gold surface of the foil over a period of ten days. The error in the dose-rate measurement, calculated explicitly in Equation 2.2, is a combination of the interdot
(aGrop) and intradot (Dot) errors (represented explicitly as the standard deviation of the group of measurements) as each plate was measured using multiple Dots and each Dot was measured multiple times:
U'Total = Group + Dott (2.2)
There is considerably less variation in the dose-rate of the plates than is suggested by the difference in the nominal activity per unit area. Moreover, the 7-ray dose-rates do not appear to be linearly correlated to the a-particle dose-rates measured by Dr. Rong Wang with a PIPS detector [27]. The cause of this discrepancy with the nominal activity is unknown and may rest on a misreporting by the manufacturer as to the
IRWI" N0% I p 14inC
2.50E+06 2.00E+06
S1.00E+06
5.00E+05 0 20 40 60 80 100 120 enemy (kmev)Figure 2-10: Energy spectrum from Dr. Coderre/S 241Am foil (Coderre-1). The
spectrum was collected on an Amptek X123 Sn-PIN spectrometer for 18 hours. The raw counts were corrected using the manufacturers energy-efficiency data to produce the adjusted spectrum (blue).
Table 2.3: Summary of the dose-rates measured from the interior of the 241Am foils
gold sides using the pStar Dot Dosimeter System. There are considerable discrepan-cies in the dose-rate both from the nominal activity provided by NRD and from the a-particle fluence measured by Dr. Rong Wang [27].
Source Name Nominal Area Activity 4 Dose-Rate (cGy/h) Dose-Rate Error (cGy/h) a Particule Flux
Yanch - 3/32 250 1.23 3.25 x 10x- N/A
Coderre I Unknown 4.86 x 10- 1 5.40 x 10-' 1162.05
Coderre 2 135 9.08 x 10- 3 3.90 x 10- 4 106.72
Coderre 3 13.5 3.30 x 10- 8.00 x 10- 4 12.9
Coderre 4 1.35 1.99 x 10- 6.10 x 10- 4 3.16
real activity of the plates. The discrepancy with the a-particle fluence measurements appears more serious since the underlying nuclear theory would predict that they two radiation types (photons and a-particles) would be linearly correlated to each other [7].
The dose-rate for the Yanch 3/32 foil, when shielded by 0.8 mm of lead was 6.89
+
.315 x 10- 3cGy/h as measured by the Dot dosimeters. As seen in Figure 2-15, this thickness of lead was sufficient to create a nearly mono-energetic 59.5 keV y-ray
4.50E+04 4.00E+04 3.50E+04 3.00E+04 2.50E+04 2.00E+04 1.50E+04 1.00E+04 5.00E+03 O.OOE+00 Q! V4 mm : Id ri - 9'. d i* (LU) 0 6v~ncdA 6 P ON *4.4 NN M V V In in a go110 mrgy NOV)
Figure 2-11: Energy spectrum from Dr. Coderrels 241Am foil (Coderre-2). The
spectrum was collected on an Amptek X123 Sn-PIN spectrometer for 30 minutes. The raw counts (red) were corrected using the manufacturers energy-efficiency data to produce the adjusted spectrum (blue).
source. This new source was used to qualitatively explore the RBE effect from the x-ray dominated and y-ray dominated spectra by comparing the clonogenic survival for cells exposed in each radiative field to the other.
The geometric variance in dose-rate arises from the fact that not all positions on the surface of the plate have the same apparent view of the radiation surface. That is, the finite size of the foil introduces variation in dose-rate across its surface. The solid angle is a quantitative measure of this effective change in the surface area of the radiative foil. The general relationship for the solid angle a surface subtends from a given point is given in Equation 2.3:
2=J// idS -r'
r3 (2.3)
- Efficdncy AdJusted Counts -UnQJuswted Counts
1.40E+05 1.20E+05 .OOE*04S . S.OOE+04 2.00E+04 0.00E+00 0 10 20 30 40 50 60 70 80 90 100 ergy (kev)
Figure 2-12: Energy spectrum from Dr. Coderre/s 241Am foil (Coderre-3). The
spectrum was collected on an Amptek X123 Sn-PIN spectrometer for 30 minutes. The raw counts were corrected using the manufacturers energy-efficiency data to produce the adjusted spectrum (blue).
Solving this integral for an arbitrary rectangle with width, w, length, 1, and height, h, from the arbitrary point (xo,yo) gives the relationship shown in Equation 2.4:
( - 2xo) (o - I)
(xzo, Yo) = - arctan
(
h x 4h2 + 12 + 4xo + 4(yo - )2 - 41 x Xo (1 + 2xo) (yo - ) arctan 2 h 4h2 + 12 + 4x + 4(yo -)2 + 41 x xo (1 - 2xo)(yo + ) arctan 2 hx 4h2 +12+4 2 + 4(yo+ W)2- 4l xo (1 + 2xo)(yo + -) arctan 2 h
V4h
2+12+4x+ 4(yo+
)2+41
xxo
(2.4)Using Matlab (The Mathworks, Natick, MA), the relationship in Equation 2.4 was used to develop a model of the solid angle seen at each point on the surface of the
241
3.50E+03 3.oo E+03 I . -. . . . . . . . . . . . . . 2.50E+03 I 2.00E+03 1,50E+03 S1.00E+03 5.00E+02 0.OOE+00 -5.00f+02 60 70 10 2 A S10 20 EnWgy (keV)
Figure 2-13: Energy spectrum from Dr. Coderre/S 241Am foil (Coderre-4). The
spectrum was collected on an Amptek X123 Sn-PIN spectrometer for 90 minutes. The raw counts were corrected using the manufacturer/s energy-efficiency data to produce the adjusted spectrum (blue). While the additional noise is due to the combination of low foil activity and a short measurement time, the underlying energy spectrum of this foil is the same as other foils.
Coderre-1 foil.
There is a 44% variation in the expected dose-rate between the edge of the plate and a position 0.15 inches (3.81 mm) inside the edge while there is only an 11% variation between the position 0.15 inches (3.81 mm) inside the plate and the middle of the foil. Experimental evidence confirms the modells conclusions. Dosimeters placed on the edge of Dr. Yanch/s 3/32 foil report a dose-rate of 1.150 ± 0.044 cGy/h. The p-value associated with the measurement of the interior dose-rate (1.234 ± 0.0325 cGy/h) with two degrees of freedom is less than 0.1. Images of one of Dr. Yanchts
24 1
Am foils taken previous by An Vu with a BAS Imaging Plates Type MS (FujiFilm, Stamford, CT) indicate that the dose-rate is consistent over the interior surface. One of these images is reproduced in Figure 2-17.
30 40 50
_ _ __ ___ __~_ __~~__ ___ _ ~~ _
-4E-13 3.5E-13 3E-13 ~ 50.5 k*V Only Am MeuVd X-M 2.5E-13 2E-13 1.5E-13 1E-13 5E-14 0 0 5 10 15 20 25 Depth (mm)
Figure 2-14: The dose per photon deposited at various depths of polyethylene by
241Am 59.5 keV y-rays, 237
Np x-rays and a mixed source of those two radiations all normalized to the same initial dose/photon value as estimated by an MCNP simu-lation. In the Figure, it is clear that the 237
Np x-rays are less penetrating and are preferentially moderated compared to the 241Am 7-rays. The 241Am plate sources are
a combination of these two radiations and behave as their weighted average. This Figure was produced and provided by Matthew Davidson.
It is worth noting that the edge effects predicted by the model are relatively modest over most of the surface of the foil (<11% dose-rate variation over 81% of the foil/s interior). In general, it was assumed that the interior dose rate was observed evenly across the entire plate. This assumption is strengthened by the fact that, even on the smaller foils, the active growth area of the T25 Falcon flasks used was offset at least a quarter inch from the edges of the foils. Finally, the model was computed using the smallest and most geometrically vulnerable source and should be considered at most a worst-case scenario.


![Table 2.1: Photons associated with 241 Am decay and present in at least 0.1% of all decays [21].](https://thumb-eu.123doks.com/thumbv2/123doknet/14752986.581071/37.915.243.671.399.765/table-photons-associated-decay-present-decays.webp)
![Figure 2-6: A decay scheme showing likely transitions for 241 Am. The probabilities for each transition are given relative to all possible decays and all energies indicated are keV [18].](https://thumb-eu.123doks.com/thumbv2/123doknet/14752986.581071/38.915.335.603.113.497/figure-transitions-probabilities-transition-relative-possible-energies-indicated.webp)