HAL Id: hal-00300874
https://hal.archives-ouvertes.fr/hal-00300874
Submitted on 12 Jan 2004HAL is a multi-disciplinary open access
archive for the deposit and dissemination of sci-entific research documents, whether they are pub-lished or not. The documents may come from teaching and research institutions in France or abroad, or from public or private research centers.
L’archive ouverte pluridisciplinaire HAL, est destinée au dépôt et à la diffusion de documents scientifiques de niveau recherche, publiés ou non, émanant des établissements d’enseignement et de recherche français ou étrangers, des laboratoires publics ou privés.
Investigation of Arctic ozone depletion sampled over
midlatitudes during the Egrett Campaign of
spring/summer 2000
D. E. M. Ross, J. A. Pyle, N. R. P. Harris, J. D. Mcintyre, G. A. Millard, A.
D. Robinson, R. Busen
To cite this version:
D. E. M. Ross, J. A. Pyle, N. R. P. Harris, J. D. Mcintyre, G. A. Millard, et al.. Investigation of Arctic ozone depletion sampled over midlatitudes during the Egrett Campaign of spring/summer 2000. Atmospheric Chemistry and Physics Discussions, European Geosciences Union, 2004, 4 (1), pp.141-168. �hal-00300874�
ACPD
4, 141–168, 2004 Investigation of Arctic ozone depletion sampled over midlatitudes D. E. M. Ross et al. Title Page Abstract Introduction Conclusions References Tables Figures J I J I Back CloseFull Screen / Esc
Print Version Interactive Discussion
© EGU 2004 Atmos. Chem. Phys. Discuss., 4, 141–168, 2004
www.atmos-chem-phys.org/acpd/4/141/ SRef-ID: 1680-7375/acpd/2004-4-141 © European Geosciences Union 2004
Atmospheric Chemistry and Physics Discussions
Investigation of Arctic ozone depletion
sampled over midlatitudes during the
Egrett Campaign of spring/summer 2000
D. E. M. Ross1, J. A. Pyle2, N. R. P. Harris2, 3, J. D. McIntyre2, G. A. Millard2, A. D. Robinson2, and R. Busen41
JMP Consultans, London, UK
2
Centre for Atmospheric Sciences, Department of Chemistry, University of Cambridge, Cambridge, UK
3
European Ozone Research Coordinating Unit, University of Cambridge, Cambridge, UK
4Deutsches Zentrum f ¨ur Luft- und Raumfahrt (DLR), Oberpfaffenhofen, Germany
Received: 3 November 2003 – Accepted: 12 December 2003 – Published: 12 January 2004 Correspondence to: D. E. M. Ross ([email protected])
ACPD
4, 141–168, 2004 Investigation of Arctic ozone depletion sampled over midlatitudes D. E. M. Ross et al. Title Page Abstract Introduction Conclusions References Tables Figures J I J I Back CloseFull Screen / Esc
Print Version Interactive Discussion
© EGU 2004
Abstract
A unique halocarbon dataset has been obtained using the Australian high altitude re-search aircraft, the Grob G520T Egrett, during May–June 2000 with GC instrument (DIRAC), which has been previously deployed on balloon platforms. The halocarbon data generally shows a good anticorrelation with ozone data obtained simultaneously
5
from commercial sensors. On 5 June 2000, at 380 K, the Egrett entered a high latitude tongue of air over the UK CFC-11 and O3data obtained on the flight show evidence of this feature. The dataset has been used, in conjunction with a 3D chemical transport model, to infer ozone depletion encountered in the midlatitude lower stratosphere dur-ing the flight. We calculate that ozone is depleted by 20% relative to its winter value
10
in the higher latitude airmass. A suite of ozone loss tracers in the model have been used to track ozone depletion according to location relative to the vortex and chemical cycle responsible. The model, initialised on 9 December, indicates that 50% of the total chemical ozone destruction encountered in June in the middle latitudes occurred between the 90–70◦N equivalent latitude band and that 70% was due to halogen
chem-15
istry.
1. Introduction
Total ozone values at northern midlatitudes were 3% lower in 1997–2001 than they had been before 1980 (WMO, 1993). The decline was not linear: a minimum occurred in 1993 since when there has been a modest increase. This contrasts with the behaviour
20
in the southern hemisphere, where total ozone is still decreasing; with 1997–2001 val-ues 6% lower than pre-1980 valval-ues. This illustrates the complexity of understanding ozone loss in the lower stratosphere as both chemical and dynamical factors are im-portant (Fahey et al., 1993; Solomon et al., 1996; Appenzeller et al., 2000). There are three principle mechanisms for chemically-driven ozone loss in the midlatitude lower
25
ACPD
4, 141–168, 2004 Investigation of Arctic ozone depletion sampled over midlatitudes D. E. M. Ross et al. Title Page Abstract Introduction Conclusions References Tables Figures J I J I Back CloseFull Screen / Esc
Print Version Interactive Discussion
© EGU 2004 in the cold temperatures of the polar vortex is advected out of the vortex and into the
sunlit midlatitudes where it causes ozone loss. Secondly, polar air, which has already experienced ozone depletion, may be advected into midlatitudes causing a dilution ef-fect. Alternatively, midlatitude ozone loss could be due to in-situ reactions occurring wholly at midlatitudes.
5
There are a variety of measurements and techniques available for the study of polar ozone loss. For example, the “Match” technique uses numerous ozone soundings in high latitudes, and calculated air parcel trajectories, to infer changes in ozone within individual air parcels (Rex et al., 1997; Rex et al., 2002). Tracer measurements can be used to infer ozone loss by the evolution of correlations in ozone with long-lived
10
gases, such as N2O or CFC-11 (Proffitt et al., 1990; Richard et al., 2002). These long-lived gases are good tracers, their concentrations remaining constant with dynamical motions. A change in their correlation with ozone can then be used to infer chemical destruction of ozone, although Plumb et al. (2000) noted that care must be taken to eliminate any mixing anomalies in the tracer-tracer relationships. In addition to these
15
measurement-based analyses of ozone loss, atmospheric models forced by meteo-rological and chemical observations have been used to investigate chemical ozone loss in polar regions (Chipperfield, 1999; Grooss et al., 2002). In contrast to the polar case, ozone loss in middle latitudes is generally much smaller than in polar latitudes and is much harder to detect and diagnose unambiguously. The study of midlatitude
20
ozone loss has been limited to statistical trend analyses and model-based investiga-tions (Hadjinicolaou et al., 1997; Logan et al., 1999; Weiss et al., 2001; Millard et al., 2003).
The 1999/2000 Arctic winter saw the largest ever combined campaign to investigate Arctic ozone loss processes, the SOLVE-THESEO 2000 campaign (Newman et al.,
25
2002). This winter was consistently cold and had more widespread temperatures below the PSC threshold than any other winter in the last 20 years with the largest ever local loss reported for the Arctic (Sinnhuber et al., 2000; Rex et al., 2002). Extensive denitrification occurred in the polar vortex (Fahey et al., 2001; Carslaw et al., 2002)
ACPD
4, 141–168, 2004 Investigation of Arctic ozone depletion sampled over midlatitudes D. E. M. Ross et al. Title Page Abstract Introduction Conclusions References Tables Figures J I J I Back CloseFull Screen / Esc
Print Version Interactive Discussion
© EGU 2004 and as a result, ozone losses were large during the winter and continued during the
final warming in mid-March (when temperatures had risen above the PSC threshold) due to the hindered reconversion of ClOx to ClONO2 (Sinnhuber et al., 2000). The vortex itself was stable until the final warming when it broke up with one substantial remnant present until April (Waugh and Rong 2002). DIRAC and DESCARTES, two
5
GC based instruments developed at the University of Cambridge, were deployed on several balloon flights within the Arctic vortex during the 1999/2000 winter to measure long-lived halocarbon species. Using changes in the CFC-11/O3correlations inside the polar vortex, we have used the DIRAC data to estimate ozone loss of around 40% at 440–470 K by early March 2000 (Robinson et al., submitted). These estimates agree
10
well with our calculations using the SLIMCAT model (Millard, 2002) and are similar to those of Richard et al. (2002) who used measurements of N2O and O3 made from the NASA ER-2 aircraft to show an accumulated ozone loss of 53% near 450 K by 12 March 2000.
Several studies have investigated the impact of the large polar ozone depletion of
15
1999/2000 on midlatitudes. Several studies have investigated the impact of the large polar ozone depletion of 1999/2000 on midlatitudes. Millard et al. (2003) used ozone budgeting tracers within a 3D chemical transport model to show that cold disturbed Arctic winters gave the largest contribution to midlatitude ozone loss, with 75% of mid-latitude ozone loss in April 2000 originating from the pole. The cold, well isolated vortex
20
of 1996/1997 had a much smaller impact on midlatitude ozone. Between 40% and 70% of midlatitude ozone loss was due to reactions with halogen species. Hauchcorne et al. (2002) used a high-resolution isentropic model to show that, for winters with a cold, strong vortex such as 1999/2000 there is relatively little filamentation of the vortex to midlatitudes. Nevertheless, Godin et al. (2002) used the same model and ozonesonde
25
data from a midlatitude site to estimate a 4% reduction of ozone between 400–500 K due to the transport of ozone-depleted, polar vortex air over the site during the win-ter. Marchand et al. (2003) expanded this work to show that, by April, 50% of ozone loss between 45–55◦N, at 475 K, had occurred in the vortex, i.e. had been mixed into
ACPD
4, 141–168, 2004 Investigation of Arctic ozone depletion sampled over midlatitudes D. E. M. Ross et al. Title Page Abstract Introduction Conclusions References Tables Figures J I J I Back CloseFull Screen / Esc
Print Version Interactive Discussion
© EGU 2004 midlatitudes. Considering the transport of polar air to midlatitudes after the breakup
of the vortex, Piani et al. (2001) showed that by the end of June 2000, above 420 K, most of the air contained in the polar vortex is mixed and transported to low latitudes. Below 420 K, however, it is confined to north of 50◦N by the subtropical jet. How-ever, these studies are limited to model-based investigations with some comparison to
5
ozonesonde data, and in the case of Piani et al. (2001) data obtained within the polar vortex during SOLVE-THESEO. As yet, no studies have used long-lived tracer data ob-tained in the middle latitudes to investigate middle latitude ozone loss and the mixing from the vortex.
This paper explores whether a unique dataset, similar to those used in the estimation
10
of ozone loss in the polar vortex, can be used to detect ozone loss, of Arctic origin, in the midlatitude lower stratosphere over the UK. Long-lived halocarbon and ozone measurements of the midlatitude lower stratosphere were obtained during the Egrett Campaign, held out of Boscombe Down, UK, during May–June 2000. These will be used, in conjunction with a 3D chemical transport model, to detect and investigate
15
ozone loss encountered in the midlatitude lower stratosphere.
Firstly, in Sect. 2, the Egrett Campaign will be discussed and, in particular, the flight of 5 June 2000. A brief description of the measurements and model used in the inves-tigations is given in Sect. 3. In Sect. 4, the synoptic situation on 5 June is discussed. The ozone/tracer relationships are combined with 3D model results to identify regions
20
of ozone-depleted air. A suite of tracers in the model is used to pinpoint the origin of the ozone loss and the chemical cycles responsible for the depletion. Finally, in Sect. 5, we ask what might have happened if we had been able to make similar measurements earlier in the year. Some conclusions are drawn in Sect. 6.
2. The Egrett campaign and 5 June flight 25
The Egrett Campaign consisted of 17 flights of the Airborne Research Australia Grob G520T Egrett aircraft during 6 weeks from 1 May 2000 to 6 June 2000. The Egrett is
ACPD
4, 141–168, 2004 Investigation of Arctic ozone depletion sampled over midlatitudes D. E. M. Ross et al. Title Page Abstract Introduction Conclusions References Tables Figures J I J I Back CloseFull Screen / Esc
Print Version Interactive Discussion
© EGU 2004 capable of carrying a payload of 750 kg to a maximum altitude of 15 km. Onboard the
aircraft throughout the campaign were a variety of instruments measuring turbulence, methane, ozone, water vapour and halocarbons. The principle aims were to study the effect of gravity waves, mixing and turbulence on the UTLS. An additional aim was to investigate ozone loss mechanisms in the very low stratosphere. The flight tracks
5
were designed to capture interesting features of the atmosphere on any particular day and, of 17 flights, 7 were designed for the study of mixing, ozone loss and larger scale waves and filamentation.
Shown in Fig. 1 is the flight track and altitude profile of the aircraft during the 5 June flight, one of the flights carried out to investigate the larger scale issues of mixing
10
and ozone loss. The aircraft ascended to a cruising altitude of 370 K and flew directly westwards over Ireland. It then ascended to a second cruise altitude of 385 K as it turned 180◦and flew directly eastwards back to Boscombe Down. This particular flight was the subject of a study by Bradshaw et al. (2002). They used ECMWF PV and wind fields to evaluate the synoptic situation on that day and identified a large intrusion of
15
subtropical tropospheric air, as characterised by Peters and Waugh (1996), off the west coast of Europe. This intrusion was caused by a large-scale Rossby wave breaking along the edge of the stratosphere. In addition to the subtropical intrusion, a large tongue of stratospheric air extended over France and Spain.
In their study, Bradshaw et al. (2002) used high-resolution measurements of
20
methane and ozone on 5 June 2000 to observe fine scale tracer filamentation. They proposed the fine scale structure in the dataset was caused by small-scale Rossby waves breaking on the flank of the larger wave feature described above.
Here we use data from two instruments, the University of Cambridge DIRAC in situ gas chromatograph (Robinson et al., 2000) measuring CFC-11 (CCl3F), CFC-12
25
(CF2Cl2), H-1211 (CF2BrCl) and CFC-113 (C2F3Cl3) and a UV photometer measuring ozone, also used by Bradshaw et al. (2002). These data are of much lower spatial and temporal resolution than the measurements used in the study by Bradshaw et al. (2002). However, the large subtropical intrusion and tongue of stratospheric air are
ACPD
4, 141–168, 2004 Investigation of Arctic ozone depletion sampled over midlatitudes D. E. M. Ross et al. Title Page Abstract Introduction Conclusions References Tables Figures J I J I Back CloseFull Screen / Esc
Print Version Interactive Discussion
© EGU 2004 evident in this dataset and in the model to be described below. Together these can be
used to investigate the impact of Arctic ozone loss on the middle latitudes on this day.
3. Instruments and model
DIRAC is a lightweight (21 kg) gas chromatograph designed for deployment on balloon and aircraft platforms. The instrument is described in detail in Robinson et al. (2000).
5
DIRAC has previously been deployed on 5 balloon flights during the SOLVE-THESEO 2000 campaign and was operated successfully on 16 flights of the Egrett. For air-craft operation, the instrument was simply adapted to take measurements at regular time intervals, instead of at predetermined pressures as in balloon operation. Typi-cally, DIRAC takes 2 min to collect and analyse a sample. On this aircraft platform this
10
corresponds to a horizontal resolution of approximately 3 km.
The DIRAC sampling system consists of a sample trap containing Carboxen adsor-bent, which is selective to halocarbons and so concentrates the atmospheric sample before analysis. A pump and flowmeter allow for a known volume of air to be con-centrated on the trap during sampling. After sampling, the trap is thermally desorbed
15
and the sample injected into a separation column and electron capture detector. The resulting chromatograms are stored and downloaded after the flight. A range of halo-carbons can be detected, and the system is optimized for CFC-11 with an accuracy of 2.9% related to the uncertainty of the standard gas used for calibrations. During the campaign, DIRAC was configured so that a sample was taken from the onboard
20
NOAA-CMDL calibration gas after a block of 5 atmospheric samples, allowing for very effective calibration. A sensitivity study has been carried out in the laboratory using the calibration gas to obtain a plot of mass of CFC-11 (pg) versus peak area. A quadratic fit applied to this plot is used to determine the mass of CFC-11 for each calibration chro-matogram obtained during the flights. As the volume of each sample is measured, a
25
volume mixing ratio can be obtained. For the calibration samples, these are compared to the known mixing ratio of the calibration gas and a sensitivity correction factor
cal-ACPD
4, 141–168, 2004 Investigation of Arctic ozone depletion sampled over midlatitudes D. E. M. Ross et al. Title Page Abstract Introduction Conclusions References Tables Figures J I J I Back CloseFull Screen / Esc
Print Version Interactive Discussion
© EGU 2004 culated. During the campaign, with a calibration sample obtained every 5 atmospheric
samples and a linear interpolation between the calibration before and after the block of atmospheric samples allows for a sensitivity correction factor to be applied to all sam-ples. In-flight precision can be determined from the standard deviation of the linear fit of mass of CFC-11 (pg) versus peak area for all the calibration samples obtained
5
during all flights. The precision is estimated to be 1.7%.
The ozone sensor used was a model TE-49C ultraviolet absorption spectrometer, manufactured by Thermo Environment Instruments Ltd., Franklin, Massachusetts and provided by the Deutches Zentrum fur Luft- und Raumfahrt (DLR). It produced slow ozone measurements with a response time of 10–20 s. For high resolution studies,
10
this dataset was modulated with a high frequency signal from a fast, yet less accurate, chemiluminescence sensor, also provided by DLR and capable of a response time of 200 ms. Here, for comparison with DIRAC, a running average over 60 s of the high resolution dataset was calculated. 60 s is the time for DIRAC to sample the desired volume in the stratosphere. The measurement at the time corresponding to the DIRAC
15
sample midpoint was then picked out from the 60s-averaged ozone dataset as the corresponding ozone measurement.
Modeling studies of all the Egrett flights have been carried out using the SLIMCAT 3D chemical transport model (Chipperfield, 1999; Millard et al., 2003). SLIMCAT is an offline model driven by daily ECMWF winds and temperatures on 18 isentropic levels
20
from 335–2700 K, with a horizontal resolution of 3.75◦×3.75◦. It uses the MIDRAD ra-diation scheme (Shine, 1987) to calculate cross-isentropic flow and the Prather second order moments scheme (Prather, 1986) to calculate tracer advection. The model con-tains a detailed stratospheric chemistry scheme with 49 chemical species and includes an equilibrium treatment of heterogeneous processes occurring on solid nitric acid
tri-25
hydrate particles, ice particles and liquid sulfate aerosols. All runs presented here are initialized on the 9 December 1999 and carried forward to June 2000.
In addition to the chemistry scheme, the model contains a suite of chemical and geographical ozone loss tracers, described in detail by Lee et al. (2001) and Millard et
ACPD
4, 141–168, 2004 Investigation of Arctic ozone depletion sampled over midlatitudes D. E. M. Ross et al. Title Page Abstract Introduction Conclusions References Tables Figures J I J I Back CloseFull Screen / Esc
Print Version Interactive Discussion
© EGU 2004 al. (2003). The chemical tracers track ozone depletion according to the chemical cycle
responsible, wherever it may have occurred, and follow destruction due to Cl2O2+ hv, ClO+ O, NO2+ O, HO2 + O3, ClO+ BrO, HO2 + ClO, HO2+ BrO and production by O2 + hv. The geographical tracers track ozone destruction, as a result of all cycles, by its location relative to the vortex. For that purpose, the Northern Hemisphere is
5
divided into 10◦ equivalent latitude bands over all levels. Ozone depletion within each latitude band is then calculated from the sum of the ozone destruction terms in the chemistry scheme. Both sets of tracers are cumulative from initialisation. These tracers have been used previously to indicate, for example, how much midlatitude ozone loss occurred in the vortex latitudes or due to halogen chemistry (Millard et al., 2003). They
10
are used for similar purposes here to track the origin of ozone destruction encountered during the campaign.
4. A case study of midlatitude ozone loss
4.1. Synoptic situation on 5 June 2000
Figure 2 shows an isentropic map from ECMWF of potential vorticity (PV) on the 380 K
15
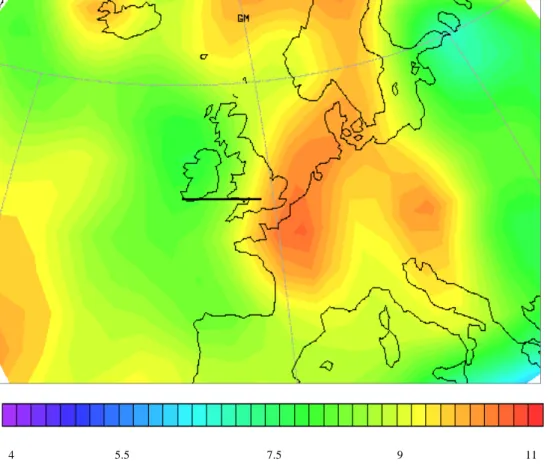
level at midday on the 5 June 2000, with a schematic of the Egrett flight track from Fig. 1 superimposed. The large subtropical intrusion and the tongue of higher latitude stratospheric air discussed in the previous section and described in detail by Bradshaw et al. (2002) can be seen in the PV map even at the low resolution of the model. Picturing the Egrett flight on that day (see Figs. 1 and 2), it would appear that, flying to
20
the west, the aircraft ascended in and then exited the tongue of high PV air, originating from the stratosphere at higher latitudes. Off the west coast of Ireland, it then entered a lower PV feature, originating from the subtropical tropopause, where it ascended once more before turning and re-entering the high PV tongue at a slightly higher altitude. This is supported by the data in Fig. 3, which show ozone and CFC-11 against flight
25
ACPD
4, 141–168, 2004 Investigation of Arctic ozone depletion sampled over midlatitudes D. E. M. Ross et al. Title Page Abstract Introduction Conclusions References Tables Figures J I J I Back CloseFull Screen / Esc
Print Version Interactive Discussion
© EGU 2004 from the PV field in the model. The data show a rise in CFC-11 (drop in ozone) as
the aircraft enters the younger, lower latitude air. The model appears to be a good representation of the data. It does not pick out the steepness of the gradients seen in the data, but this is to be expected at the T31, 3.75◦×3.75◦ horizontal resolution considered.
5
Also shown in Fig. 3 is a modeled passive ozone tracer, which has simply been advected since initialization in December 1999 and has not been subjected to chemical production or destruction reactions in the chemistry scheme. Just looking at the ozone dataset along the flight, it is not obvious whether we have sampled ozone-depleted air. In contrast, the difference between the modeled ozone (in good agreement with the
10
data) and the modeled passive ozone, which has undergone no chemistry, indicates that, in the model, there has been some chemical destruction of the ozone encountered on the flight path, especially in the higher equivalent latitude air. The next step is to investigate the tracer-tracer correlations, and see if they can be used to identify ozone loss.
15
4.2. Detecting midlatitude ozone loss
As discussed earlier, ozone loss is often inferred from a change in correlation between ozone and an inert tracer, such as CFC-11 or N2O (Proffitt et al., 1990). For exam-ple, this technique has been used to quantify loss in the Arctic vortex of 2000, which was well mixed and isolated between January and early-March. Ozone loss can be
20
detected by taking the difference in O3/CFC-11 correlation before (e.g. a reference, undepleted correlation in January) and after the return of sunlight. Peak ozone losses of 53% have been calculated for the Arctic lower stratosphere using a tracer dataset (Richard et al., 2002). For the Egrett dataset to be used to infer ozone loss in middle latitudes from a change in CFC-11/O3correlation, we clearly would also need a
refer-25
ence, a measurement of the correlation before loss occurred. No such measurement was obtained during the Egrett campaign, as time scales for ozone loss at middle lat-itudes are long and the campaign is short. However, we have a model with a passive
ACPD
4, 141–168, 2004 Investigation of Arctic ozone depletion sampled over midlatitudes D. E. M. Ross et al. Title Page Abstract Introduction Conclusions References Tables Figures J I J I Back CloseFull Screen / Esc
Print Version Interactive Discussion
© EGU 2004 ozone tracer that has undergone no chemistry and has simply been advected since
initialization. Also, there were measurements of CFC-11 and ozone taken in the Arctic vortex earlier in the year during the winter campaign, before any loss occurred. We show next that these can be used together to infer a CFC-11/O3 correlation before chemical destruction for comparison with the Egrett dataset.
5
Figure 4a shows model correlations of CFC-11 against passive ozone for the time and location of three flights: (1) a flight of the NASA-ER2 aircraft on 14 January 2000 made within the Arctic vortex during SOLVE-THESEO 2000, (2) a profile from a DIRAC balloon flight on 19 January 2000 also made within the Arctic vortex during SOLVE-THESEO 2000 and (3) the Egrett flight on 5 June 2000. In addition to the model
10
correlations, CFC-11 and ozone correlations from the data obtained on the two Arctic vortex flights in January are also shown. There are two points to note from this figure. Firstly, the passive O3/CFC-11 model correlation in January matches the January data well, and is therefore seems to be a true representation of the correlation before sig-nificant ozone loss. Secondly, the passive O3/CFC-11 correlation in the Arctic during
15
January is the same as the passive O3/CFC-11 correlation over the UK in June, and so may still be considered an appropriate reference for the correlation before ozone loss has occurred. So, although we do not have a measured reference correlation from the Egrett campaign, the comparison of winter time data and model correlations validates the use of the model passive correlation as a reference.
20
Figure 4b shows the modeled correlations of CFC-11 against passive and chemical ozone for the time and location of the Egrett flight on 5 June 2000. Also shown here is the data correlation obtained by DIRAC and the ozone sensor during that flight. The modeled chemical O3/CFC-11 correlation is in good agreement with the data and a comparison with the modeled passive O3/CFC-11 correlation (the correlation before
25
any chemical ozone loss had occurred) indicates that ozone loss was indeed encoun-tered on the flight track of the 5 June 2000. The amount of ozone loss inferred is approximately 200 ppbv ozone loss (i.e. a 20% decline from the expected midwinter undepleted ozone) at the 200 pptv CFC-11 level, corresponding to an altitude of 380 K
ACPD
4, 141–168, 2004 Investigation of Arctic ozone depletion sampled over midlatitudes D. E. M. Ross et al. Title Page Abstract Introduction Conclusions References Tables Figures J I J I Back CloseFull Screen / Esc
Print Version Interactive Discussion
© EGU 2004 on 5 June 2000. Note in passing that the scatter about the reference profiles (Fig. 4a)
is much smaller than the calculated ozone loss (Fig. 4b), further validating the use of the model reference.
4.3. Attributing the mechanisms behind ozone loss
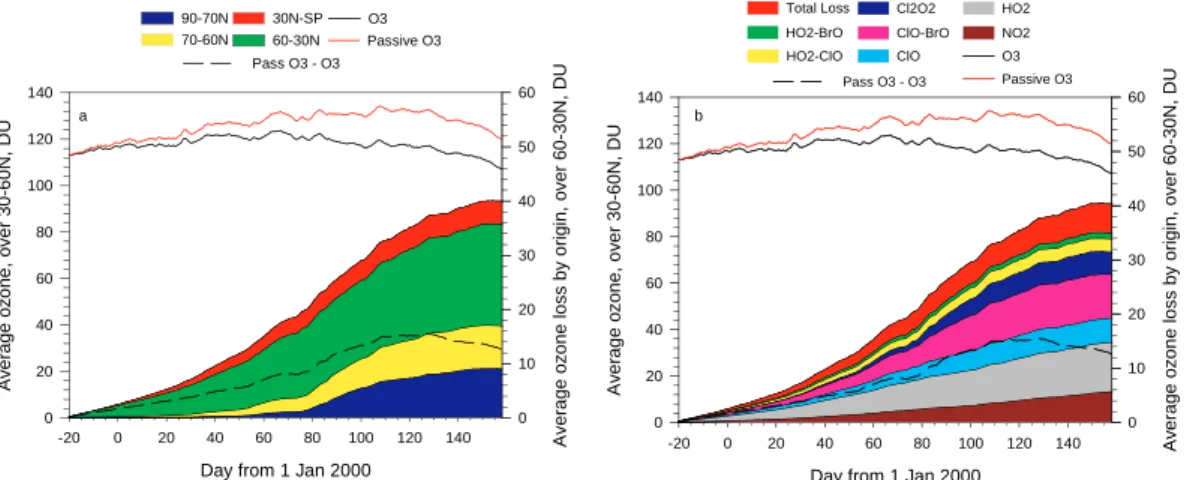
Figure 5 shows the contributions to the model ozone loss found in the midlatitude
5
partial column between 342–510 K and between model equivalent latitudes contours 30–60◦N, as in Millard et al. (2003). Figure 5a breaks down the ozone loss in the partial midlatitude column according to the region in which the ozone loss occurred and Fig. 5b shows the contributions of individual cycles to the ozone loss. Ozone depletion occurring in polar regions has a marked influence on the modelled ozone
10
loss at midlatitudes after the final warming and break-up of the vortex on around day 80 (Fig. 5a). By 5 June (day 157), depletion that has occurred in the polar region (90–70◦N and 70–60◦N bands) accounts for ∼45% of the total ozone depletion in the midlatitude partial column. Similarly, until day 80 there is little contribution to ozone loss from the Cl2O2cycle (Fig. 5b) as the loss from this cycle would be contained within the
15
polar vortex. This cycle is only expected to be active in the polar vortex due its the strong temperature dependence and quadratic dependency on the ClO concentration. Therefore it can be used as a marker for polar ozone depletion. After day 80, ozone depletion due to the Cl2O2cycle is present in the midlatitude partial column.
When these tracers are output along the flight track it can be seen that, as expected,
20
the higher PV (latitude) air encountered at the beginning and end of the flight shows the greatest ozone depletion (Fig. 6). Along the flight track, a substantial portion (∼50%) of the chemical ozone depletion has come from high latitudes, 90–70◦N, which would have included the polar vortex earlier in the winter (Fig. 6a). However, some of the ozone loss in the high PV air occurred within the midlatitude bands as well, with
ap-25
proximately 20% of the total chemical loss coming from the region between 60–30◦N equivalent latitude. In the polar vortex, the Cl2O2 and ClO-BrO cycles are active in a roughly 1:1 ratio and this can be seen in Fig. 6b (ClO-BrO is slightly more dominant as
ACPD
4, 141–168, 2004 Investigation of Arctic ozone depletion sampled over midlatitudes D. E. M. Ross et al. Title Page Abstract Introduction Conclusions References Tables Figures J I J I Back CloseFull Screen / Esc
Print Version Interactive Discussion
© EGU 2004 it is active in midlatitudes, see also Millard et al., 2003). Both cycles combined account
for approximately 50% of the chemical ozone destruction encountered along the flight track.
It should also be noted that, although the higher latitude airmass sampled at the beginning and end of the flight has greater net ozone loss, the chemical loss within
5
the lower latitude airmass also has a 50% contribution from high latitudes. Production by O2photolysis balances the loss such that there is negligible net ozone loss in this airmass, but evidently the model appears to have efficiently mixed the polar vortex into the midlatitude domain by 5 June 2000.
A novelty of the cycle tracers is that ozone loss due to halogen chemistry alone can
10
be calculated, by simply summing the ozone destruction occurring due to all cycles containing halogens. Halogens have very few natural sources in the stratosphere, so this is a good approximation of the impact of manmade pollutants containing halogens. For the flight on 5 June 2000, approximately 70% of the ozone destruction encountered was caused by halogen chemistry.
15
In order to investigate whether the analysis of the 5 June flight shown in Fig. 6 is typical of the midlatitude domain or unique to this local event, the zonal mean values at 52◦N and 380 K have been evaluated. As can be seen from Fig. 7, the zonal mean values are indeed consistent with those for the 5 June flight track. 50% of the ozone destruction at 52◦N has come from high latitudes (90–70◦N), and 70% of the ozone
20
destruction was due to halogen chemistry.
Figure 7 shows an interesting time development on the 380 K surface, which can be contrasted with the behaviour integrated through the lower stratosphere (342–510 K) shown in Fig. 5. In Fig. 7, in the lowermost stratosphere, the ozone loss increases steadily from January onwards up to day 80 and arises mainly from halogen cycles,
25
mostly from the higher polar latitudes (90–70◦N). (Day 80 is when the vortex warmed and started to breakdown, and when the low temperature (dimer cycle) polar loss would have stopped). In contrast, the ozone loss integrated through the lower stratosphere (Fig. 5) arising from polar latitudes grows only slowly up to day 80. So, the middle
ACPD
4, 141–168, 2004 Investigation of Arctic ozone depletion sampled over midlatitudes D. E. M. Ross et al. Title Page Abstract Introduction Conclusions References Tables Figures J I J I Back CloseFull Screen / Esc
Print Version Interactive Discussion
© EGU 2004 latitude loss before day 80 confined to the lowermost stratosphere is mainly of polar
origin and occurs through gradual, efficient mixing in the subvortex region (Haynes and Shuckburgh 2000). It seems that during this period the polar subvortex is supplied with ozone-depleted air from above.
After about day 80 the transport characteristics change. There is now a much more
5
efficient mixing at higher altitudes in the lower stratosphere (note the rapid increase in Fig. 5) while at the same time the increase in loss in the lowermost stratosphere (380 K, see Fig. 7) decreases. So, if we think of a model for transport of ozone-depleted air in the middle latitudes we can identify two regions. First, before the breakdown of the vortex (accompanied by a rise in temperature and cessation of polar ozone loss),
10
ozone depleted air is transported to middle latitudes via descent in the vortex and then effiecient mixing in the subvortex region (below ∼400 K). After the vortex breakdown, the model results indicate that this route is short-circuited and that there is instead very efficient mixing at somewhat higher altitudes.
5. Hypothetical flight of 5 April 2000 15
The ozone loss encountered on the flight 5 June 2000 is modest in comparison the large ozone loss measured in the 1999/2000 polar vortex, e.g. (Rex et al., 2002). How-ever, had the Egrett campaign been held a few months earlier, and measurements made in late Spring, the ozone loss encountered over the UK may have been greater. In order to investigate the ozone loss that would have been encountered during an
ear-20
lier campaign, a model experiment has been conducted in which we assume the Egrett flew on exactly the same flight path as 5 June 2000, but 2 months earlier on 5 April 2000. At this time, the vortex had split but a very clear remnant remained (Manney and Sabutis 2000). An isentropic map of PV from ECMWF shows a clear tongue of very high PV air over the UK (Fig. 8). Similar to the real flight of 5 June, the aircraft would
25
have ascended in this tongue and flown westwards into a region of lower PV before ascending to a slightly higher altitude and re-entering the high PV tongue.
ACPD
4, 141–168, 2004 Investigation of Arctic ozone depletion sampled over midlatitudes D. E. M. Ross et al. Title Page Abstract Introduction Conclusions References Tables Figures J I J I Back CloseFull Screen / Esc
Print Version Interactive Discussion
© EGU 2004 As before SLIMCAT has been run with the chemical and geographical ozone loss
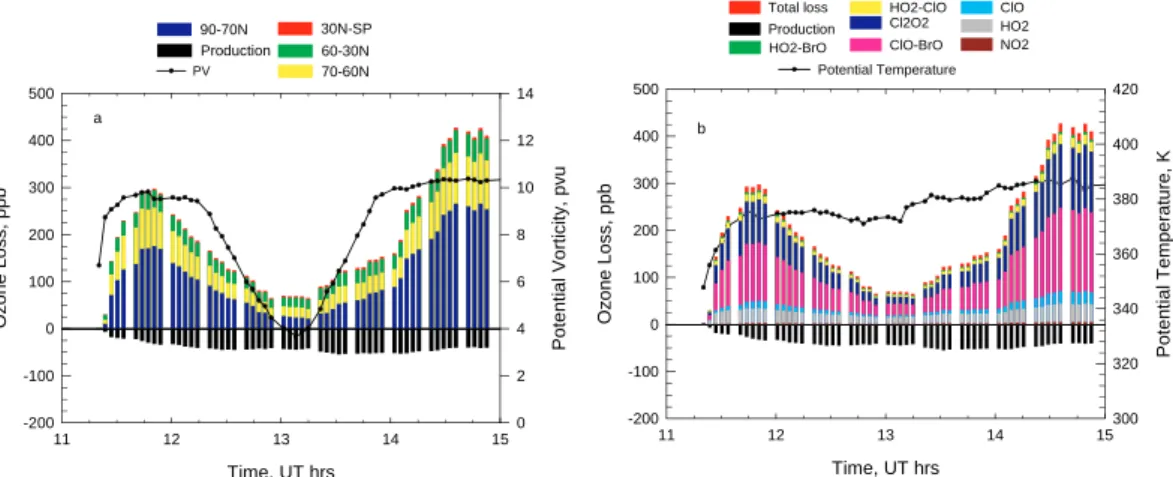
tracers. The model ozone loss tracers output on the flight track for 5 April 2000 (Fig. 9) show a much greater ozone loss in the higher PV airmass than the lower PV airmass, as was seen in the flight on 5 June (Fig. 6). When the contributions are considered, approximately 60% of the ozone destruction on the 5 April flight track has come from
5
the 90–70◦N equivalent latitude band (Fig. 9a). Compared to the flight on the 5 June 2000, there is a lot less contribution from ozone loss occurring between 60–30◦N, i.e. within the midlatitude domain. In April, midlatitude lower stratosphere ozone loss is dominated by polar depletion but, by June, the slower ozone loss occurring in-situ (be-tween 60–30◦N) is also important. The cycle tracers confirm this (Fig. 9b) with a high
10
proportion of the chemical destruction in the high latitude airmass due to the dimer cycle and ClO-BrO. 85% of the ozone depletion in the high latitude airmass is due to halogen chemistry. There is therefore a much more polar signature to the ozone de-struction in the higher PV airmass on the 5 April flight track than on 5 June 2000. It follows that there has been less mixing between the vortex and midlatitudes by 5 April
15
2000. By 5 June 2000, the lower latitude air encountered on the flight track showed ∼50% contribution to ozone destruction from high latitudes (although production bal-anced this effect). For 5 April, the lower latitude air has only ∼35% contribution from high latitudes. In addition, approximately 20% of the ozone destruction in the lower latitude airmass is due to the midlatitude HO2 cycle but this cycle contributes much
20
less (∼5%) in the higher latitude airmass which is dominated by polar chemistry. The model shows that for this hypothetical flight in April 2000, in agreement with the work discussed previously, processes that have occurred at the pole dominate ozone depletion in the midlatitude lower stratosphere. Up to 85% of all depletion is due to halogen chemistry, and 60% comes from the 90–70◦N equivalent latitude bands. By
25
June 2000 however, the model shows that the polar vortex has mixed down into midlati-tudes, with the midlatitude domain having an average contribution to ozone destruction from the polar region of 50% and from halogen chemistry of 70%. This is consistent with the cessation of polar vortex chemistry, dominated by halogen cycles, and the
ACPD
4, 141–168, 2004 Investigation of Arctic ozone depletion sampled over midlatitudes D. E. M. Ross et al. Title Page Abstract Introduction Conclusions References Tables Figures J I J I Back CloseFull Screen / Esc
Print Version Interactive Discussion
© EGU 2004 increase of importance of the natural HOxand NOxcycles at midlatitudes.
6. Conclusions
A unique dataset was gathered during an aircraft campaign held in early summer 2000 out of the UK. The Egrett high altitude aircraft carried out 17 flights in the middle lat-itude upper-troposphere and lower stratosphere with a detailed instrument payload.
5
The DIRAC instrument was successfully deployed on 16 flights of the Egrett during the campaign. This was the first deployment from an aircraft platform and reliable halo-carbon data were retrieved showing a good anti-correlation with ozone data obtained simultaneously from a commercial sensor. A 3D chemical transport model was used to output modeled CFC-11, ozone and a passive ozone tracer at the time and location of
10
the Egrett flight track of 5 June 2000. The DIRAC CFC-11 data, ozone data and model output are in good agreement.
In order to use the data and the tracer-tracer method to infer ozone depletion, a reference of the O3/CFC-11 correlation before any chemical ozone loss occurred was obtained. Using the modeled passive ozone tracer and data from the Arctic vortex in
15
January we showed that the model passive O3/CFC-11 correlation along the flight track was an acceptable reference. 20% ozone depleted air (relative to a passive reference ozone field) was detected on the flight track within the high PV airmass. Using a suite of ozone loss tracers that track depletion according to location and the chemical cycle responsible, we showed that 50% of the total chemical loss encountered in the
midlat-20
itude lowermost stratosphere was of high latitude origin (90-70◦N equivalent latitude). 70% of the total chemical loss was due to halogen chemistry. A time series of the contributions to ozone depletion at 52◦N and 380 K showed that the middle latitude lower stratosphere was exposed to ozone loss occurring in the polar vortex throughout the winter and not just after the break up of the vortex. This arises from transport in a
25
subvortex region below the vortex edge barrier. After the breakup of the vortex there is effective mixing of ozone-depleted air at higher altitudes.
ACPD
4, 141–168, 2004 Investigation of Arctic ozone depletion sampled over midlatitudes D. E. M. Ross et al. Title Page Abstract Introduction Conclusions References Tables Figures J I J I Back CloseFull Screen / Esc
Print Version Interactive Discussion
© EGU 2004 The model results for a hypothetical flight 2 months earlier show a polar remnant
would have been sampled over the UK. In April, this airmass retained a much more polar signature with 30% ozone depleted air encountered and 60% of the total chemical ozone loss occurring in high latitudes (90–70◦N). The contribution to ozone loss from the dimer cycle and other halogen cycles were much higher at 85%. Again, lower
5
latitude air was also sampled along the flight track. The model captures less mixing between the vortex and midlatitudes by April, as the chemical loss in the lower latitude airmass has much less contribution from high latitudes and polar processes compared to the lower latitude airmass encountered on the 5 June 2000.
Acknowledgements. The authors thank NERC for their support of the Egrett campaign and of
10
the subsequent analysis of the measurements. D. Ross has been the recipient of a NERC studentship, and the campaign activities were supported through the Aircraft Measurements of Atmospheric Tracers in the UTLS project of the NERC UTLS OZONE programme. N. Harris thanks the European Commission Research DG for support through the CRUSOE-II concerted action (EVK2-CT-2001-20012). We thank J. Whiteway, G. Vaughan and their groups at Univer-15
sity of Wales at Aberystwyth and the pilots and crew of the Egrett for their efforts during the campaign as well as the personnel at Boscombe Down. Lastly, we thank all at ARA-Airborne Research Australia was established with funding from the Major National Research Facilities Program of the Commonwealth of Australia.
References 20
Appenzeller, C., et al.: North Atlantic Oscillation Modulates Total Ozone Winter Trends, Geo-phys. Res. Lett., 27, 1131–1134, 2000.
Bradshaw, N. G., et al.: Tracer Filamentation Generated by Small-Scale Rossby Wave Breaking in the Lower Stratosphere, J. Geophys. Res., 107, 4689–4713, 2002.
Carslaw, K. S., et al.: A Vortex Scale Simulation of the Growth and Sedimentation of Large 25
Nitric Acid Hydrate Particles, J. Geophys. Res., 107, 8300–8316, 2002.
Chipperfield, M.: Multiannual Simulations with a Three-Dimensional Chemical Transport Model, J. Geophys. Res., 104, 1781–1805, 1999.
ACPD
4, 141–168, 2004 Investigation of Arctic ozone depletion sampled over midlatitudes D. E. M. Ross et al. Title Page Abstract Introduction Conclusions References Tables Figures J I J I Back CloseFull Screen / Esc
Print Version Interactive Discussion
© EGU 2004
Fahey, D. W., et al.: The Detection of Large HNO3-Containing Particles in the Winter Arctic Stratosphere, Science, 291, 1026–1031, 2001.
Fahey, D. W., et al.: In Situ Measurements Constraining the Role of Sulphate Aerosols in Mid-Latitude Ozone Depletion, Nature, 363, 509–514, 1993.
Godin, S., et al.: Influence of Arctic Polar Ozone Depletion on Lower Stratospheric Ozone 5
Amounts at Haute-Provence Observatory (43.9◦n, 5.71◦e), J. Geophys. Res., 107, 8272– 8283, 2002.
Grooss, J.-U., et al.: Simulation of Ozone Depletion in Spring 2000 with the Chemical La-grangian Model of the Strtosphere (Clams), J. Geophys. Res., 107, 8295–8311, 2002. Hadjinicolaou, P., et al.: Effect of Interannual Meteorological Variability on Midlatitude O3, Geo-10
phys. Res. Lett., 24, 2993–2996, 1997.
Hauchcorne, A., et al.: Quantification of Transport of Chemical Constitudents from the Polar Vortex to Midlatitudes in the Lower Stratosphere Using the High Resolution Advection Model Mimosa and Effective Diffusivity, J. Geophys. Res., 107, 8289–8302, 2002.
Haynes, P. H. and Shuckburgh, E. F.: Effective Diffusivity as a Diagnostic of Atmospheric Trans-15
port Part 1 – Stratosphere, J. Geophys. Res., 105, D18, 22 777–22 794, 2000.
Lee, A. M., et al.: The Impact of the Mixing Properties within the Antarctic Stratospheric Vortex on Ozone Loss in Spring, J. Geophys. Res., 106, 3203–3211, 2001.
Logan, J. A., et al.: Trends in the Vertical Distribution of Ozone: A Comparison of Two Analyses of Ozonesonde Data, J. Geophys. Res., 104, 26 373–26 399, 1999.
20
Manney, G. L. and Sabutis, J. L.: Development of the Polar Vortex in the 1999–2000 Arctic Winter Stratosphere, Geophys. Res. Lett., 27, 2589–2592, 2000.
Marchand, M., et al.: Influence of Polar Ozone Loss on Northern Midlatitude Regions Estimated by a High-Resolution Chemistry Transport Model, J. Geophys. Res., 108, 8326–8337, 2003. Millard, G. A.: Numerical Modelling of Polar and Middle Latitude Ozone Loss, Atmospheric 25
Chemistry, Cambridge, 2002.
Millard, G. A., et al.: Quantification of the Polar Contribution to Mid-Latitude Ozone Loss, J. Geophys. Res., 108, 8323–8337, 2003.
Newman, P. A., et al.: An Overview of the Solve-Theseo 2000 Campaign, J. Geophys. Res., 107, 2002.
30
Peters, D. and Waugh, D. W.: Influence of Barotropic Shear on the Poleward Advection of Upper Tropospheric Air, J. Atmosp. Sc., 53, 3013–3031, 1996.
ACPD
4, 141–168, 2004 Investigation of Arctic ozone depletion sampled over midlatitudes D. E. M. Ross et al. Title Page Abstract Introduction Conclusions References Tables Figures J I J I Back CloseFull Screen / Esc
Print Version Interactive Discussion
© EGU 2004
Vortex in Spring/Summer 2000, J. Geophys. Res., 107, 8270, 2001.
Plumb, R. A., et al.: The Effects of Mixing on Tracer Relationships in the Polar Vortices. J. Geophys. Res., 105, D8, 10 047–10 062, 2000.
Prather, M. J.: Numerical Advection by Conservation of Second-Order Moments. J. Geophys. Res., 91, 6671–6681, 1986.
5
Proffitt, M. H., et al.: Ozone Loss Inthe Arctic Polar Vortex Inferred from High-Altitude Aircraft Measurements, Nature, 347, 31–36, 1990.
Pyle, J. A., et al.: Early Modelling Results from the Sesame and Ashoe Campaigns, Faraday Discussions, 100, 371–387, 1995.
Rex, M., et al.: Chemical Depletion of Arctic Ozone in Winter 1999/2000, J. Geophys. Res., 10
107, 2002.
Rex, M., et al.: Prolonged Stratospheric Ozone Loss in the 1995–1996 Arctic Winter, Nature, 389, 835–838, 1997.
Richard, E., et al.: Severe Chemical Ozone Loss inside the Arctic Polar Vortex During Winter 1999–2000 Inferred from in Situ Airborne Measurements. Geophys. Res. Lett., 28, 2197– 15
2200, 2002.
Robinson, A. D., et al.: A Lightweight Balloon-Borne Gas Chromatograph for in-Situ Measure-ments of Atmospheric Halocarbons, Rev. Scient. Instr., 71, 4553–4560, 2000.
Robinson, A. D., et al.: Ozone Loss Derived from Balloon-Borne Tracer Measurements and the Slimcat Ctm., J. Geophys. Res., (submitted).
20
Shine, K. P.: The Middle Atmosphere in the Absence of Dynamical Heat Fluxes, Quart. J. Royal Met. Soc., 113, 603–633, (1987).
Sinnhuber, B.-M., et al.: Large Loss of Total Ozone During the Arctic Winter of 1999/2000. Geophys. Res. Lett., 27, 3473–3476, 2000.
Solomon, S., et al.: The Role of Aerosol Variations in Anthropogenic Ozone Depletion at 25
Northrn Midlatitudes, J. Geophys. Res., 101, 6713–6727, 1996.
Waugh, D. W. and Rong, P.-P.: Interannual Variability in the Decay of Lower Stratospheric Arctic Vortices, J. Met. Soc. Jap., 80, 997–1012, 2002.
Weiss, A. K., et al.: Chemical and Dynamical Contributions to Ozone Profile Trends of the Payerne (Switzerland) Balloon Soundings, J. Geophys. Res., 106, 22 685–22 694, 2001. 30
ACPD
4, 141–168, 2004 Investigation of Arctic ozone depletion sampled over midlatitudes D. E. M. Ross et al. Title Page Abstract Introduction Conclusions References Tables Figures J I J I Back CloseFull Screen / Esc
Print Version Interactive Discussion © EGU 2004 Longitude, ° -12 -10 -8 -6 -4 -2 0 2 L a ti tu d e , ° 49 50 51 52 53 54 55 56 11:06 11:20 11:40 12:00 12:20 12:41 12:54 13:08 13:24 13:41 14:02 14:12 14:22 14:42 14:52 15:06 15:16 Time, UT hrs 11 12 13 14 15 P o te n ti a l T e m p e ra tu re , K 300 320 340 360 380 400 a b
Figure 1 - (a) Egrett flight track on 5th June 2000, labelled with time stamps of DIRAC measurements during flight (UT). The flight can be divided into two legs, westwards and eastwards.
(b) Altitude profile of the Egrett flight on 5th June 2000 plotted against time. The aircraft ascended to 390 K at 1300 hours. From (a), the aircraft was about to begin the eastwards flight leg.
Fig. 1. (a) Egrett flight track on 5 June 2000, labelled with time stamps of DIRAC measurements
during flight (UT).The flight can be divided into two legs, westwards and eastwards.(b) Altitude
profile of the Egrett flight on 5 June 2000 plotted against time. The aircraft ascended to 390 K at 13:00. From (a), the aircraft was about to begin the eastwards flight leg.
ACPD
4, 141–168, 2004 Investigation of Arctic ozone depletion sampled over midlatitudes D. E. M. Ross et al. Title Page Abstract Introduction Conclusions References Tables Figures J I J I Back CloseFull Screen / Esc
Print Version Interactive Discussion
© EGU 2004 Figure 2. ECMWF potential vorticity map on the 380 K isentrope on 5th June 2000. The flight track is
superimposed as a schematic to give an idea of the airmasses encountered during the flight.
4 5.5 7.5 9 11
4 5.5 7.5 9 11
Fig. 2. ECMWF potential vorticity map on the 380 K isentrope on 5 June 2000. The flight track
is superimposed as a schematic to give an idea of the airmasses encountered during the flight.
ACPD
4, 141–168, 2004 Investigation of Arctic ozone depletion sampled over midlatitudes D. E. M. Ross et al. Title Page Abstract Introduction Conclusions References Tables Figures J I J I Back CloseFull Screen / Esc
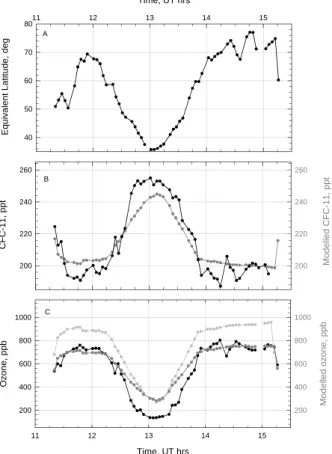
Print Version Interactive Discussion © EGU 2004 M o d e lle d C F C -1 1 , p p t 200 220 240 260 C F C -1 1 , p p t 200 220 240 260 Time, UT hrs 11 12 13 14 15 O z o n e , p p b 200 400 600 800 1000 M o d e lle d o z o n e , p p b 200 400 600 800 1000 Time, UT hrs 11 12 13 14 15 E q u iv a le n t L a ti tu d e , d e g 40 50 60 70 80
Figure 3 - (a) Modeled equivalent latitude, determined by the potential vorticity field. (b) Modeled CFC-11 (grey) and measured CFC-11 (black) from DIRAC. (c) Modeled passive ozone (light grey), chemical ozone (grey) and measured ozone (black) from the commercial ozone sensor. All model data have been interpolated onto the time and location of the Egrett flight on 5th June 2000.
A
B
C
Fig. 3. (a) Modeled equivalent latitude, determined by the potential vorticity field. (b) Modeled
CFC-11 (grey) and measured CFC-11 (black) from DIRAC.(c) Modeled passive ozone (light
grey), chemical ozone (grey) and measured ozone (black) from the commercial ozone sensor. All model data have been interpolated onto the time and location of the Egrett flight on 5th June 2000.
ACPD
4, 141–168, 2004 Investigation of Arctic ozone depletion sampled over midlatitudes D. E. M. Ross et al. Title Page Abstract Introduction Conclusions References Tables Figures J I J I Back CloseFull Screen / Esc
Print Version Interactive Discussion © EGU 2004 CFC-11, ppt 180 200 220 240 260 O z o n e , p p b 0 200 400 600 800 1000
5th June passive ozone Model ER2 passive ozone, Jan 2000 ER2 data, Jan 2000
DIRAC data, Jan 2000
Model DIRAC passive ozone, Jan 2000
CFC-11, ppt 180 200 220 240 260 O z o n e , p p b 0 200 400 600 800 1000
5th June chemical ozone 5th June passive ozone 5th June data
Figure 4 - (a) Modelled passive ozone/CFC-11 correlation (triangles) for an ER-2 flight (14/01/00), a DIRAC balloon flight (19/01/00), both in the Arctic vortex, and the Egrett flight (05/06/00) in midlatitudes. Also shown is the data from the two vortex flights. See text for detailed explaination.
(b) Modelled passive and chemical ozone/CFC-11 correlations, interpolated onto the flight track of the Egrett on 5th June 2000, and the data correlation obtained on the flight from DIRAC and a commercial ozone sensor. Plot shows ozone loss of ~200 ppbv at the 200 pptv CFC-11 level (~380 K).
Fig. 4. (a) Modelled passive ozone/CFC-11 correlation (triangles) for an ER-2 flight (14 January
2000), a DIRAC balloon flight (19 January 2000), both in the Arctic vortex, and the Egrett flight (5 June 2000) in midlatitudes. Also shown is the data from the two vortex flights. See text for detailed explaination. (b) Modelled passive and chemical ozone/CFC-11 correlations,
interpolated onto the flight track of the Egrett on 5 June 2000, and the data correlation obtained on the flight from DIRAC and a commercial ozone sensor. Plot shows ozone loss of ∼200 ppbv at the 200 pptv CFC-11 level (∼380 K).
ACPD
4, 141–168, 2004 Investigation of Arctic ozone depletion sampled over midlatitudes D. E. M. Ross et al. Title Page Abstract Introduction Conclusions References Tables Figures J I J I Back CloseFull Screen / Esc
Print Version Interactive Discussion
© EGU 2004
Figure 5 - Average ozone loss (DU) within equivalent latitude band 60-30oN for the partial column 342-510 K, plotted in colour according to (a) the origin of the ozone loss and (b) the chemical cycle responsible. Ozone loss is cumulative from 9th December 1999. Also shown is the model psasive and chemical ozone partial column values. The difference is equivalent to net ozone loss (PassO3-O3).
Day from 1 Jan 2000
-20 0 20 40 60 80 100 120 140 Av e ra g e o z o n e l o ss b y o ri g in , o v e r 6 0 -3 0 N , D U 0 10 20 30 40 50 60 A v e ra g e o zo n e , o v e r 3 0 -6 0 N , D U 0 20 40 60 80 100 120 140 Total Loss HO2-BrO HO2-ClO Cl2O2 ClO-BrO ClO HO2 NO2 O3 Passive O3 Pass O3 - O3
Day from 1 Jan 2000
-20 0 20 40 60 80 100 120 140 Ave ra g e o z o n e l o ss b y o ri g in , o ve r 6 0 -3 0 N , D U 0 10 20 30 40 50 60 A v e ra g e o z o n e , o ve r 3 0 -6 0 N , D U 0 20 40 60 80 100 120 140 30N-SP 60-30N 70-60N 90-70N O3 Passive O3 Pass O3 - O3 a b
Fig. 5. Average ozone loss (DU) within equivalent latitude band 60–30◦N for the partial column 342–510 K, plotted in colour according to(a) the origin of the ozone loss and (b) the chemical
cycle responsible. Ozone loss is cumulative from 9th December 1999. Also shown is the model psasive and chemical ozone partial column values. The difference is equivalent to net ozone loss (Pass O3–O3).
ACPD
4, 141–168, 2004 Investigation of Arctic ozone depletion sampled over midlatitudes D. E. M. Ross et al. Title Page Abstract Introduction Conclusions References Tables Figures J I J I Back CloseFull Screen / Esc
Print Version Interactive Discussion
© EGU 2004
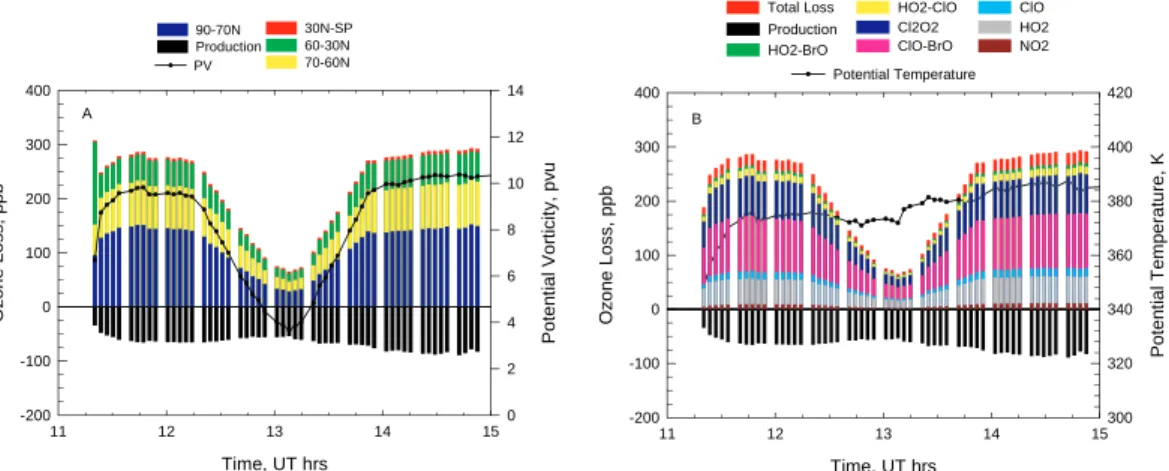
Figure 6 - Total chemical ozone loss (and production) encountered along the flight track of 5th June. Plotted according to (a) location relative to the vortex and (b) chemical cycle responsible
Time, UT hrs 11 12 13 14 15 O z o n e L o s s, p p b -200 -100 0 100 200 300 400 P o te n ti a l V o rt ici ty , p v u 0 2 4 6 8 10 12 14 30N-SP 60-30N 70-60N 90-70N Production PV Time, UT hrs 11 12 13 14 15 O z o n e L o ss, p p b -200 -100 0 100 200 300 400 P o te n ti a l T e m p e ra tu re , K 300 320 340 360 380 400 420 Potential Temperature HO2-ClO Cl2O2 ClO-BrO ClO HO2 NO2 Total Loss Production HO2-BrO A B
Fig. 6. Total chemical ozone loss (and production) encountered along the flight track of 5 June.
ACPD
4, 141–168, 2004 Investigation of Arctic ozone depletion sampled over midlatitudes D. E. M. Ross et al. Title Page Abstract Introduction Conclusions References Tables Figures J I J I Back CloseFull Screen / Esc
Print Version Interactive Discussion
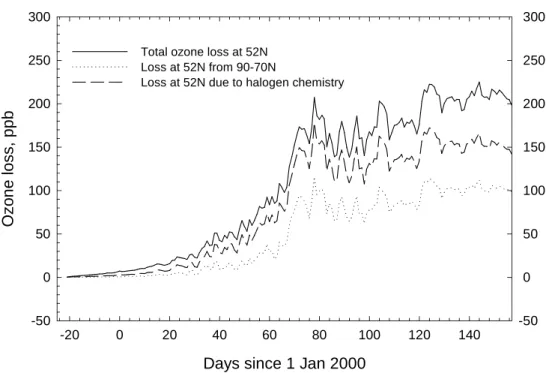
© EGU 2004 Days since 1 Jan 2000
-20 0 20 40 60 80 100 120 140 O zo n e l o ss, p p b -50 0 50 100 150 200 250 300 -50 0 50 100 150 200 250 300 Total ozone loss at 52N
Loss at 52N from 90-70N
Loss at 52N due to halogen chemistry
Figure 7 - Zonal mean time series of ozone loss in the midlatitude lower stratosphere (52oN, 380 K). Total ozone loss is correlated to ozone occurring at high latitudes (90-70oN) and loss due
to halogens. High latitude ozone loss and loss due to halogens increase in midlatitudes throughout the winter, indicative of a subvortex region with vigourous horizontal transport between the vortex and midlatitudes in the lower stratosphere.
Fig. 7. Zonal mean time series of ozone loss in the midlatitude lower stratosphere (52◦N, 380 K). Total ozone loss is correlated to ozone occurring at high latitudes (90–70◦N) and loss due to halogens. High latitude ozone loss and loss due to halogens increase in midlatitudes throughout the winter, indicative of a subvortex region with vigourous horizontal transport be-tween the vortex and midlatitudes in the lower stratosphere.
ACPD
4, 141–168, 2004 Investigation of Arctic ozone depletion sampled over midlatitudes D. E. M. Ross et al. Title Page Abstract Introduction Conclusions References Tables Figures J I J I Back CloseFull Screen / Esc
Print Version Interactive Discussion
© EGU 2004
Figure 8. ECMWF potential vorticity map on the 380 K isentrope on 5th April 2000 at 1200 hours. The flight track of 5th June 2000 is superimposed as a schematic to give an idea of the airmasses encountered during the hypothetical flight.
4 5.5 7.5 9 11
Fig. 8. ECMWF potential vorticity map on the 380 K isentrope on 5 April 2000 at 12:00. The
flight track of 5 June 2000 is superimposed as a schematic to give an idea of the airmasses encountered during the hypothetical flight.
ACPD
4, 141–168, 2004 Investigation of Arctic ozone depletion sampled over midlatitudes D. E. M. Ross et al. Title Page Abstract Introduction Conclusions References Tables Figures J I J I Back CloseFull Screen / Esc
Print Version Interactive Discussion
© EGU 2004
Figure 9 - Total chemical ozone loss (and production) encountered along the hypothetical flight of 5th April 2000, plotted according to (a) location relative to the vortex and (b) chemical cycle responsible.
The flight track was identical to the flight of 5th June 2000. Time, UT hrs 11 12 13 14 15 O z o n e L o ss, p p b -200 -100 0 100 200 300 400 500 P o te n ti a l V o rt ici ty , p v u 0 2 4 6 8 10 12 14 30N-SP 60-30N 70-60N 90-70N Production PV Time, UT hrs 11 12 13 14 15 O z o n e L o ss, p p b -200 -100 0 100 200 300 400 500 P o te n ti a l T e m p e ra tu re , K 300 320 340 360 380 400 420 Potential Temperature Total loss Production HO2-BrO HO2-ClO Cl2O2 ClO-BrO ClO HO2 NO2 a b
Fig. 9. Total chemical ozone loss (and production) encountered along the hypothetical flight
of 5 April 2000, plotted according to(a) location relative to the vortex and (b) chemical cycle