HAL Id: hal-00299117
https://hal.archives-ouvertes.fr/hal-00299117
Submitted on 4 Jan 2005
HAL is a multi-disciplinary open access
archive for the deposit and dissemination of
sci-entific research documents, whether they are
pub-lished or not. The documents may come from
teaching and research institutions in France or
abroad, or from public or private research centers.
L’archive ouverte pluridisciplinaire HAL, est
destinée au dépôt et à la diffusion de documents
scientifiques de niveau recherche, publiés ou non,
émanant des établissements d’enseignement et de
recherche français ou étrangers, des laboratoires
publics ou privés.
and mobile values since the mid-twentieth century, case
study Galtür
M. Keiler, A. Zischg, S. Fuchs, M. Hama, J. Stötter
To cite this version:
M. Keiler, A. Zischg, S. Fuchs, M. Hama, J. Stötter. Avalanche related damage potential - changes of
persons and mobile values since the mid-twentieth century, case study Galtür. Natural Hazards and
Earth System Science, Copernicus Publications on behalf of the European Geosciences Union, 2005,
5 (1), pp.49-58. �hal-00299117�
Natural Hazards and Earth System Sciences (2005) 5: 49–58 SRef-ID: 1684-9981/nhess/2005-5-49
European Geosciences Union
© 2005 Author(s). This work is licensed under a Creative Commons License.
Natural Hazards
and Earth
System Sciences
Avalanche related damage potential – changes of persons and mobile
values since the mid-twentieth century, case study Galt ¨ur
M. Keiler1, *, A. Zischg1, S. Fuchs1, 2, M. Hama1, 2, and J. St¨otter1
1Department of Geography, University of Innsbruck, Austria
2alpS Centre for Natural Hazard Management, Innsbruck, Austria
*now at: Department of Geography and Regional Research, University of Vienna, Austria
Received: 15 September 2004 – Accepted: 29 November 2004 – Published: 4 January 2005 Part of Special Issue “Multidisciplinary approaches in natural hazard and risk assessment”
Abstract. When determining risk related to natural haz-ard processes, many studies neglect the investigations of the damage potential or are limited to the assessment of imbile values like buildings. However, persons as well as mo-bile values form an essential part of the damage potential. Knowledge of the maximum number of exposed persons in an endangered area is of great importance for elaborating evacuation plans and immediate measures in case of catas-trophes. In addition, motor vehicles can also be highly dam-aged, as was shown by the analysis of avalanche events. With the removal of mobile values in time as a preventive measure this kind of damage can be minimised.
This study presents a method for recording the maximum number of exposed persons and monetarily assessing motor vehicles in the municipality of Galt¨ur (Tyrol, Austria). More-over, general developments of the damage potential due to significant socio-economic changes since the mid-twentieth century are pointed out in the study area. The present situa-tion of the maximum number of persons and mobile values in the official avalanche hazard zones of the municipality is described in detail. Information on the number of persons is derived of census data, tourism and employment statistics. During the winter months, a significant increase overlaid by strong short-term fluctuation in the number of persons can be noted. These changes result from a higher demand of tourism related manpower as well as from varying occupancy rates. The number of motor vehicles in endangered areas is closely associated to the number of exposed persons. The potential number of motor vehicles is investigated by means of map-ping, statistics on the stock of motor vehicles and the density distribution. Diurnal and seasonal fluctuations of the investi-gated damage potential are pointed out. The recording of the number of persons and mobile values in endangered areas is vital for any disaster management.
Correspondence to: M. Keiler
1 Introduction
Avalanches pose a threat to settlements and infrastructure in Alpine environments; due to the catastrophic events in the winter 1999 the general public is more aware of this phe-nomenon. Yet these locations have always been confronted with natural hazards since they have been populated. Over centuries, hardly any change in dealing with natural hazards can be recognised. Accordingly, the relation of people to natural hazards was predominantly shaped by a conscious perception of the threat, acceptance of the risk and, if possi-ble, by avoiding endangered areas. From the late nineteenth century onward, more permanent measures were constructed because of an increasing knowledge of avalanches processes and the development of appropriate techniques (Coaz, 1881). Since the beginning of the twentieth century, the Alps have been increasingly used as an area of settlement, economic activities and leisure (B¨atzing, 1993). This resulted in an ex-pansion of buildings and infrastructure in endangered areas. The avalanche winters of 1950/1951–1953/1954 with 296 casualties in Austria induced high investments of the pub-lic sector for the construction of permanent mitigation mea-sures (BMLF, 1973). With responsibility shifting from the individual to the public authorities, the fear of natural haz-ards processes was replaced by a request for safety (Stritzl, 1980). Since the mid-twentieth century, the Alpine society has undergone enormous socio-economic changes from an agricultural society to a modern service industry- and leisure-oriented society (B¨atzing, 1993). This economic upswing due to tourism led to an intensified building development in the confined areas of the valleys. As erecting protection measures is not feasible on an area-wide basis and finan-cial resources are limited, hazard zone planning was intro-duced in the mid-1970s to coordinate the development of land-use (Kellermann, 1980; Weiss, 2002). Although invest-ing in permanent mitigation measures has risen and spatial planning is applied, catastrophic avalanche events cannot be completely avoided. In February 1999, 55 persons died
be-cause of avalanche events in western Austria and in Switzer-land (Heumader, 2000; SLF, 2000). Additionally, extensive direct damage of buildings and infrastructure as well as indi-rect damage occurred (N¨othiger et al., 2002). These events as well as decreasing public finances triggered a gradual change in dealing with natural hazards from the traditional process-oriented assessment of hazards to comprehensive risk as-sessment in the Alps (Heinimann et al., 1998; Borter, 1999; St¨otter et al., 2002a). In the field of natural hazards, risk is usually expressed as a function of probability of occurrence and damage potential. Due to the socio-economic develop-ment since the 1950s, the damage potential is the key factor of the changing risk related to avalanche processes (Fuchs and Br¨undl, 2005). Many studies neglect the investigation of the damage potential or are limited to the assessment of immobile values like buildings. However, persons as well as mobile values form an essential part of the damage potential. The study area of Galt¨ur is located in the inner Paznaun
valley in the Tyrol, Austria. Galt¨ur has always been an
avalanche-prone area and has undergone a transformation from farming village to tourism resort, which is typical for the Eastern Alps. In this study, the changing probability of exposure of persons and mobile values in Galt¨ur is presented for the period of 1951 to 2002. The study is conducted in decadal steps for the total community by differentiating be-tween residents and tourists in the winter seasons. The de-velopment is pointed out in detail for 1951 and 2002, using the avalanche hazard zones for segmenting the community spatially. The probability of exposure of persons is not only subject to seasonal fluctuations of tourists but also to diurnal and hourly fluctuations of residents and tourists. The general movements of persons in and out of an endangered area are exemplified for a selected area on a diurnal and hourly basis in the winter season. For mobile values, the development of the value of passenger cars is presented for the study area as well as in detail for the avalanche hazard zones. Changes of the means of transport of tourists are discussed.
2 Methods
2.1 Persons
The development of the permanent population of Galt¨ur since the mid-twentieth century was determined by using statistics (Gemeinde Galt¨ur, 2003; Landesstatistik Tirol, 2004). Detailed information on the number of persons per building in 1951 is based on the statistical analysis of B¨ohm (1970) for 29 fractions of the municipality of Galt¨ur.
The potential number of tourists in the endangered build-ings was derived by using the official number of beds speci-fied by the local tourist board in 1954 and 2002. The data rep-resent values assuming a maximum occupancy rate of beds. The seasonal fluctuation of tourists was recorded by consult-ing official tourism statistics (Gemeinde Galt¨ur, 2003; Lan-desstatistik Tirol, 2003a). In addition, the data was calculated on the basis of both the official period of the winter season
from November to April (181 days) and the local average period of the winter seasons (116 days). The winter season in Galt¨ur starts a few days before Christmas and ends tradi-tionally one week after Easter (ski lifts and most hotels close with this date). Depending on the weekday of Christmas day and the date of the Easter-weekend from 1970 to 2004, the average period of the winter season can be reduced to 116 days (10 days in December and 16 days in April).
A method was developed for analysing diurnal and hourly
fluctuations of people. Moreover, it is incorporated in a
newly designed model. The assumption for the fluctuation is deduced from information on the population (e.g. age group) and economic structure (activity rate, commuters) (Statistik Austria, 2004a) as well as on detailed tourism statistics in the municipality of Galt¨ur (Gemeinde Galt¨ur, 2003). For a detailed study, an area in the red and yellow hazard zones was selected close to the village centre. In this area, 36 buildings are located, which are composed of seven residen-tial buildings, two hotels, 20 guesthouses or bed & breakfast businesses, and one restaurant. Three buildings consist of a residential part and a business part (sports outfitter, crafts-man enterprise). One building was assigned to the category “public buildings” and five to “agricultural buildings” and garages. 112 people live in the selected area, 374 guest beds are rented out and approximately 45 persons commute from other areas of Galt¨ur or other municipalities to the selected area.
Taking the pattern of the daily movements into consid-eration, the residents are divided into the groups of pupils (20 persons), permanent residents (including small children, residents who work in this area, retired persons; 80 per-sons), and outward-bound commuters (12 persons). More-over, persons who commute to Galt¨ur are split into the cate-gories “inward-bound commuters/tourism industry” (20 per-sons) and “inward-bound commuters/other industries” (25 persons).
The potential number of tourists has to be calculated in a first step. For the periods of the main travel season (Christ-mas, carnival, Easter), the occupancy rate of beds is set at 95%, while a rate of 75% is assumed for the second high-est peak (school holidays in several states of Austria, Ger-many and the Netherlands). For the rest of the season, the occupancy rate of beds was determined for each month cor-responding to the remaining overnight stays. The move-ments of the residents and commuters are simulated depend-ing on weekday, holiday and time of the day; for tourists merely on the time of the day. In Fig. 1, the changing ex-posure of persons (in %) from Monday to Friday is given for each group (Figs. 1a–1f). On Sundays and holidays, half of the pupils are not in the selected area from 10:00 a.m. to 05:00 p.m. For permanent residents and “inward-bound commuters/tourism industry” the same pattern of movements was assumed as during the week. Half of the outward-bound commuters are outside the selected area on Saturday, Sunday and holiday mornings (09:00–12:00 a.m.) and afternoons (02:00–05:00 p.m.). 60% of the group “inward-bound com-muters/other industries” work also on Saturdays and follow
M. Keiler et al.: Avalanche related damage potential 51 Pupils 0 10 20 30 40 50 60 70 80 90 100 0-7 7-8 8-9 9-10 10-11 11-12 12-13 13-14 14-15 15-16 16-17 17-18 18-19 19-20 20-21 21-22 22-24 Time Percentage of Expo sure Permanent Residents 0 10 20 30 40 50 60 70 80 90 100 0-7 7-8 8-9 9-10 10-11 11-12 12-13 13-14 14-15 15-16 16-17 17-18 18-19 19-20 20-21 21-22 22-24 Time Percentage of Exposure Commuters - Outward-bound 0 10 20 30 40 50 60 70 80 90 100 0-7 7-8 8-9 9-10 10-11 11-12 12-13 13-14 14-15 15-16 16-17 17-18 18-19 19-20 20-21 21-22 22-24 Time Percentage of Exposure
Commuters - Inward-bound/Tourism Industry
0 10 20 30 40 50 60 70 80 90 100 0-7 7-8 8-9 9-10 10-11 11-12 12-13 13-14 14-15 15-16 16-17 17-18 18-19 19-20 20-21 21-22 22-24 Time Percentage of Exposure
Commuters - Inward-bound/other Industries
0 10 20 30 40 50 60 70 80 90 100 0-7 7-8 8-9 9-10 10-11 11-12 12-13 13-14 14-15 15-16 16-17 17-18 18-19 19-20 20-21 21-22 22-24 Time Percentage of Exposure Tourists 0 10 20 30 40 50 60 70 80 90 100 0-7 7-8 8-9 9-10 10-11 11-12 12-13 13-14 14-15 15-16 16-17 17-18 18-19 19-20 20-21 21-22 22-24 Time Percentage of Exposure (a) (b) (c) (d) (e) (f)
Fig. 1.
Exposure of persons (in percent) from Monday to Friday for pupils (a), permanent
residents (b), commuters (outward-bound, c), commuters (inward-bound/tourism industry, d),
commuters (inward-bound/other industries, e), and tourists (f).
19
Fig. 1. Exposure of persons (in %) from Monday to Friday for pupils (a), permanent residents (b), commuters (outward-bound) (c), com-muters (inward-bound/tourism industry) (d), comcom-muters (inward-bound/other industries) (e), and tourists (f).
the same routine like during the week. On Sundays and hol-idays, this group is left out for the modelling. In the given examples, the permanent (residents, commuters) and tempo-rary (tourists) population is considered as a whole.
2.2 Passenger cars
Collecting data on passenger cars is closely related to the investigations on potentially exposed persons. For estimating
the number of passenger cars per residents, the relationship between registered motor vehicle (Statistik Austria, 2004b) and the number of residents in the district of Landeck in 2002 was statistically analysed (Landesstatistik Tirol, 2003b).
The number of tourist passenger cars was calculated by employing information on the chosen means of
transporta-tion and the number of passengers per tourist car. A
Yellow Hazard
Zone + Fringe
Buffer
Yellow Hazard Zone
Red Hazard Zone
Zone + Fringe
Red Hazard Zone
Fig. 2.
Schematic diagram of the categories used for the spatial analysis (Keiler, 2004).
20
Fig. 2. Schematic diagram of the categories used for the spatial analysis (Keiler, 2004).
Galt¨ur and the results of a study on arrivals and departures of tourists (ARGE Soft Mobility, 2003) show that 95% of the tourists arrived by car in 2002. In addition, 3–4% use private bus companies and 1–2% public transport in win-ter. Bed & breakfast businesses or small guesthouses register solely arrivals by private cars. Therefore, the number of beds is reduced by 5% for hotels; in all other businesses the to-tal number of beds is considered for the calculations. In a next step, the number of the potential tourist passenger cars is calculated by applying the average number of passenger per car in leisure-time (2.34 persons) (BfS, 2004). In addi-tion to the statistically analysed number of passenger cars, a survey on the existing underground parking in avalanche-prone areas was conducted. The number of parking spaces in underground parking was subtracted from the number of passenger cars. Furthermore, the number of parking spaces of public or ski lift parking areas was mapped in the field and added to the number of passenger cars.
The value of the passenger cars was determined using the price of the most popular brand (Volkswagen) and the most sold type of car in Austria since 1950 (Statistik Austria, 2004b). The car prices were provided by the general importer of Volkswagen in Austria and were adjusted to the price level of 2002. A middle price level is assumed, therefore, higher losses are possible.
2.3 Spatial analysis
When conducting the analysis, persons and passenger cars need to be allocated to buildings. The approach is incorpo-rated in a Geographical Information System (GIS). Data of the Tyrolean state government forms the basis for the record-ing of the buildrecord-ings and their location. The age of buildrecord-ings was taken from descriptions, and thus it was possible to trace
the buildings back to their location in 1950 (Keiler, 2004). Public or ski lift parking areas are added to the GIS.
For pointing out the spatially differentiated development of the study area, the edited information was intersected with the avalanche hazard zones. As it has to be anticipated that buildings are destroyed and persons in buildings at the risk of their lives, any building activity is forbidden in the red zone. In the yellow zone, avalanches have an impact on the eco-nomic and individual use of the area and can damage build-ings. When observing building requirements and restrictions, it is, however, unlikely that buildings are destroyed and peo-ple in buildings endangered (Fink, 1986).
The spatial analysis was conducted in five different cat-egories, which are “red zone”, “yellow zone”, “red zone + fringe”, “yellow zone + fringe” and “10 m-buffer”:
– Buildings with their centre clearly located in a zone, are assigned to that zone (see Fig. 2)
– Buildings that are only partially located in a zone, are assigned to the categories “zone + fringe”; these cate-gories include also the buildings of the respective zone. – The zones were buffered by ten meters in the GIS, in order to be able to highlight developments in areas close to the zones. In this area, the buildings assigned to the categories “zone + fringe” are not included.
The development of the hazard zones is compared with the development of the whole area of the community. In order to describe the “hazard zones”, the categories “red zone” and “yellow zone + fringe” are added up.
3 Results
3.1 Persons
The population growth was about 68% between 1950 and 2000 (in 2000: 774 residents) (Landesstatistik Tirol, 2004). The out-migration of the population and a strong seasonal labour mobility in the nineteenth century were stopped by the onset of tourism in the beginning of the twentieth
cen-tury (B¨ohm, 1970). Thus, new jobs were created in the
municipality and affected a rise of the population number. The transformation from a farming community to tourism resort can be illustrated by the changed proportions of the economic sectors. In 1951, 72% of the Galt¨ur-based labour force worked in agriculture, however, in the following ten
years this proportion dropped already under 50% ( ¨OSTAT,
1963; Statistik Austria, 2004a). In the year 2001, the propor-tion of labour force in agriculture was less than 3%, while 41% of the labour could be found in tourism industry. This number is significantly higher than the average 12% in the state of Tyrol (Landesstatistik Tirol, 2004). The develop-ment in the employdevelop-ment structure started between 1950 and 1960. In 1964, 35 tourism businesses already existed, which represented 70% of the non-agricultural-businesses. 22% of the working population were employed in this field (B¨ohm,
M. Keiler et al.: Avalanche related damage potential 53 0 250 500 750 1000 Number of Persons
Red Zone Red Zone
+ Fringe Yellow Zone Yellow Zone+ Fringe Buffer Tourists Residents 1951 Tourists Residents 2002 1954 2001
Fig. 3.Potentially exposed persons 1951/1954 and 2001/2002 in avalanche-prone areas in Galtür (Data source: Böhm, 1970).
21
Fig. 3. Potentially exposed persons 1951/1954 and 2001/2002 in avalanche-prone areas in Galt¨ur (Data source for the 1950s: B¨ohm, 1970).
1970). In 2001, 109 businesses were located in Galt¨ur, 75% of which being assigned to tourism industry. The whole mu-nicipality and region shows a strong dependency on tourism, as 58% of the labour force work in this industry. Already in 1950, more commuters were inward-bound than outward-bound in Galt¨ur. The commuters came mainly from nearby municipalities (B¨ohm, 1970). In 2000, the commuter ratio was still positive, however, 60% (69 persons) did not com-mute every day, but had their own seasonal accommodation. This seasonal manpower increases the permanent population rate during the winter season by 10% compared to the popu-lation rate at the reference date of the census (15 May). When adding the seasonal manpower to the number of residents for the spatial analysis of persons in avalanche-prone areas, fol-lowing changes in the number of potentially exposed persons have taken place since 1950 (see Fig. 3).
23 of the 461 residents of Galt¨ur lived in the red zone and there were no residential buildings partially located in the red zone (red zone + fringe) in 1951. In this area, 17 guest beds were rented out to tourists. In the yellow zone, the numbers of residents and guest beds rose to 58 and 60, re-spectively. If the fringe area (yellow zone + fringe) is taken into account, the numbers increase to 118 residents and 246 beds. 66 residents lived in the 10 m-buffer and 208 beds were rented out. In 1951, 141 residents (30.6% of the registered population) lived in the areas identified as hazards zones, and 33.5% (263) of all guest beds were located here. By 2002, the number of residents in the red zone dropped to 18, while
0 10 20 30 40 50 60 70 80 90 1960 1962 1964 1966 1968 1970 1972 1974 1976 1978 1980 1982 1984 1986 1988 1990 1992 1994 1996 1998 2000 Year
Occupancy Rate of Beds (%)
Winter Season (181 days) Winter Season (116 days)
Fig. 4.Occupancy rates of guest beds in Galtür between 1960 and 2000, calculated with the official (181 days) and the average (116 days) period of the winter season (Data source: Landesstatistik Tirol, 2003a).
22
Fig. 4. Occupancy rates of guest beds in Galt¨ur between 1960 and 2000, calculated with the official (181 days) and the average (116 days) period of the winter season (Data source: Landesstatis-tik Tirol, 2003a).
guest beds rose by a factor of 2.8 to 47 beds (Keiler, 2004). In the associated fringe area of the red zone, six residents and 54 guest beds are counted. In the yellow zone, the num-ber of residents tripled to 197 and the numnum-ber of guest beds increased to 532 (factor 8.9). Adding the fringe area, the numbers rise to 256 residents (factor 2.2) and 757 beds (fac-tor 3.1). In the 10 m-buffer, a slight increase of residents by the factor 1.9 is registered while the number of beds more than quadrupled to 894 beds. In 2002, the proportion of the population living in the hazard zones (red zone and yellow zone + fringe) rose slightly to 31.3% in comparison to the total population of the municipality, whereas the percentage of guest beds located there decreased to 21.6% (804).
For the spatial analysis described above, a maximum oc-cupancy rate of beds was assumed to show the maximum number of persons in endangered areas. The occupancy rate of beds, calculated with the official tourism period of win-ter (November to April), was between 30 and 40% from the 1960s to the mid-1970s (see Fig. 4). The low rate in 1968 re-sults from successful advertisement campaigns by the neigh-bouring village Ischgl, which reduced the number of tourists in Galt¨ur (Cimarolli, 1989). The decline in the winter 1973 is an effect of the oil crisis. Until 1998, the occupancy rate of beds fluctuated between 40 and 50% and attained a peak in the early 1990s with 52% (Landesstatistik Tirol, 2003a). The values declined after the avalanche event in February 1999 (St¨otter et al., 2002b). These values differ when the average period of winter season is applied for estimating the average occupancy rate of beds, the rates change from 32% to 83% in December and from 32% to 60% in April.
The values in April show a greater deviation of the mean value as in December due to the changing dates of Easter and the end of season. The overnight stays in November and in the beginning of December as well as the end of April can be neglected because of an average occupancy rate of beds of 0.2 and four, respectively. Using the average period of the winter season by calculating the occupancy rate of beds, the values ranged around 50% until the mid-1970s, rose above
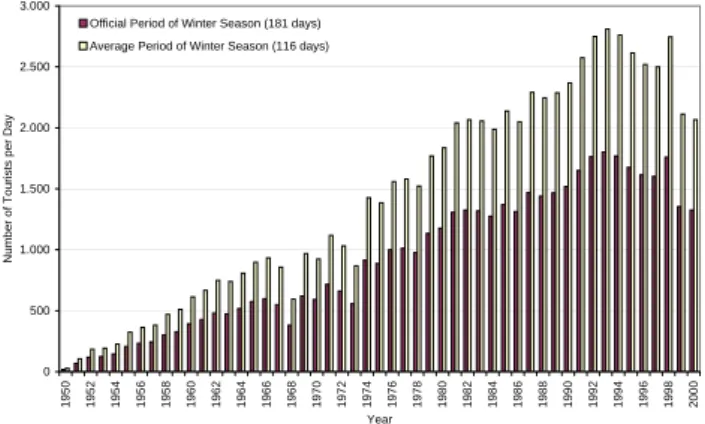
Table 1. Average number of tourists per day in decades, calculated with the official (181 days) and average (116 days) period of the winter season (Data source: Landesstatistik Tirol, 2003a).
Decade Tourists per day in the winter season Official period Average period
1950s 170 269
1960s 507 791
1970s 863 1346
1980s 1321 2062
1990s 1436 2240
70% the late 1970s and attained their peak of more than 80% in 1993 before starting to decline (Fig. 4). Figure 5 shows the development of the tourist numbers per day in the winter sea-son, determined for both the official and the average period of the winter season. Corresponding to the growing num-ber of beds (Keiler, 2004) and the higher occupancy rate, the number of tourists per day increased from the 1950s to the 1990s by a factor of 8.3, with peaks of up to 2800 tourists (see Table 1 and Fig. 5).
Focusing on one season, the possible numbers of exposed persons show a strong fluctuation during the season as well as in daytime. Applying the described fluctuation approach in the selected area, the winter season 2001/2002 was mod-elled. The results of the general movements according to the population and economic structure of the municipality as well as to a winter tourist are illustrated as an overview in Fig. 6. On the abscissa, each day from 1 November to 30 April is shown, and on the ordinate each hour of the day is displayed. The number of persons is divided in steps of 50, which are colour-coded from light yellow to deep pur-ple. The seasonal fluctuation is characterised by a strongly increasing number of tourists at Christmas time. After 6 Jan-uary the numbers decline and gradually rise again up to the main travel season in February, followed by a reduction until the start of the Easter travel season. The end of the win-ter season is highlighted by a sharp decrease in the number of persons to nearly the amount of the permanent popula-tion one week after Easter. In November, the diurnal fluctua-tion of the permanent populafluctua-tion is displayed with nearly no tourists and is characterised by a lower number in the early morning and at noon (see Fig. 6 and Figs. 1a–1e). In addi-tion, the weekly structure can be recognised due to the ab-sence of the commuters on Sundays and is displayed in light yellow. The minimum number of 86 persons in this period is modelled for 02:00 p.m.–04:00 p.m. on Sundays. Dur-ing the week, the minimum rises to 91 persons and shifts to 08:00 a.m.–10:00 a.m. The maximum of 118 persons is at-tained between 07:00 a.m. and 08:00 a.m. on each day. From the beginning of the winter season on, these patterns are con-cealed by general movements of the tourists (see Fig. 1f). This results in a sharp decline of the number of persons at 10:00 a.m., followed by a slight increase at noon and a new
0 500 1.000 1.500 2.000 2.500 3.000 1950 1952 1954 1956 1958 1960 1962 1964 1966 1968 1970 1972 1974 1976 1978 1980 1982 1984 1986 1988 1990 1992 1994 1996 1998 2000 Year Num ber of Tour ists per Day
Official Period of Winter Season (181 days) Average Period of Winter Season (116 days)
Fig. 5.Development of the number of tourists per day in Galtür between 1950 and 2000, calculated with the official (181 days) and the average (116 days) period of the winter season (Data source: Landesstatistik Tirol, 2003a).
23
Fig. 5. Development of the number of tourists per day in Galt¨ur between 1950 and 2000, calculated with the official (181 days) and the average (116 days) period of the winter season (Data source: Landesstatistik Tirol, 2003a).
reduction to the number of the late morning. The number of persons rises abruptly in the late afternoon and decreases lightly in the evening. After 09:00 p.m., the numbers of the nights are reached. Corresponding to the results of Novem-ber, the maximum number of 472 persons is simulated be-tween 07:00 a.m. and 08:00 a.m. because of more incoming commuters than persons leaving the area (see Fig. 6, Febru-ary). In the period of the main season, 139 persons form the minimum on Sundays between 02:00 p.m. and 04:00 p.m. A minimum of 154 persons is found on weekdays and local school days from 10:00 a.m. to noon. In the second half of February, the bright purple illustrates a period in the main season where local children are at school. At Christmas and Easter, the period of the main season coincide with the school holidays.
3.2 Passenger cars
The numbers of passenger cars of the local residents rose from two cars in 1950 to 357 cars in 2000 (see Fig. 7). First, this strong increase is due to an abrupt fall of prices af-ter suspending the monopoly in 1953. Afaf-terwards, the car prices show merely a slight increase. Second, more and more people could afford to buy a car. In 1950, a passen-ger car cost the equivalent of 174 monthly salaries
(Aus-trian average, ¨OSTAT, 1963). This ratio was reduced to one
car for 28 salaries in 1960, 23 salaries in 1970 and eleven salaries in 1980. Since 1990, the equivalent of seven monthly salaries has to be paid for one passenger car (Statistik Aus-tria, 2004b). Consequently, the density of passenger cars in the district of Landeck increased from four passenger cars per 1000 residents in 1950 to 458 passenger cars per 1000 residents in 2000. The increasing motorisation made ex-tending the existing roads mandatory after the mid-1950s (Cimarolli, 1989). This extension can be regarded as a fur-ther important impulse for the tourism industry (Lichten-berger, 2002). In 1950, the tourists travelled by public trans-port and were picked up at the train station, or arrived by a
M. Keiler et al.: Avalanche related damage potential 55
Fig. 6. Diurnal and hourly fluctuations of the number of exposed persons in a selected avalanche-prone area in Galtür (winter season 2001/2002).
24
Fig. 6. Diurnal and hourly fluctuations of the number of exposed persons in a selected avalanche-prone area in Galt¨ur (winter season 2001/2002).
daily operating bus in Galt¨ur. In the beginning of the 1960s, the preferred means of transport of tourists were private busses and public transport in the Paznaun region (Cimarolli, 1989). Ten years later, offers for special trains in the travel season decreased while individual traffic rose instead above 55% (Cimarolli, 1989; Lichtenberger, 2002). In 2000, 95% of the tourists arrived by car (ARGE Soft Mobility, 2003).
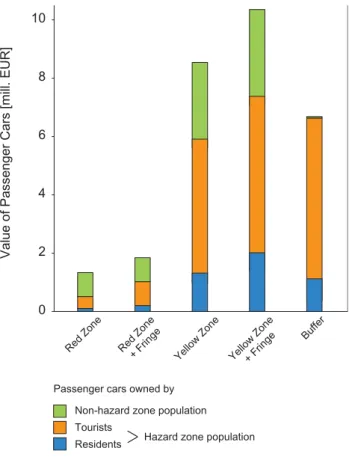
Regarding the avalanche hazard zones in Galt¨ur, it can be assumed that none of the two calculated passenger cars owned by residents were located in the endangered area and all tourists arrived by public transport. In 2002, the values of passenger cars in the red zones amounted to EUR 1.3 mil-lion (see Fig. 8). More than two thirds of these mobile values are attributed to potential passenger cars on public or ski lift parking areas. The remaining cars are determined on the ba-sis of residents and tourists. Corresponding to the number of persons, the total value of passenger cars increased slightly in the fringe area of the red zone (red zone + fringe) (see Figs. 3 and 8). In the yellow zone, the value of the passenger cars added up to EUR 8.6 million, with more than the half of the cars belonging to tourists. The values of resident- and tourist-owned cars increased the total sum by EUR 0.7 mil-lion and EUR 0.9 milmil-lion, respectively, when including the fringe area of the yellow zone. In the 10 m-buffer, the value of passenger cars totalled EUR 6.6 million, 82% of these val-ues are associated to passenger cars of tourists. The numbers and values of passenger cars refer to parking spaces belong-ing to buildbelong-ings or to parkbelong-ing areas. Additionally, nearly five kilometres of roads are endangered by avalanches in the
mu-nicipality. 1650 m of the main road are located in the red hazard zone and 2575 m in the yellow zone. In the latter, 700 m of community roads and 50 m of access roads are ad-ditionally endangered.
4 Discussion
In the municipality of Galt¨ur, a significant change in the number of persons and mobile values has taken place due to tourism since the 1950s. The number of residents in Galt¨ur has increased above average in comparison to the popula-tion of the district of Landeck and rose most between 1960 and 1970 (Landesstatistik Tirol, 2004). This local popula-tion growth is connected to rising numbers of jobs in tourism and tourism related businesses in the region. In particular, the tourism industry offered employment outside the agricul-tural sector. Thus, a higher and regular income of the res-idents lead to spatially increasing settlements due to more residential and guesthouse buildings (see Keiler, 2004).
In the hazard zones (red zone and yellow zone + fringe), the number of residents has almost doubled since the 1950s. In this context, the number of residents declined in the red zone, but tripled in the yellow zone. Thus, the increase in the yellow zone was slightly higher than in the community as a whole. The highest amount of tourists stays in the 10 m-buffer surrounding the yellow hazard zone. In this area, more guest beds exist than in the hazard zones. The highest in-crease of the number of beds has been registered in the yel-low zone since 1950, while the slightest one was in the red
0 25 50 75 100 125 150 175 200 225 250 275 300 325 350 375 1950 1960 1970 1980 1990 2000 Year N u m ber of Passenger C a rs i n Gal tür 0 2.500 5.000 7.500 10.000 12.500 15.000 17.500 20.000 22.500 25.000 27.500 Costs of a Passenger Car in €
Number of Passenger Cars Costs of a Passenger Car
Fig. 7.Development of the number of passenger cars of the residents of Galtür and development of passenger car prices (Volkswagen) between 1950 and 2000 (Data source: ÖSTAT, 1963; Statistik Austria, 2004).
25
Fig. 7. Development of the number of passenger cars of the resi-dents of Galt¨ur and development of passenger car prices (Volkswa-gen) between 1950 and 2000 (Data source: ¨OSTAT, 1963; Statistik Austria, 2004).
zone. The number of beds in the hazards zones rose less (factor 3) compared to the number of beds in the community, which quintupled. Altogether, the maximum number of per-sons in the hazard zones in 1950 was about 400 and increased until 2002 to 1080 persons (factor 2.7). The number of resi-dents and tourists can be traced to a smaller number of per-sons per household, an increasing number of buildings and mainly to the change of the function of buildings from purely residential purposes to additional tourist purposes. The de-velopment per spatial category of both latter factors (Keiler, 2004) strongly correlates to the changes in the number of persons.
When using an average number of tourists corresponding to the occupancy rate of beds for determining the probabil-ity of exposure, the period of the winter season has to be considered. The official period of the winter season does not correspond with the shorter average season in Galt¨ur and thus, causes a lower occupancy rate of beds and numbers of tourists per day. The occupancy rate of beds in December and April as well as in the season increase significantly, regarding this average period. As the durations of the official and av-erage winter season differ strongly, both calculated numbers of tourists per day deviate by 1.6. In general, a gradually ris-ing number of guest beds and higher occupancy rates cause an increasing number of tourists per day since the mid-1970s. Thus, the probability of exposure of persons between the year 1951 and 2002 increased by a factor of 4.2 in Galt¨ur, taking the average number of tourists per day (average period) and the number of residents into account. In comparison, the fac-tor 5.5 was calculated using the maximum number of tourists (Keiler, 2004).
By applying the fluctuation model, the changing numbers of persons over the seasons and during a day were pointed out. The beginning and the end of the winter season are char-acterised by a radical slump in the number of persons. From off-season to main season the maximum number of persons rises by a factor of 5.6, while the minimum number shows only a slight increase (factor 1.6). During the day, the
num-0 2 4 8 10
Value of Passenger Cars [mill.
EU
R
]
Red Zone Red Zone
+ Fringe Yellow Zone Yellow Zone+ Fringe Buffer
6
Non-hazard zone population Tourists
Residents
Passenger cars owned by
Hazard zone population
Fig. 8.Values of passenger cars in the avalanche-prone areas in Galtür in 2002.
26
Fig. 8. Values of passenger cars in the avalanche-prone areas in Galt¨ur in 2002.
ber of persons fluctuates by the factor 1.4 between minimum and maximum in the off-season, and by a factor of 3.4 in the period of the main season. These extreme changes of the number of persons can occur within one to two hours.
With the permanent population becoming more mobile and transport habits of the tourists having changed, a signif-icant rise in the number of passenger cars and mobile values can be noticed. Damage of motor vehicles has been recorded since the 1960s and illustrated this development. 51 motor vehicles were destroyed by an avalanche in Galt¨ur in 1967 (Fliri, 1998). About 118 passenger cars as well as agri-cultural equipment were totally damaged in the catastrophic avalanche events in Galt¨ur and Valzur in February 1999 (Amt der Tiroler Landesregierung, 2000). Most of the cars in en-dangered areas (50%) are owned by tourists, while only 18% are associated to local residents. Up to one third of the pas-senger cars are owned by persons, who come from outside the hazard zones. These cars are located at public of ski lift parking areas.
5 Conclusion
Persons as well as mobile values form an essential and a special part of the damage potential. In contrast to the im-mobile damage potential (buildings and infrastructure, etc.), persons and mobile values can either leave or be removed
M. Keiler et al.: Avalanche related damage potential 57 out of avalanche-prone areas in case of dangerous situations.
For developing efficient and effective evacuation and emer-gency plans, information on numbers of persons and mobile values as well as their location and movements in the area is needed. The analysis conducted in this study points out the fluctuation of persons and mobile values in the commu-nity of Galt¨ur, in order to possibly improve the understanding of mobile damage potential in time and space. Furthermore, following aspects have to be considered when dealing with avalanche related mobile damage potential.
This study focused on the changing numbers of persons and mobile values, but the probability of avalanche events undergoes seasonal and diurnal changes, too. Additionally, both factors are changing in space and form the base for a dy-namic risk visualisation. This information may help to recog-nise high risk situations more easily and enables a situation-oriented and risk-based decision-making.
For devising or improving evacuation plans and immediate measures, the high numbers of tourists in endangered areas as well as possible escape routes in periods of high proba-bility of avalanche release have to be regarded in order to guarantee an efficient and effective procedure in emergency cases. This is essential for efficient disaster risk reduction and contributes to the concept of resilience as part of proac-tive adaptation (UN/ISDR, 2004).
Persons and mobile values are not only in settlements at risk of avalanches, but are also exposed to high risk on roads to the tourism resorts. Due to the higher volume of traffic caused by increasing tourism and the high economic depen-dence on the road network, “safe” road connections become more and more important. Until 1999, 4 km of the 34 km long road to Galt¨ur were protected by different mitigation measures. Since the avalanche event, protection for another 6 km was added and 1 km is under construction or planned for the next year (Tiroler Landesregierung, 2004). Regard-ing the limited financial resources of the public hand alter-native ways in dealing with natural hazards should be more considered, like described in Wilhelm (1997) and Zischg and St¨otter (2004).
The number of casualties and the height of damage of mo-bile values of the avalanche winter 1999 are, compared to former avalanche winters, relatively low, even though more persons and higher values are exposed in the Alpine environ-ment than in the past. Combining the existing mitigations measures prevented a worse situation, but deficits still per-sist (SLF, 2000). In order to optimise dealing with natural hazards, methods of determining the risk, the economic as-sessment of the efficiency of mitigation measures as well as spatial planning have to be strengthened.
Acknowledgements. Many thanks go to the Federal Service for
Torrent, Erosion and Avalanche Control, District Office Imst and Landeck, Tyrol as well as to A. Pasch, Porsche Austria, for making their data available. Furthermore, the authors would like to thank K. Walser and the community of Galt¨ur for their help. The research for this paper was carried out with a grant from the MunichRe Reinsurance Company, Germany.
Edited by: T. Glade
Reviewed by: B. Braun and H. Staffler
References
Amt der Tiroler Landesregierung (ed.): Schnee und Lawinen 1997/1998 und 1998/1999, Lawinenwarndienst Tirol, 7, 8, Inns-bruck, 2000.
ARGE Soft Mobility: http://www.soft-mobility.com/members/ EU-SANFTEMOBILITAET.pdf, 5 February, 2003.
B¨atzing, W.: Der sozio-¨okonomische Strukturwandel des Alpen-raumes im 20. Jahrhundert, Geogr. Bernen., P26, 1993. BfS: Gesamtverkehrsfragen, http://www.are.admin.ch/imperia/md/
content/are/gesamverkehr/personenverkehr/mz94.pdf, 2 Septem-ber, 2004.
BMLF (ed.): Hochwasser, Muren, Lawinen – Information ¨uber Wasserwirtschaft und Katastrophenschutz, Schriftenreihe Wasserwirtschaft, 2, Wien, 1973.
B¨ohm, H.: Das Paznauntal – Die Bodennutzung eines alpinen Tales auf gel¨andeklimatischer, agrar¨okologischer und sozial-geographischer Grundlage, Forschungen zur Deutschen Lan-deskunde 190, Bonn, 1970.
Borter, P.: Risikoanalyse bei gravitativen Naturgefahren, Umwelt-Materialien, 107/I, II, BUWAL, Bern, 1999.
Cimarolli, E.: Ischgl – Vom Bergbauerndorf zum internationalen Wintersportort, Eigenverlag, Landeck, 1989.
Coaz, J.: Die Lauinen der Schweizer Alpen, Dalp‘sche Buch- und Kunsthandlung, Bern, 1881.
Fink, M. (ed.): Raumordnung und Naturgefahren, ¨Osterreichische Raumordnungskonferenz 50, Gesch¨aftsstelle der ¨Osterr. Rau-mordnungskonferenz, Wien, 1986.
Fliri, F.: Naturchronik von Tirol, Wagner, Innsbruck, 1998. Fuchs, S. and Br¨undl, M.: Damage Potential and Losses Resulting
from Snow Avalanches in Settlements of the Canton of Grisons, Switzerland, Natural Hazards, 34, 53–69, 2005.
Gemeinde Galt¨ur: Statistik Galt¨ur, http://www.galtuer.tirol.gv.at/ betten.htm, 5 February, 2003.
Heinimann, H., Hollenstein, K., Kienholz, H., Krummenacher, B., and Mani, P.: Methoden zur Analyse und Bewertung von Naturgefahren, Umwelt-Materialien, 85, BUWAL, Bern, 1998. Heumader, J.: Die Katastrophenlawinen von Galt¨ur und Valzur am
23. und 24. Frebruar 1999 im Paznauntal/Tirol, Proc. Interna-tionales Symposion Interpraevent – Villach, 26–30 June, 2, 397– 410, 2000.
Keiler, M.: Development of the Damage Potential Resulting from Avalanche Risk in the Period 1950–2000, Case Study Galt¨ur, Nat. Haz. Earth Sc., 4, 249–256, 2004,
SRef-ID: 1684-9981/nhess/2004-4-249.
Kellermann, D.: Beziehungen zwischen den Gefahrenzonenpl¨anen der Wildbach- und Lawinenverbauung und der ¨ortlichen Raum-planung, Proc. Internationales Symposion Interpraevent – Bad Ischl, 8–12 September, 1, 23–32, 1980.
Landesstatistik Tirol: Tourismus, http://www.tirol.gv.at/themen/ zahlenundfakten/statistik/tourismus.shtml, 5 February 2003, 2003a.
Landesstatistik Tirol: Tiroler Daten 2003, http://www.tirol.gv.at/ themen/zahlenundfakten/statistik/downloads/stat-fold03.pdf, 15 May, 2003b.
Landesstatistik Tirol: Landesstatistik Tirol, http://www.tirol.gv. at/themen/zahlenundfakten/statistik/wohnbevoelkerung.shtml, 5 February, 2004.
Lichtenberger, E.: ¨Osterreich, Wissenschaftliche Buchgesellschaft, Darmstadt, 2002.
N¨othiger, C, Elsasser, H., Br¨undl, M., and Ammann, W.: Indi-rekte Auswirkungen von Naturgefahren auf den Tourismus – Das Beispiel des Lawinenwinters 1999 in der Schweiz, Geogr. Helv., 2, 91–108, 2002.
¨
OSTAT: Volksz¨ahlung 1951, Statistik Austria, ¨Osterreichisches Statistisches Zentralamt, Wien, 1963.
SLF (ed.): Der Lawinenwinter 1999, Eidgen¨ossisches Institut f¨ur Schnee- und Lawinenforschung, Davos, 2000.
Statistik Austria: Census 2001, http://www.statistik.gv.at/blickgem/ vz5/g70606.pdf, 18 March, 2004a.
Statistik Austria: Stock on motor vehicle, http://www.statistik.gv. at/gz/vz.shtml, 13 January, 2004b.
St¨otter, J., Meißl, G., Ploner, A., and S¨onser, T.: Developments in Natural Hazard Management in Alpine Countries Facing Global Change, edited by Steininger, K. W. and Weck-Hannemann, H., Global Environmental Change in Alpine Regions – Recogni-tion, Impact, Adaptation and MitigaRecogni-tion, 113–130, Edward El-gar, Cheltenham, 2002a.
St¨otter, J., Meißl, G., Rinderer, M., Keiler, M., and Fuchs, S.: Galt¨ur – Eine Gemeinde im Zeichen des Lawinenereignisses von 1999, edited by Steinicke, E., Geographischer Exkursionsf¨uhrer Euro-paregion Tirol, S¨udtirol, Trentino, Spezialexkursionen im Bun-desland Tirol, Eigenverlag, Innsbruck, Innsbrucker Geograph-ische Studien, 33/2, 167–184, 2002b.
Stritzl, J.: Sicherheit im alpinen Raum, Proc. Internationales Sym-posion Interpraevent – Bad Ischl, 8–12 September, 1, 17–22, 1980.
Tiroler Landesregierung: Verkehr – Lawinenschutzbauten, http://www.tirol.gv.at/themen/verkehr/bauvorhaben/
lawinenschutzbauten lechtal paznaun.shtml, 10 June, 2004. UN/ISDR: Living with Risk, A global review of disaster reduction
initiatives, 2004 Version, 1, Geneva, 2004.
Weiss, G.: The Political Practice of Natural Hazards Control in Aus-tria and the Question of Global Change, edited by Steiniger, K. W. and Weck-Hannemann, H., Global Environmental Change in Alpine Regions – Recognition, Impact, Adaptation and Mitiga-tion, 131–149, Edward Elgar, Cheltenham, 2002.
Wilhelm, C.: Wirtschaftlichkeit im Lawinenschutz. Mitt. Eid-gen¨ossisches Institut f¨ur Schnee- und Lawinenforschung, 54, Davos, 1997.
Zischg, A. and St¨otter, J.: Objektorientierte Betrachtung des La-winenrisikos, Proc. Internationales Symposion Interpraevent – Riva del Garda, 24–27 May, VI/217–VI/228, 2004.