HAL Id: hal-00298183
https://hal.archives-ouvertes.fr/hal-00298183
Submitted on 23 Mar 2007HAL is a multi-disciplinary open access
archive for the deposit and dissemination of sci-entific research documents, whether they are pub-lished or not. The documents may come from teaching and research institutions in France or abroad, or from public or private research centers.
L’archive ouverte pluridisciplinaire HAL, est destinée au dépôt et à la diffusion de documents scientifiques de niveau recherche, publiés ou non, émanant des établissements d’enseignement et de recherche français ou étrangers, des laboratoires publics ou privés.
The LGM surface climate and atmospheric circulation
over East Asia and the North Pacific in the PMIP2
coupled model simulations
W. Yanase, A. Abe-Ouchi
To cite this version:
W. Yanase, A. Abe-Ouchi. The LGM surface climate and atmospheric circulation over East Asia and the North Pacific in the PMIP2 coupled model simulations. Climate of the Past Discussions, European Geosciences Union (EGU), 2007, 3 (2), pp.655-678. �hal-00298183�
CPD
3, 655–678, 2007
East Asia and the North Pacific at LGM W. Yanase and A. Abe-Ouchi Title Page Abstract Introduction Conclusions References Tables Figures ◭ ◮ ◭ ◮ Back Close
Full Screen / Esc
Printer-friendly Version Interactive Discussion
EGU
Clim. Past Discuss., 3, 655–678, 2007 www.clim-past-discuss.net/3/655/2007/ © Author(s) 2007. This work is licensed under a Creative Commons License.
Climate of the Past Discussions
Climate of the Past Discussions is the access reviewed discussion forum of Climate of the Past
The LGM surface climate and
atmospheric circulation over East Asia
and the North Pacific in the PMIP2
coupled model simulations
W. Yanase1and A. Abe-Ouchi1,2
1
Center for Climate System Research, The University of Tokyo
2
Frontier Research Center for Global Change, Japan Agency for Marine-Earth Science and Technology
Received: 14 March 2007 – Accepted: 16 March 2007 – Published: 23 March 2007 Correspondence to: W. Yanase ([email protected])
CPD
3, 655–678, 2007
East Asia and the North Pacific at LGM W. Yanase and A. Abe-Ouchi Title Page Abstract Introduction Conclusions References Tables Figures ◭ ◮ ◭ ◮ Back Close
Full Screen / Esc
Printer-friendly Version Interactive Discussion
EGU
Abstract
The surface climate and atmospheric circulation over East Asia and the North Pacific at the last glacial maximum has been investigated using the outputs from several coupled atmosphere-ocean general circulation model in PMIP2 database. In boreal summer, the weakening of high pressure over the North Pacific and less precipitation over East 5
Asia are analyzed in most models. The reduced moisture transport seems to result in the less precipitation over East Asia. In boreal winter, the intensification of the Aleutian low and southward shift of the upper-level jet are analyzed in most models. Some of these results are consistent with geological records such as pollen, lake status and dust transport.
10
1 Introduction
Geological records show that the last glacial maximum (hereafter, referred to as LGM) is characterized by huge ice sheets over high-latitude continents and reduced CO2 concentration. The East Asia and the North Pacific are interesting region because it is somewhat away from the region under direct influence of ice sheets over North America 15
and North Europe. Some geological records also show that the regional atmosphere at LGM was different from that at the present day (PD). In the present study, we will focus on the East Asia and the North Pacific region, which also seems to have experienced regional climate change. According to the analysis and interpretation of dust record over China (Donghuai,2004) and Japan Sea (Nagashima et al.,in press), the west-20
erly jet in the upper-troposphere over the East Asia at LGM was located to the south of the jet at PD. It is also suggested that the northerly wind in the lower-troposphere associated with the East Asian winter monsoon was intensified at LGM. These char-acteristics mean that the circulation was modified regionally. Regional climate change over East Asia and the North Pacific is also seen in the dry/wet signal that is quali-25
CPD
3, 655–678, 2007
East Asia and the North Pacific at LGM W. Yanase and A. Abe-Ouchi Title Page Abstract Introduction Conclusions References Tables Figures ◭ ◮ ◭ ◮ Back Close
Full Screen / Esc
Printer-friendly Version Interactive Discussion
EGU
China at LGM was characterized by steppe or desert vegetation, and seems to have experienced dry climate (Kohfeld and Harrison,2000;Yu et al.,2000). Although there are no records associated with dry/wet signal over the North Pacific, the record over western North America (i.e. close to the eastern North Pacific) experienced wet climate compared to PD (Kohfeld and Harrison,2000). Since the number of sampling sites and 5
physical variables of the geological records are limited, however, the entire structure of the regional climate is not fully obtained, and the dynamical relation among these atmosphere and ocean is not clear.
The general circulation model (GCM) is a useful tool to investigate the horizontal distribution of atmospheric variables, if it successfully reproduces the climate at LGM 10
which is partly estimated from the geological records. In GCM experiments, the value of the ice-sheet distribution, CO2 concentration and solar insolation estimated from geological records are prescribed as boundary condition. In the late 20th century, the LGM experiments were performed by atmospheric GCM (AGCM) in which sea surface temperature (SST) estimated from geological records is also prescribed.
15
It is interesting that most of such AGCM experiments show that the anomaly of at-mospheric circulation over the North Pacific at LGM is cyclonic in both boreal sum-mer and winter (Kutzbach and Wright,1985;Rind,1987;Hall et al.,1996a;Dong and
Valdes, 1998;Vettoretti et al., 2000); the cyclonic anomaly over the North Pacific in boreal summer means the weakening of high SLP (Sea Level Pressure) observed in 20
PD summer, while that in boreal winter means the intensification of low SLP observed in PD winter. There have also been experiments of AGCM coupled with slab (or mixed-layer) ocean in which the model calculates only the change of heat budget through the atmosphere-ocean interface but not the change of the oceanic circulation. The cyclonic LGM anomaly over the North Pacific in boreal summer is also seen in such experiments 25
(e.g.Dong and Valdes,1998;Vettoretti et al.,2000), while the anomaly in boreal winter shows different tendencies: anti-cyclonic anomaly inBroccoli and Manabe(1987) and
Dong and Valdes (1998) and no clear anomaly in Vettoretti et al. (2000). In AGCM
CPD
3, 655–678, 2007
East Asia and the North Pacific at LGM W. Yanase and A. Abe-Ouchi Title Page Abstract Introduction Conclusions References Tables Figures ◭ ◮ ◭ ◮ Back Close
Full Screen / Esc
Printer-friendly Version Interactive Discussion
EGU
different between PD and LGM. It has been shown that the precipitation over East Asia remarkably decreases in boreal summer at LGM (Hall et al., 1996b;Kutzbach et al.,
1998).
In recent years, some experiments by coupled atmosphere-ocean GCM (CGCM) have been reported (Bush and Philander, 1999; Kitoh and Murakami, 2001a; Hewitt
5
et al.,2003;Kim et al.,2003; Shin et al.,2003). However, most of these studies did not show the physical variables separately for summer and winter, but show the annual average, in which the circulation anomaly is cyclonic over the North Pacific and the precipitation is reduced over East Asia at LGM. Only Shin et al. (2003) shows the seasonal anomaly at LGM in which the circulation over the North Pacific has cyclonic 10
anomaly in boreal summer and less clear anomaly in winter, and the precipitation over East Asia is remarkably reduced. In terms of the water budget, it is interesting to see water vapor and lower tropospheric circulation in many CGCM outputs. Therefore, more samples of CGCM experiments seems to be necessary to discuss whether there is consistent tendency of surface climate and atmospheric circulation over East Asia 15
and the North Pacific in summer and winter.
Recently, the Paleoclimate Modeling Intercomparison Project Phase 2 (PMIP2) has defined a standard forcing for the LGM experiment in order to examine the intercompar-ison among CGCMs and validation by the geological records (e.g.Masson-Delomtte
et al.,2006;Kageyama et al.,2006). The purpose of the present study is to investigate 20
the surface climate and atmospheric field over East Asia and the North Pacific at LGM by comparing the experiments by different CGCMs in PMIP2 database and geological records. In Sect. 2, the experimental design and models in PMIP2 are described. In Sect. 3, the climate change over East Asia and the North Pacific are demonstrated for boreal summer and winter. In Sect. 4, we compare the present result with the previous 25
works and geological records. We will also discuss the water budget at LGM using a model output. Finally, we summarize our conclusion in Sect. 5.
CPD
3, 655–678, 2007
East Asia and the North Pacific at LGM W. Yanase and A. Abe-Ouchi Title Page Abstract Introduction Conclusions References Tables Figures ◭ ◮ ◭ ◮ Back Close
Full Screen / Esc
Printer-friendly Version Interactive Discussion
EGU
2 Models and experimental design
We analyzed the CGCM outputs for PD and LGM experiments which are designed by PMIP2. The forcing and boundary condition are different between PD and LGM: solar insolation, greenhouse gases and ice-sheet distribution. The solar insolation at LGM is estimated from the earth’s orbital parameter for 21 000 years Before Present (BP). 5
The concentration of CO2 which is the most dominant greenhouse gas is reduced to 185 ppm for LGM from the amount of 280 ppm for PD (preindustrial value). The albedo and topography is changed according to the ice-sheet distribution of ICE-5G recon-struction for PD and LGM (Peltier, 2004), in which huge ice-sheets form over North America and North Europe at LGM. The detailed information of forcing and boundary 10
conditions are described on the PMIP2 web-site (http://www-lsce.cea.fr/pmip2/). We have analyzed the outputs from five CGCMs that are currently available in PMIP2 database: MIROC3.2 (hereafter, referred to as MIROC), CCSM3 (CCSM), FGOALS-1.0g (FGOALS) HadCM3M2 (HADCM) and IPSL-CM4-V1-MR (IPSL). The output for each experiment is 100 year long after the major adjustments in the atmosphere and 15
ocean surface to the forcing and boundary conditions. The averaged value of the 100-year-long output is analyzed in the present study. The confidence level of the anomaly at LGM is examined by the Student’s t-test with 25 sample years which are picked up every four years of 100 year output for both PD and LGM experiments. In order to validate the result of PD simulations, we used the climatological fields of ERA-40 20
reanalysis data (Uppala et al.,2005) using the averaged monthly data between 1979 and 1999.
CPD
3, 655–678, 2007
East Asia and the North Pacific at LGM W. Yanase and A. Abe-Ouchi Title Page Abstract Introduction Conclusions References Tables Figures ◭ ◮ ◭ ◮ Back Close
Full Screen / Esc
Printer-friendly Version Interactive Discussion
EGU
3 Results
3.1 Boreal summer
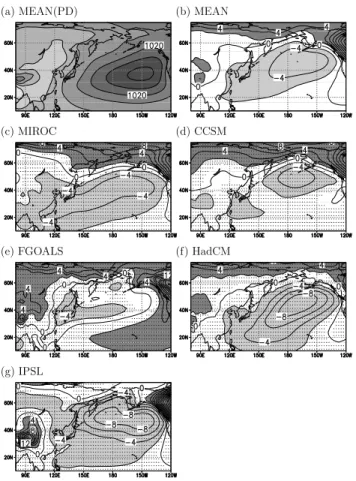
Firstly, in order to get a grasp of lower tropospheric circulation, the SLP averaged in boreal summer (June, July and August; hereafter, referred to as JJA) is shown in Figure
1. The SLP of multi-model mean for PD (Fig.1a) reproduces the high pressure over the 5
North Pacific (the Pacific high) observed in the real atmosphere. When we calculate SLP anomalies in Figs. 1b-1g, we removed the global average of the anomalies be-cause only the horizontal contrast of SLP is important to know the lower tropospheric circulation in terms of geostrophic wind balance. The SLP anomalies of multi-model mean (Fig.1b) and all the models (Fig.1c–1g) for LGM show negative tendencies over 10
wide area of the North Pacific with the confidence level higher than 95 percent, although quantitative amplitudes and patterns are somewhat different among the models. This means that the high pressures over the North Pacific simulated in PD experiments are weakened, which is also seen in the previous AGCM studies.
Next we will show the precipitation averaged in boreal summer (Fig.2). The multi-15
model mean for PD (Fig. 2a) reproduces the precipitation field that is large over East Asia and the western North Pacific and is small over the eastern North Pa-cific in subtopics and mid-latitudes. The precipitation anomaly varies between mod-els (Figs.2c–2g). Relatively consistent characteristics among most model results are that the precipitation at LGM is smaller over East Asia than at PD and larger over the 20
eastern North Pacific, which can also be confirmed in model-mean anomaly in Fig.2b. Now, we will focus on East Asia which is located on the western edge of the weak-ened Pacific high and is characterized by the reduced precipitation at LGM. Figure3
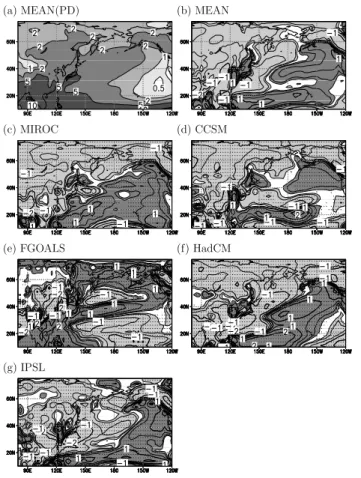
shows the meridional distributions of meridional wind at 850 hPa and precipitable water (vertically integrated water vapor amount) averaged between 105◦E–135◦E for PD and 25
LGM anomaly. The large precipitation over East Asia at PD is considered to be associ-ated with the moisture transport by the southerly flow in this season (Fig.3a). In Fig.3b, most models simulate negative anomalies of meridional wind in this region, where
pre-CPD
3, 655–678, 2007
East Asia and the North Pacific at LGM W. Yanase and A. Abe-Ouchi Title Page Abstract Introduction Conclusions References Tables Figures ◭ ◮ ◭ ◮ Back Close
Full Screen / Esc
Printer-friendly Version Interactive Discussion
EGU
cipitation is reduced at LGM. This means the southerly wind at PD over this region is weakened. It is interesting that the result of FGOALS in which positive anomaly of meridional wind at the latitudes lower than 25◦N shows the dominant positive anomaly of precipitation at the lower latitude over East Asia. Thus, the anomaly of precipitation seems to partly explained by the change of meridional transport of moisture.
5
It is expected that the water vapor amount is different between PD and LGM exper-iments related to the precipitation anomaly. Figure3c shows the precipitable water at PD. Since there is a remarkable meridional gradient with larger amount of water vapor in the lower latitudes, the southerly flow shown in Fig. 3a transports the water vapor to the higher latitude. At LGM (Fig. 3d), the precipitable water decreases in all the 10
models. In order to further understand the dynamics associated with the precipitation change, we will demonstrate an example of the detailed water budget using one model output in Sect.4.2.
3.2 Boreal winter
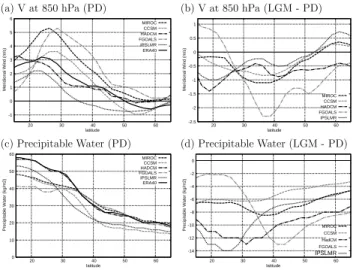
Figure 4 shows the SLP averaged in boreal winter (December, January, February; 15
DJF). The SLP of multi-model mean for PD (Fig.4a) shows that the models reproduce the low pressure over the North Pacific (the Aleutian low) and high pressure over Asian Continent (the Siberian high). The SLP anomaly of multi-model mean (Fig.4b) and those of all the models (Figs.4c–4g) for LGM shows negative tendency over the North Pacific with the confidence level higher than 95 percent. This means the Aleutian 20
low analyzed in PD experiment is intensified, which is also seen in many previous AGCM experiments. Again, the quantitative amplitudes and horizontal patterns of the anomalies vary among the models.
Figure 5 shows the precipitation averaged in boreal winter. The large precipitation of multi-model mean for PD (Fig.5a) extends zonally along the latitude of about 40◦N. 25
This seems to result from the precipitation associated with the mid-latitude storm track in winter. The precipitation anomaly of multi-model mean at LGM (Fig.5b) is positive on the southern and eastern sides of the mid-latitude precipitation maximum in PD,
CPD
3, 655–678, 2007
East Asia and the North Pacific at LGM W. Yanase and A. Abe-Ouchi Title Page Abstract Introduction Conclusions References Tables Figures ◭ ◮ ◭ ◮ Back Close
Full Screen / Esc
Printer-friendly Version Interactive Discussion
EGU
while negative on the northern and western sides. The tendency is also seen in most of the individual model result (Figs.5c–5g). This means that the mid-latitude precipi-tation maximum shifts southward and eastward at LGM. Over East Asia, on the other hand, the precipitation anomaly at LGM in boreal winter is small compared to that in boreal summer. Thus, the anomaly of precipitation in annual mean over East Asia is 5
dominantly explained by the anomaly in summer.
In Fig.6, the meridional distribution of several atmospheric variables over the Pacific (averaged between 150◦E and 150◦W) are shown for all the models. The zonal winds at 500 hPa in PD (Fig. 6a) show the westerly jet axis is located between 30◦N and 40◦N, in most models, which are qualitatively consistent with the ERA-40 reanalysis 10
data (solid black line in Fig.6a). The westerly jet at upper-troposphere approximately corresponds to the the meridional gradient of temperature due to the thermal wind bal-ance, and is also associated with the storm track and mid-latitude precipitation maxi-mum. The anomalies of zonal wind at LGM (Fig.6b) is positive on the southern side of the westerly jet in PD in most models, while it negative on the northern side. This 15
means the upper-tropospheric westerly jet shifts southward at LGM. The anomalies of westerly wind at 850 hPa (Fig.6c) show the pattern similar to those at 500 hPa but with smaller amplitudes. As seen in Fig. 5, the precipitation anomalies at LGM (Fig. 6d) increase around 30◦N and decrease around 40◦N, which is consistent with the zonal wind anomaly at 500 hPa in that the southward shift of the storm-track accompanied 20
by the westerly jet results in more precipitation in the southern side of the precipitation maximum in PD. Since the precipitable water (Fig.6e) decrease over the sub-tropics and mid-latitudes at LGM in all the models, the anomalies of the water vapor does not explain those of the precipitation, which is also consistent with the interpretation that the dynamical effect such as storm track is related to the anomalies of the precipita-25
tion. The negative anomalies of surface air temperature at LGM (Fig.6f) are seen in all the models at the latitudes lower than 50◦N and in some models even at the latitudes higher than 50◦N. In more detail, all the models show the minimum of the temperature anomaly between 30◦N and 50◦N, which is located near the upper-tropospheric jet.
CPD
3, 655–678, 2007
East Asia and the North Pacific at LGM W. Yanase and A. Abe-Ouchi Title Page Abstract Introduction Conclusions References Tables Figures ◭ ◮ ◭ ◮ Back Close
Full Screen / Esc
Printer-friendly Version Interactive Discussion
EGU
This is consistent with the southward shift of the jet in the sense of the thermal wind balance. This tendency is more remarkable on the western side of the North Pacific than on the eastern side (not shown).
4 Discussions
4.1 General characteristics in boreal summer 5
All the CGCMs show the weakening of the Pacific high in summer at LGM (Fig. 1). This characteristic is also seen in many AGCM experiments both with prescribed SST
(Kutzbach and Wright,1985; Rind, 1987;Hall et al.,1996a; Dong and Valdes,1998;
Vettoretti et al., 2000) and computed SST by mixed-layer model (Dong and Valdes,
1998; Vettoretti et al., 2000). Therefore, this seems to be relatively robust
charac-10
teristic in LGM experiments by both AGCM and CGCM. Unfortunately, there are few direct geological records that show the tendency of the atmospheric circulation over the ocean.
In most CGCMs, the precipitation over East Asia decreases at LGM (Fig. 2). This is also seen in the previous experiments by AGCM with prescribed SST (Hall et al., 15
1996a; Dong and Valdes, 1998; Liu et al.,2002) and with computed SST by
mixed-layer model (Dong and Valdes, 1998) and by CGCM (Shin et al., 2003). Since the precipitation and its anomaly is dominant in summer over East Asia, this tendency is consistent with the geological records that show the dry climate over East Asia at LGM (Kohfeld and Harrison,2000;Yu et al.,2000). The weakened southerly flow over 20
East Asia (Fig.3b) seems to be related to the reduced precipitable water (Fig.3d) and thus precipitation in this region because of the less moisture transport from the south. The anomaly of southerly flow at LGM occurs on the western edge of the weakened high pressure over the North Pacific. In order to confirm this dynamics, horizontal distributions of water budgets are examined in Sect. 4.2. The reason why the high 25
CPD
3, 655–678, 2007
East Asia and the North Pacific at LGM W. Yanase and A. Abe-Ouchi Title Page Abstract Introduction Conclusions References Tables Figures ◭ ◮ ◭ ◮ Back Close
Full Screen / Esc
Printer-friendly Version Interactive Discussion
EGU
hand, should be also revealed using sensitivity experiment and discussing based on the theoretical studies on the formation mechanism of Subtropical high (e.g.Rodwell
and Hoskins,2001;Miyasaka and Nakamura,2005) in the future study. 4.2 Water budget analysis in boreal summer
In Sect. 3.1, it has been seen that the reduced precipitation over East Asia in JJA 5
is associated with the reduced southerly wind and less water vapor in this region. However, this is not sufficient to understand the exact water balance in East Asia and the dynamics related to the larger areas. Here, we will show a horizontal distribution of water budget difference between LGM and PD over East Asia and the North Pacific. We used the output from MIROC simulation, which is developed in Japanese institutes 10
including our group. The tendencies of reduced precipitation, weaker southerly flow, and less water vapor over East Asia in JJA analyzed in most of the models (Figs.2and
3) is also simulated in MIROC model.
The budget for the vertically integrated water vapor (i.e. precipitable water), Q ≡ R
ρqd z, is described as 15
∂Q
∂t = HADV − P RCP + E V AP, (1)
where HADV is horizontal advection of water vapor defined asR −→∇ · (ρq−→v)d z, P RCP is the removal by precipitation, and E V AP is moisture supply by surface evaporation. Assuming that ∂Q∂t is negligible for the average from June to August, the relation among the differences of precipitation, evaporation and horizontal advection between LGM 20
and PD (∆P RCP , ∆EV AP and ∆HADV , respectively) is given as
∆P RCP = ∆E V AP + ∆HADV (2)
Figure7a shows ∆EV AP for JJA. Over East Asia, the evaporation is reduced, which is consistent with the reduction of precipitation in terms of Eq. (2). Note that this does not
CPD
3, 655–678, 2007
East Asia and the North Pacific at LGM W. Yanase and A. Abe-Ouchi Title Page Abstract Introduction Conclusions References Tables Figures ◭ ◮ ◭ ◮ Back Close
Full Screen / Esc
Printer-friendly Version Interactive Discussion
EGU
necessarily mean the cause-and-effect relationship between precipitation and evapo-ration because the positive feedback mechanism works between them over the land. In most of the region over the North Pacific, on the other hand, the anomaly pattern of evaporation is opposite to that of precipitation, which seems to indicate the neg-ative feedback between them over the ocean. In Fig. 7b, the anomaly of horizontal 5
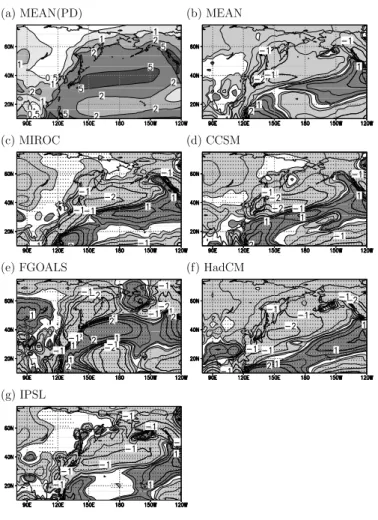
advection of water vapor (∆HADV ) shows a contrast between East Asia and the North Pacific, which is similar to the precipitation anomaly (Fig.2c); over East Asia, the neg-ative anomaly is relneg-atively dominant while the positive anomaly is remarkable over the subtropical North Pacific. From these results, we can interpret that water vapor trans-port cause the precipitation change over East Asia and the North Pacific, while the 10
evaporation has a positive feedback over the former region and negative one over the latter.
Since HADV depends on both water vapor amount (Q) and convergence of wind which transport the water vapor (referred to as the effect of CONV ), we need to sepa-rate the two effects for further understanding of the dynamics. For example,Knutson
15
and Manabe (1995) compared the two effects in their analysis of water cycle change under the increased CO2 climate. Following the previous study, we separate the effect of CONV so that
HADV ≡ Q · CONV. (3)
Thus, the difference of HADV is given as 20
∆(HADV ) = ∆Q(CONV ) + Q∆(CONV ) , (4)
where the term ∆Q∆(CONV ) is neglected. We also define the vector−−−−−→F LOW −−−−−→ F LOW ≡ R ρq−→v d z R ρqd z . (5)
which is the average wind field at the levels where the water vapor amount is large (usually concentrated in the lower troposphere). Figure 7c shows ∆Q for JJA. Over 25
CPD
3, 655–678, 2007
East Asia and the North Pacific at LGM W. Yanase and A. Abe-Ouchi Title Page Abstract Introduction Conclusions References Tables Figures ◭ ◮ ◭ ◮ Back Close
Full Screen / Esc
Printer-friendly Version Interactive Discussion
EGU
East Asia, as has been shown partly in Fig.3d, the Q is remarkably reduced, which is consistent with the reduced precipitation in this region. Over the North Pacific, on the other hand, the magnitude of ∆Q is small, which seems to difficult to explain more remarkable ∆HADV in this region than that over East Asia (Fig. 7b) Fig. 7d shows ∆(CONV ) and ∆(F LOW ). Over the North Pacific, the ∆CONV is positive and thus 5
indicates the convergent tendency, which results in the increased precipitation. Over East Asia, neither convergence nor divergence tendency are dominant. Therefore, the reduced precipitation over East Asia results from the less water vapor, not from the di-vergence of flow. Note that the anomaly of southward flow over East Asia is consistent with the anomaly of meridional wind at 850 hPa shown in Fig. 3b. In summary, the 10
water vapor transport from the south in JJA is reduced compared to the PD climate, which results in the less water vapor and thus precipitation over East Asia.
The tendency of atmospheric circulation is associated with the weakened subtropi-cal high over the North Pacific in JJA (Fig.1); When the subtropical high is weakened, the divergent flow near the center of the high is suppressed and the northward flow 15
on the western edge of the high is reduced. It should be noted that sea level pres-sure over Asian continent shows less remarkable tendency (Fig.1), which means the change of cyclonic circulation around Tibetan plateau in summer at PD can not explain the northerly anomaly on its eastern edge (i.e. over East Asia and the western North Pacific).
20
Since we used the seasonally-averaged physical variables, the transient eddy effect appears as a residual term in Eq. (2). We have examined the residual term, and confirmed that it is less dominant in JJA than in DJF. In DJF, the transient eddy in the active storm track seems to play an important role in water transport as is discussed in Sect.4.3.
25
4.3 General characteristics in boreal winter
All the CGCMs show the negative pressure anomaly over the North Pacific in boreal winter at LGM, although the patterns and amplitudes vary among the models. This
CPD
3, 655–678, 2007
East Asia and the North Pacific at LGM W. Yanase and A. Abe-Ouchi Title Page Abstract Introduction Conclusions References Tables Figures ◭ ◮ ◭ ◮ Back Close
Full Screen / Esc
Printer-friendly Version Interactive Discussion
EGU
negative pressure anomaly is also seen in some AGCM experiments (Kutzbach and
Wright, 1985; Rind, 1987; Hall et al., 1996a; Vettoretti et al., 2000), although posi-tive anomalies in other AGCM (Broccoli and Manabe,1987;Dong and Valdes,1998). The negative pressure anomaly is also associated with the westerly tendency at the latitudes lower than 40◦N and easterly tendency at the latitudes higher than 40◦N in 5
zonal wind over the Pacific at 850 hPa (Fig.6c). At the level of 500 hPa (Fig.6b), most models show the southward shift of westerly jet, which is also seen in some previous AGCM experiments (Kutzbach and Wright,1985;Rind,1987;Hall et al.,1996a) with an exception (Dong and Valdes,1998). Since the upper-tropospheric jet is related to the storm-track, and hence the mid-latitude precipitation maximum in winter, the southward 10
shift of the jet axis is consistent with the southward shift of the precipitation maximum. The precipitation also increases on the eastern side of the maximum in PD. This results in the heavy precipitation over western North America in winter. Since the precipitation anomaly in summer is also positive over western North America, this is consistent with the geological data that the western North America experienced wet climate at LGM 15
(Kohfeld and Harrison,2000).
The surface air temperature over the Pacific at LGM show the maximum of negative anomaly between 30◦N and 50◦N (Fig. 6f). This characteristic is more remarkable on the western side of the North Pacific than on the eastern side (not shown). Since this pattern is also seen in annual-mean SST anomaly field, this is consistent with 20
the geological record that the surface temperature is remarkably reduced in the mid-latitude western North Pacific (Oba and Murayama,2004).
The dynamics of the negative SLP anomaly, southward shift of upper-tropospheric jet and precipitation maximum, and mid-latitude temperature decrease should be in-vestigated in more detail in the future study. It should be noted that the relation among 25
these variables seen in the LGM experiments is similar to the observed decadal vari-ability over the North Pacific in the present climate: although the signs of all fields are shown inversely, Nakamura et al. (2004) demonstrated the negative SST anomaly at mid-latitude, cyclonic surface wind anomaly, and intensified storm track activity at the
CPD
3, 655–678, 2007
East Asia and the North Pacific at LGM W. Yanase and A. Abe-Ouchi Title Page Abstract Introduction Conclusions References Tables Figures ◭ ◮ ◭ ◮ Back Close
Full Screen / Esc
Printer-friendly Version Interactive Discussion
EGU
latitudes lower than about 45◦N and weakened activity at the higher latitudes. It might be worthwhile to discuss further whether the dynamics of atmosphere and ocean is similar between LGM anomaly and decadal variation.
5 Conclusions
The atmospheric field over East Asia and the North Pacific at LGM was investigated 5
using the outputs of different CGCMs, which are available on the PMIP2 web-site. In boreal summer, the weakening of high SLP over the North Pacific is analyzed in most models, which are also seen in many previous AGCM experiments. The reduced pre-cipitation over East Asia at LGM is also simulated in most CGCMs, which is consistent with the pollen records. The reduced moisture transport results in the less precipitation 10
over East Asia at LGM, while the evaporation from land surface has a positive feedback with the precipitation.
In boreal winter, the intensification of the Aleutian low and southward shift of upper-tropospheric westerly jet is analyzed in most models, which are consistent with the dust records. The precipitation maximum at the mid-latitude shifts southward, which seems 15
to be associated with the southward shift of westerly jet in the sense of the storm-track dynamics.
In the present paper, we have not discussed the mechanism of the circulation change over the North Pacific at LGM. There are several different forcings or boundary condi-tions between PD and LGM: topography/albedo of ice-sheets, CO2 concentration, and 20
solar insolation. In order to examine these effects separately, we are performing sen-sitivity experiments. Although the detailed results will be presented in the future paper, we should note here that the effect of reduced CO2 concentration at LGM seems to less important than that of mechanical and thermal effects of ice-sheets not only over the neighboring region of ice-sheets in North America and North Europe but also over 25
East Asia and the North Pacific. This means that the regional climate change over East Asia and the North Pacific at LGM does not necessarily show the opposite signal
CPD
3, 655–678, 2007
East Asia and the North Pacific at LGM W. Yanase and A. Abe-Ouchi Title Page Abstract Introduction Conclusions References Tables Figures ◭ ◮ ◭ ◮ Back Close
Full Screen / Esc
Printer-friendly Version Interactive Discussion
EGU
in global warming experiments in which the CO2 concentration is increased.
Acknowledgements. The present research is supported in part by a Grant for the 21st Century
COE Program “Predictability of the Evolution and Variation of the Multi-scale Earth System” from the Ministry of Education, Culture, Sports, Science, and Technology of Japan and by Grant-in-Aid for Scientific Research No. 16340136, Japan Society for the Promotion of Science.
5
References
Broccoli, A. J. and Manabe, S.: The influence of continental ice, atmospheric CO2, and land albedo on the climate of the last glacial maximum, Clim. Dyn., 1, 87–99, 1987.657,667
Bush, A. B. G. and Philander, S. G. H.: The climate of the Last Glacial Maximum: Results from a coupled atmosphere-ocean general circulation model, J. Geophys. Res., 104, 24 509–
10
24 525, 1999.658
Dong, B. and Valdes, P. J.: Simulations of the Last Glacial Maximum climates using a general circulation model: prescribed versus computed sea surface temperatures, Clim. Dyn., 14, 571–591, 1998. 657,663,667
Donghuai, S.: Monsoon and westerly circulation changes recorded the Late Cenozoic aeolian
15
sequences of Northern China, Global and Planetary Change, 41, 63–80, 2004. 656
Hall, N. M. J., Valdes, P. J., and Dong, B.: The maintaenance of the last great ice sheets: a UGAMP GCM study, J. Clim., 9, 1004–1009, 1996a.657,663,667
Hall, N. M. J., Valdes, P. J., and Dong, B.: The maintaenance of the last great ice sheets: a UGAMP GCM study, J. Clim., 9, 1004–1009, 1996b.658
20
Hewitt, C. D., Stouffer, R. J., Broccoli, A. J., Mitchell, J. F. B., and Valdes, P. J.: The effect of ocean dynamics in a coupled GCM simulation of the Last Glacial Maximum, Clim. Dyn, 20, 203–218, 2003. 658
Kageyama, M., Laˆın ´e, A., Abe-Ouchi, A., Braconnot, P., Cortijo, E., Crucifix, M., deVernal, A., Guiot, J., Hewitt, C. D., Kitoh, A., Kucera, M., Marti, O., Ohgaito, R., Otto-Bliesner, B., Peltier,
25
W. R., Rosell-Mel ´e, A., Vettoretti, G., Weber, S. L., Yu, Y., and MARGO Project Members: Last Glacial Maximum temperatures over the North Atlantic, Europe, and western Siberia: A comparison between PMIP models, MARGO sea-surface temperatures and pollen-based reconstructions, Quaternary Sci. Rev., 25, 2082–2102, 2006. 658
CPD
3, 655–678, 2007
East Asia and the North Pacific at LGM W. Yanase and A. Abe-Ouchi Title Page Abstract Introduction Conclusions References Tables Figures ◭ ◮ ◭ ◮ Back Close
Full Screen / Esc
Printer-friendly Version Interactive Discussion
EGU
Kim, S., Flato, G. M., and Boer, G. J.: A coupled climate model simulation of the Last Glacial Maximum, Part 2: approach to equilibrium, Clim. Dyn., 20, 635–661, 2003. 658
Kitoh, A. and Murakami, S.: A simulation of the Last Glacial Maximum with a coupled atmosphere-ocean GCM, Geophys. Res. Lett., 28, 2221–2224, 2001a. 658
Kitoh, A. and Murakami, S.: A simulation of the Last Glacial Maximum with a coupled
5
atmosphere-ocean GCM, Geophys. Res. Lett., 28, 2221–2224, 2001b.
Knutson, T. R. and Manabe, S.: Time-mean response over tropical pacific to increased CO2 in a coupled ocean-atmosphere model, J. Clim., 8, 2181–2199, 1995. 665
Kohfeld, K. E. and Harrison, S. P.: How well can we simulate past climates? Evaluating the models using global palaeoenvironmental datasets, Quart. Sci. Rev., 19, 321–346, 2000.
10
657,663,667
Kutzbach, J., Gallimore, R., Harrison, S., Behling, P., Selin, R., and Laarif, F.: Climate and BIOME simulations for the past 21 000 years, Quart. Sci. Rev., 17, 473–506, 1998.658
Kutzbach, J. E. and Wright, E.: Simulation of the climate of 18 000 years BP: results for the North American / North Atlantic/ Europian sector and comparison with the geological record
15
of North America, Quarternary Sci. Rev., 4, 147–185, 1985. 657,663,667
Liu, J., Yu, G., and Chen, X.: Palaeoclimate simulation of 21 ka for the Tibetan Plateau and Eastern Asia, Clim. Dyn., 19, 575–583, 2002. 663
Masson-Delomtte, V., Kageyama, M., Braconnot, P., Charbit, S., Krinner, G., Ritz, C., Guilyardi, E., Jouzel, J., Abe-Ouchi, A., Crucifix, M., Gladstone, R. M., Hewitt, C. D., Kitoh, A., Ohgaito,
20
R., Otto-Bliesner, B., Peltier, W. R., Ross, I., Valdes, P. J., Vettoretti, G., Weber, S. L., Wolk, F., and Y.Yu: Past and future polar amplification of climate change: climate model intercom-parisons and ice-core constraints, Clim. Dyn., 27, 437–440, 2006. 658
Miyasaka, T. and Nakamura, H.: Structure and formation mechanism of the northern hemi-sphere summertime subtropical highs, J. Clim., 18, 5046–5065, 2005. 664
25
Nagashima, K., Tada, R., Matsui, H., Irino, T., Tani, A., and Toyoda, S.: Orbital- and Millenial-scale variations in Asian dust transport path to the Japan Sea, Palaeogeogr. Palaeoclimatol. Palaeoecol, in press, 2007. 656
Nakamura, H., Sampe, T., Tanimoto, Y., and Shimpo, A.: Observed associations among strom tracks, jet streams and midlatitude oceanic fronts, Geophys. Mono. Ser., 147, 329–345,
30
2004. 667
Oba, T. and Murayama, M.: Sea-surface temperature and salinity changes in the northwest Pacific since the Last Glacial Maximum, J. Quaternary Sci., 19, 335–346, 2004.667
CPD
3, 655–678, 2007
East Asia and the North Pacific at LGM W. Yanase and A. Abe-Ouchi Title Page Abstract Introduction Conclusions References Tables Figures ◭ ◮ ◭ ◮ Back Close
Full Screen / Esc
Printer-friendly Version Interactive Discussion
EGU
Peltier, W. R.: Global glacial isostasy and the surface of the ice-age Earth: the ICE-5G (VM2) model and GRACE, Ann. Rev. Earth Planet. Sci., 32, 111–149, 2004. 659
Rind, D.: Components of the ice age circulation, J. Geophys. Res., 92, 4241–4281, 1987.657,
663,667
Rodwell, M. J. and Hoskins, B. J.: Subtropical amticyclones and summer monsoons, J. Clim.,
5
14, 3192–3211, 2001. 664
Shin, S. I., Liu, Z., Otto-Bliesner, B., Brady, E. C., Kutzbach, J. E., and Harrison, S. P.: A simulation of the Last Glacial Maximum climate using the NCAR-CCSM, Clim. Dyn., 20, 127–151, 2003. 658,663
Uppala, S., Kallberg, P., Simmons, A., Andrae, U., da Costa Bechtold, V., Fiorino, M., Gibson,
10
J., Haseler, J., Hernandez, A., Kelly, G., Li, X., Onogi, K., Saarinen, S., Sokka, N., Allan, R., Andersson, E., Arpe, K., Balmaseda, M., Beljaars, A., van de Berg, L., Bidlot, J., Bormann, N., Caires, S., Chevallier, F., Dethof, A., Dragosavac, M., Fisher, M., Fuentes, M., Hagemann, S., Holm, E., Hoskins, B., Isaksen, L., Janssen, P., Jenne, R., McNally, A., Mahfouf, J.-F., Morcrette, J.-J., Rayner, N., Saunders, R., Simon, P., Sterl, A., Trenberth, K., Untch, A.,
15
Vasiljevic, D., Viterbo, P., and Woollen, J.: The ERA-40 re-analysis, Quart. J. Roy. Meteor. Soc., 131, 2961–3012, 2005. 659
Vettoretti, G., Peltier, W. R., and McFarlane, N. A.: Global water balance and atmospheric water vapour transport at last glacial maximum: climate simulations with the Canadian Climate Center for Modelling and Analysis atmospheric general circulation model., Can. J. Earth
20
Sci., 37, 695–723, 2000. 657,663,667
Yu, G., Chen, X., Ni, J., Cheddai, R., Guiot, J., H. Han, S. P. H., Huang, C., Ke, M., Kong, Z., Li, S., Li, W., Liew, P., Liu, G., Liu, J., Liu, Q., Liu, K.-B., Prentice, I. C., Qui, W., Ren, G., Song, C., Sugita, S., Sun, X., Tang, L., Campo, E. V., Xia, Y., Xu, Q., Yan, S., Yang, X., Zhao, J., and Zheng, Z.: Palaeovegetation of China: a pollen data-based syntesis for the mid-Holocene
25
CPD
3, 655–678, 2007
East Asia and the North Pacific at LGM W. Yanase and A. Abe-Ouchi Title Page Abstract Introduction Conclusions References Tables Figures ◭ ◮ ◭ ◮ Back Close
Full Screen / Esc
Printer-friendly Version Interactive Discussion EGU ✂✓✔✄✝✆✟✕✗✖✙✘✛✚ ✂✜✒✄✝✚✢✚✢✣✒✆ ✂✤✔✄✝✥✧✦★✘✩✠☞✪✧✣ ✂✫✬✄✝✭✩✁☎✜✒✚✢✆ ✂✮☎✄✝✕✗✍✡✣✒✪
Fig. 1. Sea level pressure for JJA. (a) PD for model mean (the counter interval is 4 hPa); (b)
Anomaly (LGM – PD) for model mean (the contour interval is 2 hPa); (c)–(g) same as (b) except for each model. In panels (b)–(g), heavy (light) shade indicates the positive (negative) anomaly larger than 2 hPa. The area marked by dots has the anomaly with the confidence level of 95 percent by Student’s t-test.
CPD
3, 655–678, 2007
East Asia and the North Pacific at LGM W. Yanase and A. Abe-Ouchi Title Page Abstract Introduction Conclusions References Tables Figures ◭ ◮ ◭ ◮ Back Close
Full Screen / Esc
Printer-friendly Version Interactive Discussion EGU ✂✓✔✄✝✆✟✕✗✖✙✘✛✚ ✂✜✒✄✝✚✢✚✢✣✒✆ ✂✤✔✄✝✥✧✦★✘✩✠☞✪✧✣ ✂✫✬✄✝✭✩✁☎✜✒✚✢✆ ✂✮☎✄✝✕✗✍✡✣✒✪
Fig. 2. Precipitation for JJA. (a) PD for model mean (the contours are drawn for 0.5, 1, 2, 5 and 10 mm/day); (b) Anomaly (LGM - PD) for model mean (the contours are drawn for ± 0.1, 0.2, 0.5, 1 and 2 mm/day); (c)–(g) same as (b) except for each model. In panels (b)-(g), heavy (light) shade indicates the positive (negative) anomaly larger than 0.1 mm/day. The area marked by dots has the anomaly with the confidence level of 95 percent by Student’s t-test.
CPD
3, 655–678, 2007
East Asia and the North Pacific at LGM W. Yanase and A. Abe-Ouchi Title Page Abstract Introduction Conclusions References Tables Figures ◭ ◮ ◭ ◮ Back Close
Full Screen / Esc
Printer-friendly Version Interactive Discussion EGU ✂✁☎✄✝✆ ✁☎✞✝✟☎✠☎✡☞☛✍✌✎✁✏✂✌✒✑✓✄ ✂✔✍✄✝✆ ✁☎✞✝✟☎✠☎✡✕☛✍✌✎✁✏✂✖✘✗✚✙ ✛✜✌✒✑✓✄ -1 0 1 2 3 4 5 6 20 30 40 50 60 Meridional Wind (m/s) latitude MIROC CCSM HADCM FGOALS IPSLMR ERA40 -2.5 -2 -1.5 -1 -0.5 0 0.5 1 20 30 40 50 60 Meridional Wind (m/s) latitude MIROC CCSM HADCM FGOALS IPSLMR ✂✢✣✄✝✌✒✤✦✥✧✢✣★✪✩✍★✫✞✦✁☎✔✍✬✪✥✮✭✯✁☎✞✦✥✧✤✰✂✌✒✑✓✄ ✂✱✍✄✝✌✒✤✦✥✣✢✧★✫✩✍★✪✞✲✁✳✔✍✬✫✥✮✭✯✁✳✞✲✥✧✤✰✂✖✘✗✚✙ ✛✴✌✒✑✓✄ 0 10 20 30 40 50 60 20 30 40 50 60 Precipitable Water (kg/m2) latitude MIROC CCSM HADCM FGOALS IPSLMR ERA40 -14 -12 -10 -8 -6 -4 -2 0 20 30 40 50 60 Precipitable Water (kg/m2) latitude MIROC CCSM HadCM FGOALS IPSLMR
Fig. 3. Meridional distributions of physical variables over East Asia (averaged between 105◦E and 135◦E). (a) Meridional wind at 850 hPa at PD (the unit is m/s); (b) Anomaly (LGM – PD) of meridional wind at 850 hPa (the unit is m/s); (c) Precipitable water at PD (the unit is kg/m2); (d) Anomaly of precipitable water (the unit is kg/m2).
CPD
3, 655–678, 2007
East Asia and the North Pacific at LGM W. Yanase and A. Abe-Ouchi Title Page Abstract Introduction Conclusions References Tables Figures ◭ ◮ ◭ ◮ Back Close
Full Screen / Esc
Printer-friendly Version Interactive Discussion EGU ✂✁☎✄✝✆✟✞✡✠☞☛✌✂✍✡✎✏✄ ✂✑✒✄✝✆✟✞✡✠☞☛ ✂✓✔✄✝✆✟✕✗✖✙✘✛✚ ✂✜✒✄✝✚✢✚✢✣✒✆ ✂✤✔✄✝✥✧✦★✘✩✠☞✪✧✣ ✂✫✬✄✝✭✩✁☎✜✒✚✢✆ ✂✮☎✄✝✕✗✍✡✣✒✪
CPD
3, 655–678, 2007
East Asia and the North Pacific at LGM W. Yanase and A. Abe-Ouchi Title Page Abstract Introduction Conclusions References Tables Figures ◭ ◮ ◭ ◮ Back Close
Full Screen / Esc
Printer-friendly Version Interactive Discussion EGU ✂✁☎✄✝✆ ✁☎✞✝✟☎✠☎✠☛✡✌☞✍✁✎✂☞✑✏✒✄ ✂✓✌✄✝✆ ✁☎✞✝✟☎✠☎✠✔✡✌☞✍✁✎✂✕✗✖✙✘ ✚✛☞✑✏✒✄ -10 0 10 20 30 40 20 30 40 50 60
Zonal Wind at 500hPa (m/s)
latitude MIROC CCSM HADCM FGOALS IPSLMR ERA40 -10 -8 -6 -4 -2 0 2 4 6 8 10 12 14 16 20 30 40 50 60
Zonal Wind at 500hPa (m/s)
latitude MIROC CCSM HADCM FGOALS IPSLMR ✂✜✢✄✝✆ ✁☎✞✝✣✤✟☎✠✥✡✌☞✍✁✦✧✕★✖✩✘ ✚✝☞✑✏✒✄ ✂✪✌✄✝☞✑✫✬✜✢✭✮✧✕★✖✩✘ ✚✝☞✑✏✒✄ -4 -2 0 2 4 6 8 20 30 40 50 60
Zonal Wind at 850hPa (m/s)
latitude MIROC CCSM HADCM FGOALS IPSLMR -2 -1.5 -1 -0.5 0 0.5 1 1.5 2 2.5 20 30 40 50 60 Precipitation (mm/day) latitude MIROC CCSM HADCM FGOALS IPSLMR ✂✯✢✄✝☞✑✫✬✯✰✜✢✱✲✭✌✱✳✞✬✁☎✓✌✴✲✯✶✵✷✁☎✞✬✯✰✫✸✂✕✗✖✙✘ ✚✝☞✑✏✒✄ ✂✹✺✄✝✻✌✼✌✫✬✹✾✽❀✿✶✱✲✫❂❁❃✯✰❄❅✭❆✽✝✂✕✗✖✙✘ ✚✛☞✑✏✒✄ -10 -9 -8 -7 -6 -5 -4 -3 -2 -1 0 1 20 30 40 50 60 Precipitable Water (kg/m2) latitude MIROC CCSM HADCM FGOALS IPSLMR -14 -12 -10 -8 -6 -4 -2 0 2 20 30 40 50 60
Surf. Air Temp (K)
latitude MIROC CCSM HADCM FGOALS IPSLMR
Fig. 6. Meridional distributions of physical variables over the North Pacific (averaged between
150◦E and 150◦W). (a) Zonal wind at 500 hPa for PD (the unit is m/s); (b) Anomaly (LGM – PD) of zonal wind at 500 hPa (the unit is m/s); (c) Anomaly of zonal wind at 850 hPa (the unit is m/s); (d) Anomaly of precipitation (the unit is mm/day); (e) Anomaly of precipitable water (the unit is kg/m2); (f) anomaly of surface air temperature (the unit is degrees Celsius).
CPD
3, 655–678, 2007
East Asia and the North Pacific at LGM W. Yanase and A. Abe-Ouchi Title Page Abstract Introduction Conclusions References Tables Figures ◭ ◮ ◭ ◮ Back Close
Full Screen / Esc
Printer-friendly Version Interactive Discussion EGU ✂✍✎✄✝✆✟✏✑☛✌✒✓✠ ✂✔✕✄✝✆✗✖ ✂✘✎✄✝✆✟✙✛✚✢✜✤✣ ✁☎✥✎✘✦✆✟✧✡✜✛★✑✠
Fig. 7. The anomalies associated with the water budget in JJA at LGM simulated by MIROC
CGCM (∆P RCP in MIROC model is given in Fig.2c). (a) ∆EV AP (the contours are drawn for ± 0.1, 0.2, 0.5, 1 and 2 mm/day). Heavy (light) shade indicates the positive (negative) anomaly larger than 0.1 mm/day. (b) As in (a) but for ∆HADV in Eq. (2) (c) ∆Q in Eq. (4) (c.i. is 2 kg/m2).
(d) ∆F LOW in Eq. (5) (arrow) and ∆CONV in Eq. (5) (the contours are ± 0.05, 0.1, 0.2 and 0.6 × 10⁻⁶ s−1). Heavy (light) shade indicates the positive (negative) anomaly larger than 0.05 × 10⁻⁶s−1.