HAL Id: hal-00303144
https://hal.archives-ouvertes.fr/hal-00303144
Submitted on 16 Oct 2007HAL is a multi-disciplinary open access
archive for the deposit and dissemination of sci-entific research documents, whether they are pub-lished or not. The documents may come from teaching and research institutions in France or abroad, or from public or private research centers.
L’archive ouverte pluridisciplinaire HAL, est destinée au dépôt et à la diffusion de documents scientifiques de niveau recherche, publiés ou non, émanant des établissements d’enseignement et de recherche français ou étrangers, des laboratoires publics ou privés.
Lightning activity in Brazilian thunderstorms during
TROCCINOX: implications for NOx production
H. Huntrieser, U. Schumann, H. Schlager, H. Höller, A. Giez, H.-D. Betz, D.
Brunner, C. Forster, O. Pinto, R. Calheiros
To cite this version:
H. Huntrieser, U. Schumann, H. Schlager, H. Höller, A. Giez, et al.. Lightning activity in Brazilian thunderstorms during TROCCINOX: implications for NOx production. Atmospheric Chemistry and Physics Discussions, European Geosciences Union, 2007, 7 (5), pp.14813-14894. �hal-00303144�
ACPD
7, 14813–14894, 2007 Lightning activity in Brazilian thunderstorms H. Huntrieser et al. Title Page Abstract Introduction Conclusions References Tables Figures ◭ ◮ ◭ ◮ Back Close Full Screen / EscPrinter-friendly Version Interactive Discussion
EGU
Atmos. Chem. Phys. Discuss., 7, 14813–14894, 2007 www.atmos-chem-phys-discuss.net/7/14813/2007/ © Author(s) 2007. This work is licensed
under a Creative Commons License.
Atmospheric Chemistry and Physics Discussions
Lightning activity in Brazilian
thunderstorms during TROCCINOX:
implications for NO
x
production
H. Huntrieser1, U. Schumann1, H. Schlager1, H. H ¨oller1, A. Giez2, H.-D. Betz3, D. Brunner4,*, C. Forster5,**, O. Pinto Jr.6, and R. Calheiros7
1
Institut f ¨ur Physik der Atmosph ¨are, Deutsches Zentrum f ¨ur Luft- und Raumfahrt (DLR), Oberpfaffenhofen, Germany
2
Flugabteilung, Deutsches Zentrum f ¨ur Luft- und Raumfahrt (DLR), Oberpfaffenhofen, Germany
3
Physics Department, University of Munich, Germany 4
Institute for Atmospheric and Climate Science, ETH Zurich, Switzerland 5
Norwegian Institute for Air Research (NILU), Atmosphere and Climate Change Department, Kjeller, Norway
6
National Institute for Space Research, INPE, Brazil 7
Instituto de Pesquisas Meteorol ´ogicas – Universidade Estadual Paulista, IPMet/UNESP, Bauru, Brazil
ACPD
7, 14813–14894, 2007 Lightning activity in Brazilian thunderstorms H. Huntrieser et al. Title Page Abstract Introduction Conclusions References Tables Figures ◭ ◮ ◭ ◮ Back Close Full Screen / EscPrinter-friendly Version Interactive Discussion
EGU
∗now at: Laboratory for Air Pollution and Environmental Technology, Empa, Swiss Federal
Laboratories for Materials Testing and Research, D ¨ubendorf, Switzerland ∗∗
now at: Institut f ¨ur Physik der Atmosph ¨are, Deutsches Zentrum f ¨ur Luft- und Raumfahrt (DLR), Oberpfaffenhofen, Germany
Received: 12 September 2007 – Accepted: 5 October 2007 – Published: 16 October 2007 Correspondence to: H. Huntrieser (heidi.huntrieser@dlr.de)
ACPD
7, 14813–14894, 2007 Lightning activity in Brazilian thunderstorms H. Huntrieser et al. Title Page Abstract Introduction Conclusions References Tables Figures ◭ ◮ ◭ ◮ Back Close Full Screen / EscPrinter-friendly Version Interactive Discussion
EGU Abstract
During the TROCCINOX field experiment in January and February 2005, the contribu-tion of lightning-induced nitrogen oxides (LNOx) from tropical and subtropical thunder-storms in Southern Brazil was investigated. Airborne trace gas measurements (NO, NOy, CO and O3) were performed up to 12.5 km with the German research aircraft
5
Falcon. During anvil penetrations in selected tropical and subtropical thunderstorms of 4 and 18 February, NOx mixing ratios were on average enhanced by 0.7–1.2 and 0.2–0.8 nmol mol−1 totally, respectively. The relative contributions of boundary layer NOx (BL-NOx) and LNOx to anvil-NOx were derived from the NOx-CO correlations. On average∼80–90% of the anvil-NOx was attributed to LNOx. A Lightning Location
10
Network (LINET) was set up to monitor the local distribution of cloud-to-ground (CG) and intra-cloud (IC) radiation sources (here called “strokes”) and compared with light-ning data from the operational Brazilian network RINDAT (Rede Integrada Nacional de Detecc¸ ˜ao de Descargas Atmosf ´ericas). The horizontal LNOx mass flux out of the anvil was determined from the mean LNOx mixing ratio, the horizontal outflow velocity and
15
the size of the vertical cross-section of the anvil, and related to the number of strokes contributing to LNOx. The values of these parameters were derived from the airborne measurements, from lightning and radar observations, and from a trajectory analysis. The amount of LNOx produced per LINET stroke depending on measured peak current was determined. The results were scaled up with the Lightning Imaging Sensor (LIS)
20
flash rate (44 flashes s−1) to obtain an estimate of the global LNOx production rate. The final results gave ∼1 and ∼2–3 kg(N) per LIS flash based on measurements in three tropical and one subtropical Brazilian thunderstorms, respectively, suggesting that trop-ical flashes may be less productive than subtroptrop-ical ones. The equivalent mean annual global LNOx nitrogen mass production rate was estimated to be 1.6 and 3.1 Tg a−1,
re-25
spectively. By use of LINET observations in Germany in July 2005, a comparison with the lightning activity in mid-latitude thunderstorms was also performed. In general, the same frequency distribution of stroke peak currents as for tropical thunderstorms over
ACPD
7, 14813–14894, 2007 Lightning activity in Brazilian thunderstorms H. Huntrieser et al. Title Page Abstract Introduction Conclusions References Tables Figures ◭ ◮ ◭ ◮ Back Close Full Screen / EscPrinter-friendly Version Interactive Discussion
EGU
Brazil was found. The different LNOx production rates per stroke in tropical thunder-storms compared with subtropical and mid-latitude thunderthunder-storms seem to be related to the different stroke lengths (inferred from comparison with laboratory data and ob-served lengths). In comparison, the impact of other lightning parameters as stroke peak current and stroke release height was assessed to be minor. The results from
5
TROCCINOX suggest that the different vertical wind shear may be responsible for the different stroke lengths.
1 Introduction
A general introduction to the LNOx topic and overviews of past and present measure-ments of LNOx in thunderstorms are given in accompanying papers by Huntrieser et
10
al. (2007) (HH07) and by Schumann and Huntrieser (2007) (SH07). Observations from local field experiments have been extrapolated to the global scale to estimate the aver-age amount of LNOx produced annually over the globe which is one crucial, yet highly uncertain, parameter in the global NOxbudget. A LNOx nitrogen mass source strength between 2 and 20 Tg a−1 has frequently been given in the literature in the past (WMO,
15
1995; Bradshaw et al., 2000). More recently, lower values between 1 and 14 Tg a−1 have been reported based on estimates from airborne and satellite measurements (Huntrieser et al., 2002; Beirle et al., 2004; Ridley et al., 2004; Boersma et al., 2005; Beirle et al., 2006; Ott et al., 2007b). Furthermore, chemical transport models (CTMs) have been used to reduce the LNOx range by a comparison of modelled NOx
concen-20
trations, for different LNOx source strengths and vertical distributions, with local field and satellite measurements. The results obtained with model fits indicate best-estimate values for the global LNOx nitrogen mass between 2 and 8 Tg a−1(SH07).
Different methods have been used to estimate the amount of LNOx based on ground-based, airborne and laboratory measurements, and theoretical calculations, as
re-25
viewed by SH07. Airborne NOxmeasurements can be combined with lightning obser-vations to estimate the amount of LNOx produced per flash or per metre flash length.
ACPD
7, 14813–14894, 2007 Lightning activity in Brazilian thunderstorms H. Huntrieser et al. Title Page Abstract Introduction Conclusions References Tables Figures ◭ ◮ ◭ ◮ Back Close Full Screen / EscPrinter-friendly Version Interactive Discussion
EGU
These numbers have been scaled up with the mean flash length and the annual global flash frequency. A large uncertainty in the estimate of LNOx still results from the as-sumed NO production rates by CG and IC flashes (Martin et al., 2007). It has been suggested that most components of a discharge produce NOx with varying, not deter-mined efficiencies (Chameides, 1986; Coppens et al., 1998; Dye et al., 2000; Rahman
5
et al., 2007). In addition, it has been pointed out that the different flash lengths for CG and IC flashes may play an important role in the LNOx production rate (Defer et al., 2003).
Results from the European Lightning Nitrogen Oxides Experiment (EULINOX) and Stratosphere-Troposphere Experiment: Radiation, Aerosols, and Ozone (STERAO)
10
(DeCaria et al., 2000; Fehr et al., 2004; DeCaria et al., 2005; Ridley et al., 2005; Ott et al., 2007b) indicate that IC flashes produce about as much NO per flash as CG flashes (IC/CG production ratio 0.5–2). In addition, laboratory results from Gallardo and Cooray (1996) and model simulations from Zhang et al. (2003) support that IC and CG flashes are similarly energetic. On the other hand, laboratory studies by Wang
15
et al. (1998) showed that LNOx depends less on energy and more on atmospheric pressure and the peak current of the flash. They concluded that “NO production per metre discharge length as a function of peak current appears to provide a more ap-propriate scaling factor for estimates of total global NO production”. The present study makes use of this finding by combining Wang et al. (1998) NOx measurements for
20
laboratory flashes with our NOx and lightning peak current measurements from the field. First results were briefly presented in Huntrieser et al. (2006), indicating differ-ences for tropical and subtropical thunderstorms in Brazil, which are discussed here in more detail. A further study is in preparation by Ott et al. (2007a1). The authors find that the mean peak currents and the NO production amounts per flash in five
25
different thunderstorms decrease with increasing latitude: the lowest value of NO
pro-1
Ott, L. E., Pickering, K. E., DeCaria, A. J., Stenchikov, G. L., Lin, F.-F., Wang, D., Lang,
S., and Tao, W.-K.: Production of lightning NOx and its vertical distribution calculated from 3-D
ACPD
7, 14813–14894, 2007 Lightning activity in Brazilian thunderstorms H. Huntrieser et al. Title Page Abstract Introduction Conclusions References Tables Figures ◭ ◮ ◭ ◮ Back Close Full Screen / EscPrinter-friendly Version Interactive Discussion
EGU
duction (360 moles/flash) was found for a EULINOX storm (48◦N) and the largest value of NO production (700 moles/flash) was found for a CRYSTAL-FACE storm (26◦N). Re-cently, Barthe et al. (2007) incorporated the relationship between produced LNOx per m laboratory spark and atmospheric pressure according to Wang et al. (1998) in their simulations with an explicit electrical scheme and a 3-D mesoscale model (Meso-NH).
5
Up to now, only a few airborne experiments have been conducted that are suit-able to provide an estimate of the LNOx production rate in the tropics (see SH07). In this paper we present measurements from the “Tropical Convection, Cirrus and Nitro-gen Oxides Experiment“ (TROCCINOX) carried out in the wet season in January and February 2005 in the State of S ˜ao Paulo and its surroundings in southern Brazil (10◦S
10
to 28◦S and 38◦W to 55◦W). Both tropical and subtropical thunderstorms were inves-tigated, since the operation area was located along the South Atlantic convergence zone (SACZ) (HH07). The main questions of this study are: 1.) How much LNOx is produced by these tropical and subtropical thunderstorms? 2.) What are the relative contributions from strokes with different peak currents? 3.) How large is the LNOx
pro-15
duction rate per stroke or flash? 4.) Is this LNOx production rate different for tropical and subtropical thunderstorms? 5.) What are the possible reasons for the difference? 6.) Can the findings from TROCCINOX help to explain the large LNOx productivity observed in Florida thunderstorms during CRYSTAL-FACE?
To answer these questions we analyse airborne measurements of NO, NOy, CO,
20
and O3 mixing ratios, the J(NO2) photolysis rate and meteorological parameters per-formed in the outflow of thunderstorms, trajectory analyses with the FLEXPART model and measurements from LINET, which was set up during TROCCINOX to monitor the local lightning distribution (Sect. 2). This system registers very low and low frequency (VLF/LF) radiation sources (here called “strokes”) from both CG and IC flashes. LINET
25
data are compared with data from the operational Brazilian lightning detection network RINDAT (Sect. 3) and with LIS data (Sect. 4). Airborne NOx and ground-based light-ning measurements are combined to give an estimate of the amount of LNOx produced per LINET stroke, and as a function of peak current according to Wang et al. (1998)
ACPD
7, 14813–14894, 2007 Lightning activity in Brazilian thunderstorms H. Huntrieser et al. Title Page Abstract Introduction Conclusions References Tables Figures ◭ ◮ ◭ ◮ Back Close Full Screen / EscPrinter-friendly Version Interactive Discussion
EGU
(Sect. 4). From the ratio between LIS and LINET during one overpass, the amount of LNOx per LIS flash is determined. Knowing the global and annual LIS flash rate (44± 5 flashes s−1, Christian et al., 2003; Christian and Petersen, 2005), the equivalent annual global LNOx production rate based on individual TROCCINOX thunderstorms is estimated (Sect. 4). The different LNOx production rates estimated in tropical and
5
subtropical thunderstorms are investigated through a comparison of LINET measure-ments, e.g. frequency distributions of stroke peak currents and mean peak currents (Sect. 5). In addition, the lightning properties are compared with those in mid-latitude thunderstorms over Germany, where the same lightning location network (LINET) was set up in July 2005. Airborne NOx measurements over Germany are available from
10
previous campaigns (Huntrieser et al., 1998, 2002), but not for July 2005 (Sect. 5). The results are discussed and summarised in Sects. 6–7. The present study is the first to our knowledge that investigates whether tropical, subtropical and mid-latitude thunderstorms have different potentials to produce LNOx by combining lightning peak current measurements with airborne NOxand meteorological measurements.
15
2 Data and model description
For general information on the TROCCINOX field experiment, see the papers by Schu-mann et al. (2004), HH07 and SH07. The following subsections describe the airborne data obtained mainly from the research aircraft Falcon of the Deutsches Zentrum f ¨ur Luft- und Raumfahrt (DLR) as well as partly from the Russian M55 Geophysica aircraft
20
(Sect. 2.1), lightning data from LINET, LIS and RINDAT (Sect. 2.2) and model simula-tions from FLEXPART (Sect. 2.3). In addition, we use data from two S-band Doppler radars in Bauru (22.4◦S, 49.0◦W) and in Presidente Prudente (22.1◦S, 51.4◦W) oper-ated by the Instituto de Pesquisas Meteorol ´ogicas (IPMet). Two different radar reflec-tivity products are presented: surveillance Plan Position Indicator (PPI, range 450 km)
25
and 3.5 km Constant Altitude PPI (CAPPI, range 240 km). The meteorological envi-ronment of tropical, subtropical and mid-latitude thunderstorms was characterised with
ACPD
7, 14813–14894, 2007 Lightning activity in Brazilian thunderstorms H. Huntrieser et al. Title Page Abstract Introduction Conclusions References Tables Figures ◭ ◮ ◭ ◮ Back Close Full Screen / EscPrinter-friendly Version Interactive Discussion
EGU
analysis data (temperature, water vapour mixing ratio, pressure, wind velocity and di-rection) from the European Centre for Medium Range Weather Forecasts (ECMWF) with 3 h temporal resolution, 1◦ horizontal resolution and 60 vertical levels. The equiv-alent potential temperature is calculated as described in HH07. The separation of tropical and subtropical air masses is based on meteorological data, as already
dis-5
cussed for the two selected flights of 4 and 18 February 2005 in HH07. The 4 and 18 February flights were classified as tropical and subtropical, respectively.
2.1 Airborne instrumentation: Falcon and Geophysica
Airborne measurements up to 12.5 km were carried out with the Falcon, which was equipped with DLR instruments to measure NO, NOy, O3, CO and J(NO2). The
chemi-10
cal instrumentation is the same as that used during several DLR field campaigns in the past (HH07). Position, altitude, temperature, humidity, pressure and the 3-dimensional wind vector (u, v and w) were measured with the standard Falcon meteorological mea-surement systems (Schumann et al., 1995). Wind and pressure were measured with a Rosemount flow angle sensor (model 858) at the Falcon’s noseboom tip. The
aero-15
dynamic measurements were analysed according to an extensive in-flight calibration programme (B ¨ogel and Baumann, 1991).
In addition, NO and CO measurements were obtained from the high-flying Geo-physica aircraft (∼20 km) (Stefanutti et al., 2004). The SIOUX instrument, developed and operated by the DLR, measures the NO mixing ratio (chemiluminescence
tech-20
nique) with a time resolution of 1 s, and an accuracy and precision of 10% and 5%, respectively. The CO-TDL instrument (cryogenic Tunable Diode Laser technique) op-erated by the Istituto Nazionale di Ottica Applica/Consiglio Nazionale delle Ricerche (INOA/CNR), measures the CO mixing ratio with an averaging time of 5 s, the accuracy and precision being 5% and 2%, respectively.
25
All flight altitude values refer to pressure height and all times to UTC (Coordinated Universal Time) time (see also HH07).
ACPD
7, 14813–14894, 2007 Lightning activity in Brazilian thunderstorms H. Huntrieser et al. Title Page Abstract Introduction Conclusions References Tables Figures ◭ ◮ ◭ ◮ Back Close Full Screen / EscPrinter-friendly Version Interactive Discussion
EGU
2.2 Lightning measurements: LINET, LIS and RINDAT
During the TROCCINOX field campaign from 21 January to 27 February 2005, the VLF/LF (5–300 kHz) lightning detection network LINET was used to monitor the local lightning distribution with high spatial resolution. LINET was set up by DLR in coop-eration with IPMet. The network included six sensors from DLR to observe the area
5
19.5–24.5◦S and 46.5–51.5◦W (see Table 1). The average distance to the next closest sensor was∼80 km. For comparison of lightning characteristics, measurements from southern Germany in summer 2005 with 19 sensors (from both DLR and the University of Munich), monitoring the area 47–51◦N and 5–14◦E, were also included in this study (Table 1). The average distance to the next closest sensor was∼80 km in the outer
10
region and∼20 km in the inner region. The basically similar features of the LINET ar-rays in Germany and Brazil allow comparison of the characteristics of thunderstorms systems in both regions (Schmidt et al., 2005).
The LINET system has been developed by the University of Munich and the sen-sor technology and measurement procedures have been described in detail by Betz et
15
al. (2004), Schmidt et al. (2004, 2005), Betz et al. (2007) and Schmidt (2007). For an overview of system characteristics see SH07. LINET continuously measures the transient magnetic components of VLF/LF emissions from lightning discharges. These signals are emitted by certain components of the flashes, and therefore a direct com-parison with published flash statistics (e.g., IC/CG ratio) is not possible. At the current
20
stage, VLF sources are considered separately. A routine algorithm to combine them into flashes is under development. In Sect. 6a small set of strokes were combined manually to flash “components”, which indicate that LINET locates few VLF strokes per flash components (on average 3 and up to 9).
It is known that the amplitude of a measured electromagnetic signal is proportional to
25
the peak current (Uman et al., 1975; Rakov et al., 1992; Cummins et al., 1998; Orville, 1999; Jerauld et al., 2005; Schulz et al., 2005). Thus, the peak current of LINET strokes is estimated from the VLF pulse amplitude. The registered amplitude depends on the
ACPD
7, 14813–14894, 2007 Lightning activity in Brazilian thunderstorms H. Huntrieser et al. Title Page Abstract Introduction Conclusions References Tables Figures ◭ ◮ ◭ ◮ Back Close Full Screen / EscPrinter-friendly Version Interactive Discussion
EGU
distance between the VLF pulse and the measuring LINET sensor. The registered pulse is normalised by the reciprocal value of the distance between pulse source and sensor, and averaged over all sensors that registered the VLF pulse. Owing to refined antenna techniques, optimised waveform handling and a shorter sensor base line of
<100 km, a high detection efficiency of low peak currents is possible. The detection
5
efficiency, stroke-current dependent, is highest in the LINET centre area (2◦×2◦) and decreases rapidly down to 30% towards the periphery. Currents as low as∼1–2 kA can be detected by the system within the LINET centre area (periphery∼5 kA). In compar-ison, most other VLF/LF lightning networks report only strokes>5–10 kA (Cummins et
al., 1998).
10
In addition to LINET data, spaceborne measurements from LIS on board the Tropi-cal Rainfall Measurement Mission (TRMM) satellite (Christian et al., 1999; Thomas et al., 2000; Boccippio et al., 2002) were used to estimate the total regional flash density (sum of CG and IC flashes) over the TROCCINOX area. For an overview of system characteristics see SH07. Locally, the duration of a measurement is 90 s, which is
15
long enough to estimate the flashing rate of most thunderstorms in the field of view during the passage (see http://thunder.msfc.nasa.gov/lis/). At noon the detection ef-ficiency is 73±11% and at night 93±4% (Boccippio et al., 2002). Here we used LIS science products (total count of flashes) from the “LIS space time domain search” (see
http://thunder.nsstc.nasa.gov/lightning-cgi-bin/lis/LISSearch.pl). A recent comparison
20
between LIS and LINET data showed a good agreement between two systems that are based on completely different measurement techniques (Schmidt et al., 2005). Here LIS data for one overpass of 4 February 2005 were compared with LINET data (see Sect. 4.5). LNOx estimates per LINET stroke were scaled up with LIS observations to provide an estimate of the regional and global strength of the LNOx production.
25
LINET data were also compared with data from the operational Brazilian lightning detection network RINDAT (seehttp://www.rindat.com.br/). Like LINET, RINDAT oper-ates in the VLF/LF range. The detection efficiency for strokes with peak currents above 10 kA is 80–90% and the location accuracy is 0.5–2.0 km (Pinto and Pinto, 2003). The
ACPD
7, 14813–14894, 2007 Lightning activity in Brazilian thunderstorms H. Huntrieser et al. Title Page Abstract Introduction Conclusions References Tables Figures ◭ ◮ ◭ ◮ Back Close Full Screen / EscPrinter-friendly Version Interactive Discussion
EGU
RINDAT system mainly registers CG flashes. A recent comparison between LINET and RINDAT strokes indicates reasonable agreement for CG strokes when LINET peak cur-rents are above 12 kA (Schmidt et al., 2005); see further comparisons in Sect. 3. 2.3 Transport modelling: FLEXPART
The distribution of LNOx in the vicinity of thunderclouds was simulated with the
La-5
grangian particle dispersion model FLEXPART. General information on FLEXPART used for TROCCINOX is given in HH07. The model has mainly been used for studying long-range air pollution transport (e.g. Stohl et al., 2003a, b; Huntrieser et al., 2005), but also to investigate LNOx transport (Stohl et al., 2003b; Beirle et al., 2006; Cooper et al., 2006).
10
The LNOx emissions used here as input for FLEXPART were based on lightning stroke data from the LINET system. LNOx was released uniformly in the vertical be-tween 5 km (freezing level with negative charge centre) and 13 km altitude (cloud top) at the accurate horizontal position of observed VLF sources. Because of the low resolu-tion of the ECMWF wind fields (0.5◦horizontally) used as input for FLEXPART (HH07),
15
the distribution of lightning sources is assumed to be uniform in the vertical. A hundred particles were released per stroke, carrying the mass of LNOx produced (here set to 1 kg). The convection scheme, used in these FLEXPART applications, transports the particles upward into the anvil, from where they follow trajectories computed with the ECMWF wind fields. No quantitative estimate of the amount of LNOx is possible from
20
these simulations; they can, however, be used to estimate the extension of the LNOx field advected out of the anvil region.
3 Observations during the field experiment
An overview of the observations on the two selected TROCCINOX days, 4 and 18 February 2005 with thunderstorms in tropical and subtropical air masses, respectively,
ACPD
7, 14813–14894, 2007 Lightning activity in Brazilian thunderstorms H. Huntrieser et al. Title Page Abstract Introduction Conclusions References Tables Figures ◭ ◮ ◭ ◮ Back Close Full Screen / EscPrinter-friendly Version Interactive Discussion
EGU
is given in HH07. Here we briefly focus on the performance of the lightning detection network LINET (Sect. 3.1) and on the representation of the Falcon measurements in the anvil outflow (Sect. 3.2).
3.1 Performance of LINET compared with RINDAT
To evaluate the performance of the LINET system in more detail, a comparison with
5
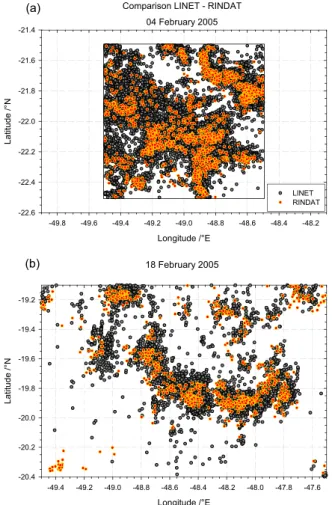
the operational lightning detection network in Brazil (RINDAT) was carried out for 4 and 18 February 2005. Horizontal distributions of RINDAT and LINET strokes were com-pared for the LINET centre area on 4 February 2005 (Fig. 1a), and for the northern LINET periphery area on 18 February 2005 (Fig. 1b), 00:00 UTC–24:00 UTC. Overall, a general agreement was found, but with a slight shift of RINDAT strokes to the west
10
compared with LINET strokes. In some areas the density of LINET strokes was much larger than of RINDAT strokes (probably because IC strokes and strokes with low peak are not registered by RINDAT). The correlations between LINET and RINDAT peak cur-rents (absolute values) for 222 and 173 selected strokes of 4 February (21.5–22.5◦S and 48.5–49.5◦W) and 18 February (19.4–20.0◦S and 47.7–49.2◦W) are shown in
15
Figs. 2a and b, respectively. On 4 February only negative CG strokes were com-pared. On 18 February no separation between CG and IC strokes was possible for the LINET data, owing to the location of the selected strokes along the northern periph-ery area. LINET strokes were therefore compared with both positive and negative CG strokes from RINDAT. About 10% of the selected LINET strokes were positive ones.
20
The strokes shown in Fig. 2 were selected manually to represent peak current values over the entire current range. LINET peak currents above 13–14 kA are in general also detected by RINDAT, occasionally even LINET peak currents down to 7 kA. The slope (0.83) seen in Fig. 2a indicates that a 20 kA LINET stroke is on average registered as 14 kA by RINDAT. In Fig. 2b the slope is slightly lower (0.68) owing to the lower LINET
25
detection efficiency along the northern periphery. In addition, the mean peak current is higher for LINET strokes (35 kA in Fig. 2a and 31 kA in Fig. 2b) than for RINDAT strokes (27 kA in Fig. 2a and 20 kA in Fig. 2b). The high correlation coefficient (r2=
ACPD
7, 14813–14894, 2007 Lightning activity in Brazilian thunderstorms H. Huntrieser et al. Title Page Abstract Introduction Conclusions References Tables Figures ◭ ◮ ◭ ◮ Back Close Full Screen / EscPrinter-friendly Version Interactive Discussion
EGU
0.92 and 0.95, respectively) between the peak currents of the two systems indicates a good agreement in general. Lower RINDAT CG+ peak currents (<30 kA) are
fre-quently registered as IC+ by LINET (∼40%) and stronger RINDAT CG- peak currents (>100 kA) are frequently registered as IC- by LINET (∼40%). This finding can be
com-pared with results from EULINOX in Germany where flashes registered with a LPATS
5
system (same technology as used for RINDAT) were compared with the French Of-fice National d’Etudes et de Recherches A ´erospatiales (ONERA) VHF interferometer measurements. Th ´ery (2001) found that 61% of the positive LPATS flashes (those of low intensity) and 32% of the negative LPATS flashes were in fact IC flashes. A re-cent study by Pinto et al. (2007) also confirmed that a large perre-centage of the positive
10
CG flashes registered by RINDAT over Brazil are in fact IC flashes. For the analysed dataset we found that weak positive RINDAT peak currents (<10 kA) are occasionally
(<10%) registered as negative strokes by LINET.
3.2 NOxin the anvil outflow derived from aircraft measurements
In HH07 it was briefly discussed whether the outflow altitude where LNOx maximises
15
was reached with the Falcon aircraft (important question for comparison with results from other field campaigns and for further calculations in Sect. 4). It was concluded that this altitude was reached with certainty on 18 February, but on 4 February the Falcon measured the largest mixing ratios in the uppermost flight levels so that larger mixing ratios at higher altitudes inside the anvil cannot be excluded. Therefore, for
20
the latter day measurements from the high-flying Geophysica in the upper part of this thunderstorm were briefly analysed as discussed below.
The Falcon measurements in two of the anvils of 4 February (anvil 1a and 5a, listed in Table 2a and described in Sect. 4.1) can be compared with coincident measure-ments with the high-flying Geophysica. The Geophysica penetrated anvil 1a during
25
ascent between 15.9 and 16.6 km (penetration at flight time: 67 070–67 298 s, at posi-tion: 21.3–21.5◦S and 49.1–49.3◦W) and anvil 5a during descent between 17.2 and 16.5 km (penetration at flight time: 66 569–66 696 s, at position: 21.8–21.9◦S and
ACPD
7, 14813–14894, 2007 Lightning activity in Brazilian thunderstorms H. Huntrieser et al. Title Page Abstract Introduction Conclusions References Tables Figures ◭ ◮ ◭ ◮ Back Close Full Screen / EscPrinter-friendly Version Interactive Discussion
EGU
48.5–48.7◦W). The mean NO mixing ratios in anvil 1a and anvil 5a were 0.30 and 0.35 nmol mol−1, respectively. The mean anvil-NO mixing ratio is the mean value of all NO 1s-values measured between the entrance and exit of the anvil (determined from the distinct increase and decrease in the NO mixing ratio). The mean mixing ratios measured by the Geophysica between∼16–17 km altitudes are distinctly lower than the
5
NO mixing ratios measured by the Falcon at lower altitudes (10.6–10.7 km): 0.80 and 1.16 nmol mol−1in anvil 1a and anvil 5a, respectively. The Geophysica measurements in the anvils on 4 February indicate an increase in NO mixing ratios with decreasing altitude, opposite to the Falcon measurements. Hence the outflow level where NO mix-ing ratios maximise was likely to be located between the altitudes at which the Falcon
10
and Geophysica penetrated the anvils. CO measurements from the Geophysica (per-sonal communication P. Mazzinghi, INOA/CNR) can be used to determine this outflow level more precisely (on the assumtion that LNOx maximises where CO maximises). The vertical CO profile (ascent and descent in the vicinity of the selected anvils) shows enhanced mixing ratios mainly between∼10–14 km altitudes. The mixing ratios were
15
rather constant throughout this layer,∼130–140 nmol mol−1. The outflow level, where the CO mixing ratio maximises (132–138 nmol mol−1), was located between ∼12.0– 12.5 km, about 1.5–2 km above the Falcon penetration. At the levels where the Falcon penetrated the anvils (10.6–10.7 km), however, the CO mixing ratio (132 nmol mol−1) was similar to the lowest Geophysica CO mixing ratios in the outflow level. The Falcon
20
data may therefore underestimate the mean NO mixing ratios in the selected anvils to a degree which cannot be quantified from the available dataset. These mean NO mixing ratios are needed for further calculations in the next section. Preliminary results from cloud-resolved modelling for the 4 February thunderstorms by Pickering et al. (2007) suggest that the anvil outflow NO maximum is located between 12 and 13 km, which
25
ACPD
7, 14813–14894, 2007 Lightning activity in Brazilian thunderstorms H. Huntrieser et al. Title Page Abstract Introduction Conclusions References Tables Figures ◭ ◮ ◭ ◮ Back Close Full Screen / EscPrinter-friendly Version Interactive Discussion
EGU 4 Estimate of the LNOx production rate per flash and per year
In this section the measurements in selected tropical and subtropical thunderstorms of 4 and 18 February 2005 are discussed in more detail. The spatial and temporal dis-tributions of LINET strokes are presented (Sect. 4.1). The contribution from observed LINET strokes to measured anvil-NOx mass and the resulting LINET stroke rates are
5
estimated (Sect. 4.2). Furthermore, the contribution of BL-NOxand LNOx to measured anvil-NOxis estimated (Sect. 4.3). The horizontal LNOx mass flux rate out of the anvils is calculated by means of estimated LNOx mixing ratios and horizontal outflow wind ve-locities from the flights combined with the size of the vertical cross-section of the anvils (Sect. 4.4). LNOx nitrogen mass flux rates (g s−1) and LINET stroke rates (strokes s−1)
10
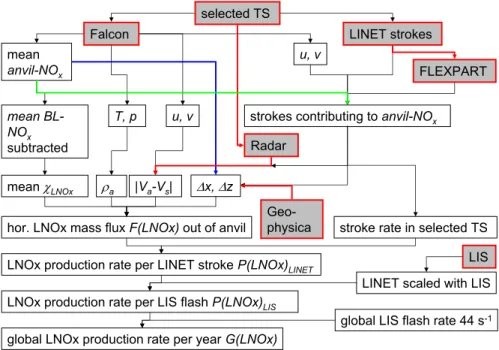
are combined to estimate the production rate of LNOx (in g of nitrogen mass or number of NOx molecules) per LINET stroke and per LIS flash (Sect. 4.5). Finally, the annual global LNOx nitrogen mass production rate is estimated (in Tg a−1). Figure 3 gives an overview of these different steps described in detail in the following subsections, starting with the selection of a thunderstorm (TS) and ending with an estimate of the
15
annual global LNOx production rate G(LNOx). 4.1 Spatial and temporal LINET stroke distributions
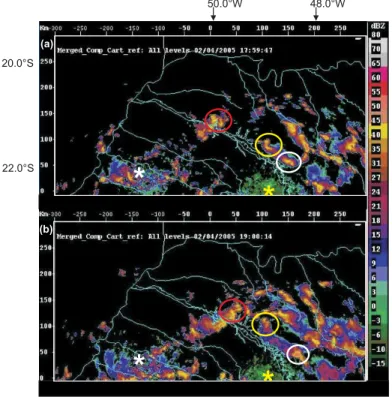
The spatial distributions of LINET strokes of 4 and 18 February 2005 are shown in Figs. 4a and b, respectively. For the selected thunderstorms, strokes occurring before the penetrations by the Falcon are highlighted in colour. Superimposed is the Falcon
20
track showing the successful, repeated penetrations of the subtropical thunderstorm system of 18 February, and the zigzag pattern between the tropical thunderstorms (labelled 1a, 5a and 2b) of 4 February. The time periods of the anvil penetrations are listed in Table 2a. The direction of the thunderstorm movement (red arrows in Fig. 4) is inferred from lightning data. The main wind direction in the anvil outflow (green
25
arrows), as inferred from Falcon wind measurements, controls the transport of LNOx out of the anvils. On 4 February the main wind direction in the flight level (influenced
ACPD
7, 14813–14894, 2007 Lightning activity in Brazilian thunderstorms H. Huntrieser et al. Title Page Abstract Introduction Conclusions References Tables Figures ◭ ◮ ◭ ◮ Back Close Full Screen / EscPrinter-friendly Version Interactive Discussion
EGU
by the Bolivian High, see Fig. 5c in HH07) varied between north-east and south-east in vicinity of anvil 1a and 2b, and was from the south-west in the vicinity of anvil 5a. The NOx mixing ratio along the flight track is also superimposed in Fig. 4. Elevated mixing ratios exceeding 0.6 nmol mol−1 NOx were frequently measured in the anvil outflow downstream of nearby lightning strokes.
5
The selected thunderstorms of 4 and 18 February occurred in the centre and at the northern border line of the LINET network, respectively. Because of a higher sen-sitivity in the network centre, the fraction of strokes with low currents (<10 kA) was
much higher on 4 February (87%) than on 18 February (45%). For the latter thun-derstorm system no separation between IC and CG strokes was possible because of
10
the large distance from the centre. For an adequate comparison of the stroke rates in these storms, it was necessary to restrict comparisons to higher stroke peak currents (≥10 kA) which were observed with about the same detection efficiency, independently of their location within the LINET network. On 4 February strokes were widespread with some at the LINET periphery. LINET strokes were therefore compared with LIS
15
flashes and RINDAT strokes to determine the detection efficiency of the LINET system relative to the other two systems. The change in detection efficiency for these selected LINET strokes towards the LINET periphery was only minor (<10%) compared with the
other two systems and not considered further.
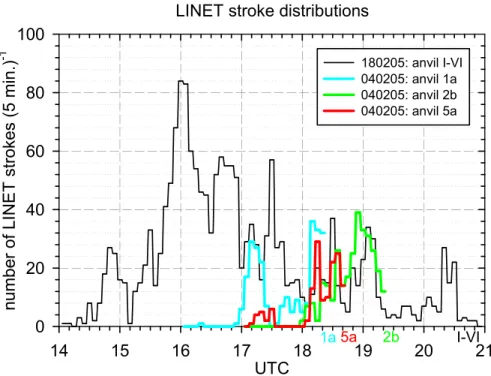
The temporal distributions of LINET stroke rates in the selected thunderstorms for
20
peak currents≥10 kA are presented in Fig. 5. The storms of 4 February were mainly in a mature stage during the aircraft passage. In comparison, the long-lived storm system of 18 February was in a decaying stage and probed long after the peak lightning activity (first lightning was registered already 6 h before the first penetration).
4.2 Contribution of LNOx to anvil-NOx and determining LINET stroke rates
25
For evaluation of the LNOx production rate per stroke, it is necessary to estimate which of the LINET strokes during the storm lifetime contributed to the measured anvil-NOx enhancement and its horizontal and vertical extension. This is a very difficult task
ACPD
7, 14813–14894, 2007 Lightning activity in Brazilian thunderstorms H. Huntrieser et al. Title Page Abstract Introduction Conclusions References Tables Figures ◭ ◮ ◭ ◮ Back Close Full Screen / EscPrinter-friendly Version Interactive Discussion
EGU
which might be best performed by using cloud-scale modelling. First cloud-resolving model simulations have been performed for selected TROCCINOX storms of 4 Febru-ary 2005 by Chaboureau et al. (2007) and by Pickering et al. (2007) but cloud-resolving simulations are presently not available for the thunderstorm system of 18 February 2005. Instead we make use of FLEXPART lightning tracer simulations, as explained
5
in Sect. 2.3. The simulations follow lightning tracers from the horizontal LINET stroke distributions (Fig. 4b) using ECMWF wind fields. For the long-lived thunderstorm case of 18 February, ambient wind velocities were strong and LNOx was advected far down-wind. The ECMWF wind agrees well with Falcon measurements of wind velocity and direction, except in the core of the anvil penetrations (Fig. 6). As shown later in this
10
section, comparison of the ECMWF wind fields and FLEXPART results with radar and airborne wind and anvil-NOx observations, as indicated in Fig. 3, supports the validity of the FLEXPART simulations of the 18 February thunderstorm system, in spite of the coarse horizontal resolution (0.5◦) of the ECMWF wind velocity fields used.
For the thunderstorm system of 18 February, a time sequence of FLEXPART
light-15
ning tracer simulations (Fig. 7) indicates a rather fast development of an elongated area with enhanced LNOx downwind of the storm system, following the wind in the upper troposphere (UT). Tracer distributions for six different simulations are shown in this figure (output resolution: 30 min and 0.08 degrees, horizontal cross-sections at 10 km altitude corresponding to the flight level) considering transport of emissions from
20
strokes in various time intervals. The simulated tracer distributions may be compared with the anvil-NOx observations from the Falcon (Fig. 4b). Only the last four simula-tions (Fig. 7c–f) indicate distinctly enhanced LNOx along the right anvil transect, as observed by the Falcon. Furthermore, mixing ratios in the left transects, closer to the core, were twice as high as in the right transects. Given the measured UT wind
veloc-25
ity of 15 to 20 m s−1, it is clear that strokes that occurred between 19:00–19:30 UTC (along the left anvil transect, 49.7–49.8◦W) or earlier do not contribute to the anvil-NOx enhancement observed along the right anvil transect. The air with enhanced LNOx is advected further downwind to the right in Figs. 7d–f. Only strokes after 19:30 and
be-ACPD
7, 14813–14894, 2007 Lightning activity in Brazilian thunderstorms H. Huntrieser et al. Title Page Abstract Introduction Conclusions References Tables Figures ◭ ◮ ◭ ◮ Back Close Full Screen / EscPrinter-friendly Version Interactive Discussion
EGU
fore 20:55 UTC (when the storm decayed) (Fig. 7c) were therefore considered to have contributed to the observed anvil-NOx. During this 85 min period about 130 strokes with peak currents≥10 kA were detected, corresponding to a stroke rate of 0.025 strokes s−1(Table 2a).
For the 18 February 2005 thunderstorm system, the horizontal extension (∆x) of
5
FLEXPART lightning tracer in Fig. 7c, perpendicular to the wind direction (see Fig. 4b), was estimated to be ∼30–35 km. This width agrees well with the extension of the flight path segment with enhanced NOxobserved during the single anvil transects (28– 35 km); see the grey scale along the flight track in Fig. 4b and Table 2. This parameter (∆x) will be used to estimate the horizontal LNOx mass flux out of the anvil in Sect. 4.4.
10
Finally, a radar image of the 18 February thunderstorm system (Bauru radar, eleva-tion angle 0◦), indicates a pronounced, elongated structure of the storm system (Fig. 8), similar to the FLEXPART result at 10 km altitude. The 18 February thunderstorm sys-tem is located in the upper, northern domain of the radar range, about 240 km from the radar site. Unfortunately, the radar information is sparse in this region and no more
15
detailed data are available since the domain is out of the quantification range where volumetric data are collected.
For the thunderstorms of 4 February, no FLEXPART simulations were performed since the storms just developed∼1 h ago and this time was considered too short for realistic simulations. In addition, the ambient UT wind velocities were low (4–7 m s−1)
20
and LNOx remained in the vicinity of the storms. Instead, as indicated in Fig. 3, the LNOx production rate per stroke and the width ∆x were estimated from a combination of horizontal LINET stroke distributions, radar images, Falcon wind and anvil-NOx ob-servations. The average altitude (arithmetical mean) of all IC strokes (Table 4a) in anvil 1a (10.0 km) and anvil 5a (11.6 km) was below or just above the flight level (10.6 km and
25
10.7 km, respectively; see Table 2a), indicating that the majority of LNOx, produced by the observed strokes left the anvil at about the flight level.
It is assumed that all LINET strokes observed in the vicinity of these storms between storm initiation and Falcon penetration (coloured in Fig. 4a) contributed to the observed
ACPD
7, 14813–14894, 2007 Lightning activity in Brazilian thunderstorms H. Huntrieser et al. Title Page Abstract Introduction Conclusions References Tables Figures ◭ ◮ ◭ ◮ Back Close Full Screen / EscPrinter-friendly Version Interactive Discussion
EGU
anvil-NOx(Fig. 4a). (This is a working hypothesis with large uncertainties, which cannot be quantified without cloud-model simulations.) For comparison with the 18 February case, only the number of strokes with peak currents ≥10 kA is counted. In anvil 1a about 278 strokes were registered between 16:55 and 18:20 UTC, in anvil 5a about 130 strokes were registered between 18:05 and 18:45 UTC and in anvil 2b about 311
5
strokes were registered between 17:55 and 19:20 UTC; see Fig. 5, which corresponds to the following stroke rates: 0.055, 0.054 and 0.061 strokes s−1, respectively (see Table 2a).
For each of the three anvil penetrations, the width (∆x) of the LNOx plume perpendic-ular to the wind direction was estimated from the horizontal LINET stroke distribution,
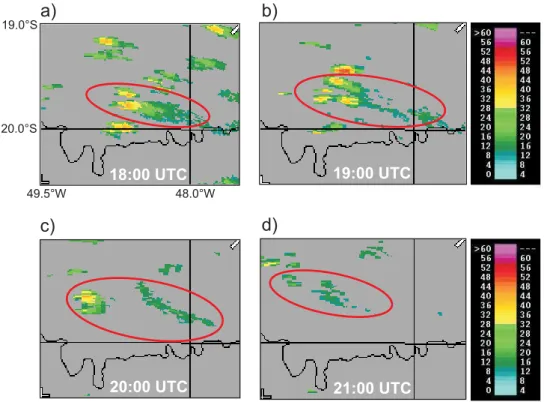
10
from the anvil-NOx observations (Fig. 4a) and from the radar images at the time of the penetrations (shown only hourly in Fig. 9). The ∆x values are∼35, ∼25 and ∼45 km for anvils 1a, 5a and 2b, respectively (see Table 2a).
4.3 Contribution of BL-NOxto anvil-NOx
The boundary layer (BL) contribution (χBL−NOx) to the NOx mixing ratio in the anvil
15
(χAnvil−NOx) is derived from the correlation between NOx and CO mixing ratios in the BL and in the anvil. It is assumed, that BL air is transported upwards rapidly within strong, well-developed updrafts with little ambient mixing and without chemical loss of NOx and CO. Hence, about the same CO mixing ratio is observed in the main anvil outflow (χAnvil−CO) as in the BL layer (χBL−CO):
20
χAnvil−CO =χ
BL−CO (1)
and LNOx (χLNOx) is the difference between anvil-NOxand BL-NOx:
χLNOx=χAnvil−NOx− χBL−NOx (2)
These assumptions are supported by cloud-model simulations (Pickering et al., 1992; Thompson et al., 1997; Ott et al., 2007b) and airborne thunderstorm observations
25
ACPD
7, 14813–14894, 2007 Lightning activity in Brazilian thunderstorms H. Huntrieser et al. Title Page Abstract Introduction Conclusions References Tables Figures ◭ ◮ ◭ ◮ Back Close Full Screen / EscPrinter-friendly Version Interactive Discussion
EGU
Huntrieser et al., 2002; Lopez et al., 2006; Bertram et al., 2007; Koike et al., 2007). The ratio of NOx to CO in the BL (<2 km) is conserved during the rapid upward transport
into the anvil:
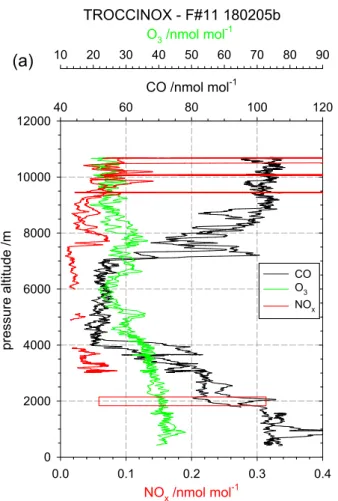
χBL−NOx/χBL−CO = (χAnvil−NOx− χLNOx)/χAnvil−CO (3) Vertical NOx, CO, and O3-profiles from the 18 February flight are shown in Fig. 10a.
5
The CO mixing ratios, measured during the anvil penetrations, are in a similar range as those measured at∼2 km altitude (see red box), supporting the assumption of rapid upward transport from the top of the BL into the anvils. Unfortunately, no NOx mea-surements are available below 3 km for this flight. Instead, NOx measurements in the BL were only available for ten TROCCINOX “fair weather” flights without active
thun-10
derstorms (Fig. 1a in HH07). NOx and CO data from all available flights in the BL (<2 km) were therefore used to estimate the average BL NOx-CO correlation. It can be justified that this relationship is representative, since CO mixing ratios in the BL were in the same range both for “thunderstorm” and for “fair weather” flights. The BL data were sampled mainly during take-off and landing near the campaign base. Hence, it was
15
assumed that these values are representative for the entire BL covered by the selected flights.
In Fig. 10b the correlation between measured NOx and CO for the Falcon flight of 18 February is shown (black dots). Different types of air mass origin (Pacific, Ama-zon basin, anvil and background), as discussed in HH07, are marked. The measured
20
NOx mixing ratios were mainly below 0.2 nmol mol −1
, except during the anvil penetra-tions. The average NOx-CO correlation in the BL for all TROCCINOX flights (data from Fig. 1 in HH07) is also shown in Fig. 10b (red-yellow dots). Average CO mixing ratios during the anvil penetrations of the 18 and 4 February flights were 95–105 and 105– 115 nmol mol−1, respectively. From the measured BL-CO (90–120 nmol mol−1) and the
25
correlation, the average BL-NOxmixing ratio and its standard deviation (std) were es-timated to be 0.11±0.07 nmol mol−1. For the anvil penetrations of 4 and 18 February listed in Table 2a, average LNOx volume mixing ratios (χLNOx) were determined by
sub-ACPD
7, 14813–14894, 2007 Lightning activity in Brazilian thunderstorms H. Huntrieser et al. Title Page Abstract Introduction Conclusions References Tables Figures ◭ ◮ ◭ ◮ Back Close Full Screen / EscPrinter-friendly Version Interactive Discussion
EGU
traction of the mean BL-NOx contribution (0.11 nmol mol−1) from the mean anvil-NOx values. The mean values for anvil-NOx range between 0.2–0.8 nmol mol−1 in the sub-tropical thunderstorm of 18 February and between 0.7–1.2 nmol mol−1 in the tropical thunderstorms of 4 February (Table 2a in HH07). As a result,χLNOxvalues in the range from 0.1 to 1.1 nmol mol−1 were obtained, as listed in Table 2a in the present paper.
5
Overall, the contribution of BL-NOx to anvil-NOx in the selected thunderstorms of 4 February (anvil 1a, 5a, and 2b) and 18 February (only anvil penetrations I, III and V closest to the core considered here) was∼10–20%. This range is slightly lower than the average found in European thunderstorms with 25 to 40% (Huntrieser et al., 1998, 2002). In the investigated TROCCINOX thunderstorms, the contribution from LNOx
10
clearly dominated the anvil-NOx budget with ∼80–90%. This contribution is higher than observed during the TRACE-A experiment at the end of the dry (burning) season, where only 30–40% of anvil-NOx was attributed to LNOx (Pickering et al., 1996). 4.4 Estimate of the horizontal LNOx mass flux
Cloud-model simulations indicate that most LNOx produced in a thunderstorm is
trans-15
ported into the anvil (Skamarock et al., 2003). If the total LNOx mass in the anvil region (dependent on the LNOx mixing ratio and the volume covered by this LNOx) and the total number of flashes in the thunderstorm that contributed to this LNOx were known, the LNOx production rate per flash could be estimated, assuming a constant LNOx production per flash. Up to now, however, no method exists which can determine
20
the required parameters exactly. Model approaches have e.g. estimated the horizontal NOx flux out of the anvil through a vertical control surface (Skamarock et al., 2003; Barthe et al., 2007). A combination of in situ aircraft observations and cloud-model simulations was used to separate the outflow flux into a LNOx flux and an environ-mental NOx flux. This approach was originally introduced by Chameides et al. (1987)
25
for airborne measurements in thunderstorms during GTE/CITE and has also been ap-plied by us for measurements in LINOX and EULINOX thunderstorms (Huntrieser et
ACPD
7, 14813–14894, 2007 Lightning activity in Brazilian thunderstorms H. Huntrieser et al. Title Page Abstract Introduction Conclusions References Tables Figures ◭ ◮ ◭ ◮ Back Close Full Screen / EscPrinter-friendly Version Interactive Discussion
EGU
al., 1998, 2002). Alternatively, the NO content in the thunderstorm is estimated from the product of airborne in situ measurements of NO at certain levels in the anvil and the estimated volume of the appropriate cloud segments (Ridley et al., 2004). The total volume is derived from the sum of the vertically staggered flight segments. The two methods are described in more detail in SH07.
5
The TROCCINOX thunderstorm penetrations listed in Table 2a provide only snap-shots of the conditions at a certain level of the cloud at a certain time. It is not known how representative these anvil penetrations are for the average anvil conditions (see also discussion in Sect. 3.2). These are, however, the only measurements that are available. Time series of trace gas measurements (NOx, CO, and O3) during the
pene-10
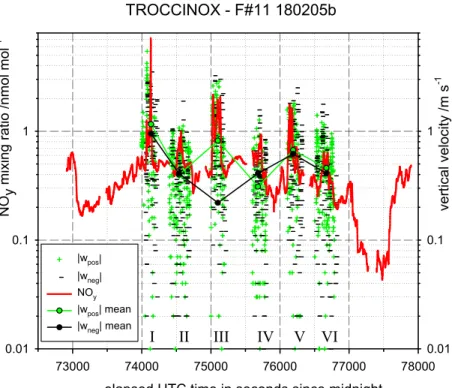
trations listed in Table 2a have already been presented and discussed in HH07. On the 18 February flight, the anvil outflow from the selected thunderstorm system was suc-cessfully penetrated 6 times (Fig. 4b). In addition to the mentioned trace gases, NOy was measured and mixing ratios during the 6 penetrations are shown together with the vertical velocity (absolute values) in Fig. 11. The 1 s absolute velocity values mainly
15
varied between 0.1 and 1.0 m s−1 indicating that the measurements were carried out outside the core region of the thunderstorm cell, where far higher vertical velocities are to be expected. The highest NOy mixing ratios were measured during the anvil penetrations with the strongest vertical velocities, which is closer to the core region (∼10–30 km) where most lightning occurs (penetration I, III and V). The closest
pene-20
tration to the maximum anvil outflow level was penetration III, where the mean updraft velocity (0.8 m s−1) was distinctly higher than the mean downdraft velocity (0.2 m s−1), and the highest mean NOy mixing ratio (1.1 nmol mol−1) was measured. About 30 km further downwind (penetration II, IV, VI), the measurements indicate that a large part of the outflow already mixed with the ambient air (similar mean updraft and downdraft
25
velocities).
Moreover, on 4 February the selected thunderstorms were penetrated only once, but rather close to the core. Hence, too few repeated anvil penetrations and limited radar reflectivity data are available to apply the method introduced by Ridley et al. (2004). We
ACPD
7, 14813–14894, 2007 Lightning activity in Brazilian thunderstorms H. Huntrieser et al. Title Page Abstract Introduction Conclusions References Tables Figures ◭ ◮ ◭ ◮ Back Close Full Screen / EscPrinter-friendly Version Interactive Discussion
EGU
therefore use a modified version of the method introduced by Chameides et al. (1987) and assume that the measurements during each anvil penetration (snapshots) are representative average anvil conditions. We consider the horizontal mass flux of LNOx through a vertical control surface. The vertical surface dimensions can be estimated from the combination of e.g. airborne measurements and FLEXPART simulations as
5
explained before in Sect. 4.2 and as indicated in Fig. 3. Repeated penetrations of the 18 February thunderstorm system indicated that ∆z was >1.3 km (10.7–9.4 km,
Table 2a). The entire vertical extent of the anvil outflow can be most clearly seen in vertical profiles of the CO mixing ratio measured by the high-flying Geophysica (per-sonal communication, P. Mazzinghi, INOA/CNR). On 18 February the most distinct
10
enhancement in the CO mixing ratio was observed between∼9–12 km altitudes and ∆z was set to∼3 km (see Table 2a). On 4 February the enhancement in CO was less clear owing to elevated background mixing ratios: enhanced mixing ratios were mainly observed between∼10–14 km altitudes and ∆z was set to ∼4 km (see Table 2a).
The horizontal LNOx mass fluxFLNOx(in nitrogen mass per time, g s−1) was
calcu-15
lated for each thunderstorm penetration listed in Table 2a according to:
FLNOx=χLNOx·
MN Mair
· ρa(Va− Vs)· ∆x · ∆z (4)
whereχLNOx is the mean NOx volume mixing ratio produced by lightning (mol mol −1
),
MN and Mair are the molar masses of nitrogen (14 g mole−1) and air (29 g mole−1), respectively,ρa is the air density (g m−3) calculated from measured temperature and 20
pressure in the anvil, andVa− Vsis the difference between the wind vectors in the anvil
outflow and at the steering level (see Table 2b). The last term ∆x·∆z is the area (m2) of the vertical cross-section perpendicular to the wind direction in the anvil outflow. In general, the wind at the steering level (∼700 hPa) determines the mean motion of a thunderstorm cell (Keenan and Carbone, 1992), but this parameter is not available
25
from the airborne measurements. Instead, horizontal LINET stroke distributions, as shown in Fig. 4, were plotted with a higher temporal resolution (10 min) and the storm
ACPD
7, 14813–14894, 2007 Lightning activity in Brazilian thunderstorms H. Huntrieser et al. Title Page Abstract Introduction Conclusions References Tables Figures ◭ ◮ ◭ ◮ Back Close Full Screen / EscPrinter-friendly Version Interactive Discussion
EGU
motion (Vs) was determined from the temporal stroke evolution. The parameters in Eq. 4, except ∆x (Sect. 4.2) and ∆z, were calculated directly from Falcon measure-ments by averaging the measured data over the time period when the thundercloud was penetrated (between entry and exit of anvil), see Table 2a.
FLNOx values were calculated for the selected thunderstorms by insertion of the pa-5
rameters listed in Table 2a into Eq. 4, which give nitrogen mass flux values between 48 and 178 g s−1 (Table 2a). The flux values for subtropical thunderstorms (only anvil I, II, and V considered) and tropical thunderstorms are within a similar range. The flux values in Table 2a can be divided by the molar mass for nitrogen and the area of the vertical cross-section (∆x·∆z) to estimate the flux in the unit mol m−2s−1. The range of
10
these fluxes, 3.3–7.1×10⁻⁸mol m−2 s−1, is well comparable to nitrogen mass flux val-ues simulated by Barth et al. (2007) who ran different cloud-scale models (range 2.7– 13.0×10⁻⁸mol m−2s−1) and to Barthe et al. (2007), who simulated 6×10⁻⁸mol m−2s−1 on average in the anvil outflow of a STERAO storm.
The parameters listed in Table 2a have large uncertainties. The relative maximal
15
error of the FLNOx estimate was therefore calculated. The uncertainty for χLNOx is given by the standard deviation (on average ∼50% of the mean value); for Va − Vs
the standard deviations listed in Table 2b indicate an uncertainty of up to∼50%; for ∆x the uncertainty was ∼5–10 km corresponding to ∼40%; and for ∆z the vertical anvil extension on 4 February varied between 3.5–6 km and on 18 February between
20
2–4 km indicating an uncertainty up to ∼50%. Summing up these uncertainties, the relative maximal error of theFLNOxestimate is∼190%.
4.5 Estimate of the LNOx production rate per stroke and per year
For the estimate of the LNOx production rate PLNOx (nitrogen mass per stroke, in g stroke−1), the horizontal LNOx mass fluxFLNOx(g s−1) is divided by the LINET stroke
ACPD
7, 14813–14894, 2007 Lightning activity in Brazilian thunderstorms H. Huntrieser et al. Title Page Abstract Introduction Conclusions References Tables Figures ◭ ◮ ◭ ◮ Back Close Full Screen / EscPrinter-friendly Version Interactive Discussion
EGU
rateRLINET (strokes s−1):
PLNOx=
FLNOx
RLINET
(5)
PLNOxestimates for the selected anvil penetrations resulted in values between 1.9 and 5.6 kg stroke−1, see Table 2a. Unfortunately, the dataset in Table 2a is very sparse. Nevertheless, meanPLNOxvalues for three tropical and one subtropical thunderstorms
5
(only anvil penetrations I, III and V considered) are estimated to 2.4 and 4.5 kg stroke−1, respectively, which corresponds to 4.8×1025 and 9.0×1025 molecules NO stroke−1. These results suggest that a subtropical thunderstorm may produce more LNOx per LINET stroke than a tropical thunderstorm (factor∼2). Possible reasons for this differ-ence will be discussed in Sects. 5 and 6.
10
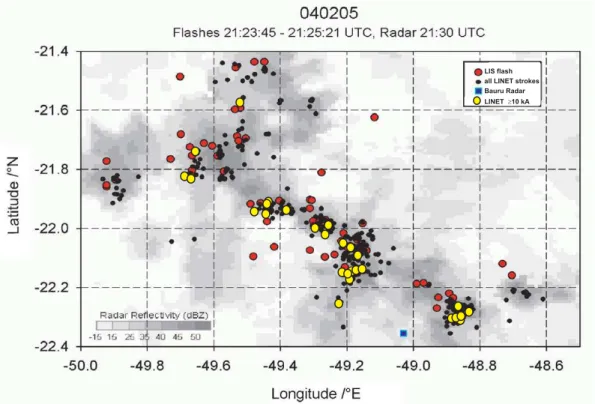
For comparison with other published results, thePLNOx estimates per LINET stroke were scaled to PLNOx estimates per LIS flash. During the TROCCINOX field period from 21 January to 27 February 2005, only one overpass of 4 February at 21:23:45– 21:25:21 UTC provided a sufficient large set of coincident LINET and LIS measure-ments. On this day, lightning activity in the LINET centre area (21.5–22.5◦S and 48.5–
15
49.5◦W) and close-by (covering totally 20.0–23.0◦S and 48.5–50.5◦W) was suitable for comparison. Overall 82 LIS flashes and 481 LINET strokes were registered in the studied area during the∼90 s measurement. LINET strokes with peak currents down to at least 4 kA (absolute value) were sensed by LIS. For the selected time period, Fig. 12 shows the horizontal distributions of all available LINET strokes (black dots) and LIS
20
flashes (red dots) for the area where most lightning occurred (21.4–22.4◦S and 48.5– 50.0◦W) together with radar reflectivity (grey). For the PLNOx estimate, only stronger LINET strokes with peak currents ≥10 kA are considered (in total 41 strokes, yellow dots) as mentioned before in Sect. 4.1. The LIS detection efficiency at night (0.93) was taken into account (21:23–21:25 UTC = 19:23–19:25 Brazilian Summer Time). This
25
implies a LINET/LIS ratio of about (41/82)×0.93=0.5, considering only LINET strokes with peak currents≥10 kA.
ACPD
7, 14813–14894, 2007 Lightning activity in Brazilian thunderstorms H. Huntrieser et al. Title Page Abstract Introduction Conclusions References Tables Figures ◭ ◮ ◭ ◮ Back Close Full Screen / EscPrinter-friendly Version Interactive Discussion
EGU
By means of this ratio, the mean values for PLNOx per LIS flash for tropical and subtropical thunderstorms (only anvil penetrations I, III, and V considered) are 1.2 and 2.2 (range 0.9–2.8) kg, respectively, corresponding to 2.4 and 4.5 (range 1.9– 5.6)×1025molecules NO. These estimates for TROCCINOX are well within the range of more recent estimates. From a review of previous investigations, SH07 derive a
5
best-estimate of 3.5 (range 0.5–10) kg of nitrogen per flash.
The estimates forPLNOxper LIS flash were multiplied with the number of LIS flashes occurring globally, 44 flashes s−1. If the selected tropical and subtropical TROCCINOX thunderstorms were representative for the globe, the implied mean annual global LNOx production rateGLNOxwould be∼1.6 and 3.1 Tg a
−1
, respectively (factor∼2 difference).
10
These values are close to previous best estimates for mid-latitude thunderstorms over Europe, 3–4 Tg a−1(Huntrieser et al., 1998, 2002). The individual estimates for the sin-gle thunderstorm penetrations listed in Table 2a, however, range from 1.3 to 3.9 Tg a−1, indicating a wide range of values and large uncertainties depending on where (horizon-tally and vertically) the anvil was penetrated.
15
Finally, the relative maximal errors of thePLNOxandGLNOxestimates (Table 2a) were calculated. The uncertainty for RLINET was estimated from the standard deviations of the time series of the LINET stroke rates (Fig. 5). The standard deviations var-ied between 50–90% of the mean values. From the estimates forFLNOx ∼190% and
RLINET ∼90%, the relative maximal error of the PLNOx estimate for LINET strokes was
20
∼280%. For the PLNOx estimate for LIS flashes, it was assumed that the uncertainty in the conversion of LINET strokes (≥10 kA) to LIS flashes was ∼30% (depending on which LIS detection efficiency was used: day or night). This gives a relative maximal error of ∼310%. For the GLNOx estimate, the uncertainty in the global LIS flash rate was given with∼10%, which gives a final relative maximal error of ∼320%. Given this
25
relative maximum error, the final range for theGLNOx values listed in Table 2a is be-tween 0.4 and 12 Tg a−1. This range is comparable to other ranges given forGLNOx in previous publications (see Sect. 1 and SH07).
ACPD
7, 14813–14894, 2007 Lightning activity in Brazilian thunderstorms H. Huntrieser et al. Title Page Abstract Introduction Conclusions References Tables Figures ◭ ◮ ◭ ◮ Back Close Full Screen / EscPrinter-friendly Version Interactive Discussion
EGU 5 Possible explanations for different LNOx production rates in tropical,
sub-tropical and mid-latitude thunderstorms
The results in the previous section lead us to hypothesise that tropical thunderstorms over Brazil may produce less LNOx per stroke than subtropical thunderstorms. In this section we investigate whether these differences in the LNOx production rate may be
5
related to differences in the stroke peak currents (Sect. 5.1), stroke lengths (Sect. 5.1) or stroke release heights (Sect. 5.2) (relationships investigated by Wang et al., 1998, in the laboratory). Furthermore, mean stroke peak currents observed by LINET are compared for several tropical and mid-latitude thunderstorms and for one subtropical thunderstorm (Sects. 5.3–5.4).
10
5.1 LNOx production rate as a function of stroke peak current
In this subsection we combine the result of laboratory measurements by Wang et al. (1998) with our field measurements to determine the LNOx production rate as a function of peak current. Wang et al. (1998) determined the NO production rate per unit laboratory spark, whereas our analysis provides the NO production rate per LINET
15
stroke in the field. We assume that both follow the same dependency on peak current as given by Wang et al. (1998). Hence, both differ only by a constant factor, which has the dimension of laboratory spark length per LINET stroke. This factor will be determined below.
The relationship between the peak current and NO produced per spark as found by
20
Wang et al. (1998) from measurements in the laboratory (at 1.01×10⁵Pa) is given by:
nNOlab(I) = a + b × I + c × I2 (6) wherenNOlab(I) is the NO production normalised to 1 m spark length (10
21
molecules NO m−1),a=0.14, b=0.026, and c=0.0025 and I is the peak current of the spark (kA).
The number of NO molecules can be converted to the mass of nitrogen according to:
25
ACPD
7, 14813–14894, 2007 Lightning activity in Brazilian thunderstorms H. Huntrieser et al. Title Page Abstract Introduction Conclusions References Tables Figures ◭ ◮ ◭ ◮ Back Close Full Screen / EscPrinter-friendly Version Interactive Discussion
EGU
whereMNOlab(I) is the nitrogen production per to 1 m spark length (10−3 g m−1) and
MW is a constant (molecular weight of N, unit g molecule−1). According to Eq. (7) a
laboratory spark with 10 kA would produce 0.015 g nitrogen m−1.
Furthermore, Eq. (7) was multiplied with a constant factorCLINET(m laboratory spark per LINET stroke) to convert the production per laboratory sparks and metre to the total
5
number of LINET strokes. Here we assume that all LINET strokes in one specific anvil have the same length, independent of peak current and flash component, since no further information is available from our dataset. The factorCLINETwas estimated from Eq. (8). Values from Table 3 for anvil 1a (lower half of table, here only strokes≥10 kA considered) were inserted in Eq. (8); the mean LNOx mass flux, FLNOx, (120 g s−1),
10
and the LINET stroke rate (strokes s−1),RLINET(I), for a given peak current I:
FLNOx=CLINET ∞ Z
I=10
RLINET(I) × MNOlab(I) d I (8)
whereRLINET(I) was estimated from Eq. (9):
RLINET(I) = 1 t t Z t=0 NLINET(I, t) d t (9)
andNLINET(I, t) is the number of LINET strokes for a given peak current and time.
15
The value of RLINET in Eq. (9), integrated over all peak currents (here ≥10 kA), is 0.055 strokes s−1 (Table 3 lower half, anvil 1a). The total integral in Eq. (8) (peak cur-rents from anvil 1a inserted) is estimated to 2.71×10⁻³ strokes s−1g m−1laboratory spark. The corresponding LINET factor, CLINET, was estimated to 44.4×10
3
(=120/(2.71×10−3)) m laboratory spark stroke−1 (see Table 3). We expect a LINET
20
stroke in the atmosphere to be shorter than this calculated length (44 km), but probably broader than a laboratory spark. One metre LINET stroke is therefore probably more efficient in producing LNOx than a laboratory spark.
ACPD
7, 14813–14894, 2007 Lightning activity in Brazilian thunderstorms H. Huntrieser et al. Title Page Abstract Introduction Conclusions References Tables Figures ◭ ◮ ◭ ◮ Back Close Full Screen / EscPrinter-friendly Version Interactive Discussion
EGU
Applied to LINET strokes, Eq. (7) changes to:
MNOlinet(I) = CLINET× MNOlab(I) (10)
where MNOlinet(I) is the nitrogen mass production per LINET stroke (g stroke−1). A LINET stroke with a peak current of 10 kA (anvil 1a) would produce 0.7 kg nitrogen according to Eq. (10). This value is rather large because peak currents<10 kA were
5
neglected (Table 3, lower half) and the total LNOx mass was distributed only over strokes≥10 kA in Eq. (8).
The same calculations were performed for other selected thunderstorm penetrations of 4 and 18 February 2005, as shown in Figs. 13a–d and as listed in Table 3. In Table 3 every thunderstorm penetration is listed twice. For the first calculation (upper half in
10
the table) all registered strokes were considered (peak currents down to 2 and 6 kA, depending on the detection efficiency in that area). For a comparison between the 4 and 18 February selected penetrations, however, only strokes with peak currents ≥10 kA were considered, as listed in the lower half of the table.
In Figs. 13a–d the frequency distributions of LINET strokes (grey bars) per 1 kA peak
15
current interval are shown for the selected thunderstorms of 4 and 18 February 2005. The stroke frequency rapidly decreases with increasing peak current. Superimposed are the laboratory results by Wang et al. (1998) concerning the NO dependency on peak current modified for LINET strokes (blue dashed line) according to Table 3 (differ-entCLINET values considered), and in addition the estimated total amount of nitrogen
20
mass produced per 1 kA LINET stroke interval for the selected thunderstorm systems (red line). The total mass estimates are listed in Table 3.
In Fig. 13e–f the same type of calculations were performed for datasets with a larger number of LINET strokes to point out more clearly the differences between the stroke peak current frequency distributions of 4 and 18 February. All strokes (≥10 kA) in
25
the LINET centre area on 4 February between 00:00 and 24:00 UTC were consid-ered in Fig. 13e. In Fig. 13f the same calculations were performed for the selected thunderstorm system of 18 February for all strokes (≥10 kA) between 14:00 UTC and