HAL Id: insu-01649835
https://hal-insu.archives-ouvertes.fr/insu-01649835
Submitted on 27 Nov 2017
HAL is a multi-disciplinary open access
archive for the deposit and dissemination of
sci-entific research documents, whether they are
pub-lished or not. The documents may come from
teaching and research institutions in France or
abroad, or from public or private research centers.
L’archive ouverte pluridisciplinaire HAL, est
destinée au dépôt et à la diffusion de documents
scientifiques de niveau recherche, publiés ou non,
émanant des établissements d’enseignement et de
recherche français ou étrangers, des laboratoires
publics ou privés.
Monitoring solar activity on the far side of the Sun from
sky reflected Lyman α radiation
Jean-Loup Bertaux, Eric Quémerais, Rosine Lallement, Elisabeth Lamassoure,
Walter Schmidt, Erkki Kyrölä
To cite this version:
Jean-Loup Bertaux, Eric Quémerais, Rosine Lallement, Elisabeth Lamassoure, Walter Schmidt, et al..
Monitoring solar activity on the far side of the Sun from sky reflected Lyman α radiation. Geophysical
Research Letters, American Geophysical Union, 2000, 27 (9), pp.1331-1334. �10.1029/1999GL003722�.
�insu-01649835�
GEOPHYSICAL RESEARCH LETTERS, VOL. 27, NO. 9, PAGES 1331-1334, MAY 1, 2000
Monitoring solar activity on the far side of the Sun from
sky reflected Lyman
radiation
Jean-Loup
Bertaux, Eric Quemerais,
Rosine Lallement, and Elisabeth
Lamassoure
Service d'A6ronomie du CNRS, BP. 3, 91371 Verfi•res-le-Buisson, France
Walter Schmidt and Erkki Kyr61•i
Finnish Meteorological Institute, P.O. Box 503, F100101 - Helsinki, Finland
Abstract. Solar active regions are known to be brighter in Lyman (• radiation than the quiet sun. Accordingly, they illu- minate more H atoms in interplanetary space through reso- nance scattering. As we show here, this excess of illumination related to active regions is clearly seen in full-sky Lyman a maps recorded by the SWAN instrument on board SOHO, in- cluding those excesses resulting from active regions which are on the far side of the Sun. Since solar activity is most often connected to solar active regions, this technique could be used in the future to improve the quality of Space Weather forecast , by earlier detection of the birth of a new active region on the
far side of the sun, before it comes into Earth's view at the East
limb.
Introduction
Solar activity impacts the Earth's environment through a va- riety of mechanisms, and it affects occasionally orbiting spa-
cecraft. Efforts are conducted in order to forecast, from solar
observations, what could be the impact with a few days ad- vance notice (so-called Space Weather discipline). In addition to CMEs, solar activity is often related to the presence on the surface of the Sun of an active region, which appears rather suddenly and may last for several months. It increases the solar UV and EUV irradiance, which heats the upper atmosphere, both on the 11 year solar cycle and the 27 days (solar rotation) time scales. The resulting atmospheric inflation brings higher densities at a given altitude, increasing the atmospheric drag on orbiting spacecraft and debris. Their orbital parameters are modified, and the short term solar variability effect is a concern in (at least) two areas. High resolution imaging of the ground from space requires an accurate knowledge of the spacecraft position in order to orient the camera in the right direction. The International Space Station, very sensitive to atmospheric drag, must be maneuve- red to avoid collisions with other spacecraft and space debris, which orbit must be precisely known to predict potentially dangerous encounters [Lean, 1997].
in the solar UV spectrum (110-400 nm), Lyman a (La) radia- tion at 121.6 nm shows the largest variability, at the 100-120 % level [Floyd et a/.,1998]. At 121.6 nm the L(• radiation is in
Copyright 2000 by the American Geophysical Union. Paper number 1999GL003722.
0094-8276/00/2 000GL003722505.00
the far UV; it is absorbed by the atmosphere and can be ob- served only from space. It could be noted however that N 2 is
transparent, and 02 has a narrow window (0.2 nm) of increased transparency ( a factor of 100) at La. Therefore it penetrates more deeply in the atmosphere (down to 60-70 km). Associa-
ted with the fact that it is the most variable solar feature in the
solar Far UV, it indicates the importance of this variability for aeronomical processes. In the present article, we discuss the
possibility to monitor from space the changes of the solar L(x
output from the far side of the sun, which could result in a bet-
ter forecast system of solar UV/EUV irradiance and atmosphe-
ric effect.
The Sun is a strong source of La radiation at 121.6 nm, the re-
sonance line of the H atom corresponding to the 1S-2P transi- tion. Therefore, all H atoms in the solar system which are il-
luminated by the Sun are secondary sources of La radiation and
can be observed from space. H atoms are found in the upper
part of planetary atmospheres, in the extended coma of comets
[Bertaux et a1.,1973], and in the interplanetary medium [Bertaux and Blamont, 1971; Thomas and Krassa,1971], all three places where they have been observed in La by a number
of space instruments since the beginning of space era. The H atoms of interplanetary space are in fact belonging to the in-
terstellar cloud through which the Sun is flowing at the present time [Lallement and Bertin, 1992] at a velocity of 26 krn/s, in
a direction near the ecliptic plane [Quemerais et al., 1999]. The H density in the solar system is not uniform; ionization by the
solar wind and solar EUV creates near the sun a cavity
practically void of H atoms. This cavity is elongated in the
downwind direction, and its smallest size, found in the upwind direction, is about the size of the Earth's orbit around the Sun (! Astronomical Unit, A.U.).It extends to 5-10 AU in the
opposite, downwind direction (see figure 1).
if the sun's surface were constantly and uniformly bright in
L(•, changes in backscattered L(• would occur only when the H atom density distribution is changing where it is observed.
This is not the case: the solar L(x output is changing both on
!l year solar cycle and on the 27 days time scale, as documen- ted by a number of space monitoring instruments [Vidal-Mad- jar et al., 1973; Floyd et a/.,1998; Woods and Rottman,1997].
This latter modulation is obviously related to the solar rota-
tion, and the presence on the surface of brighter regions. It is well known that plages and solar active regions are brighter in the Far UV, and specially in L(• [Fontenla et al., 1998]. There-
fore,
one
single
active
region
on the solar
suiface
will act as a
rotating search light, which spot can be seen on the interpla- netary H atoms acting as a giant screen (figure 1). In reality,
1332 BERTAUX ET AL.: SOLAR ACTIVITY ON THE FAR SIDE OF THE SUN
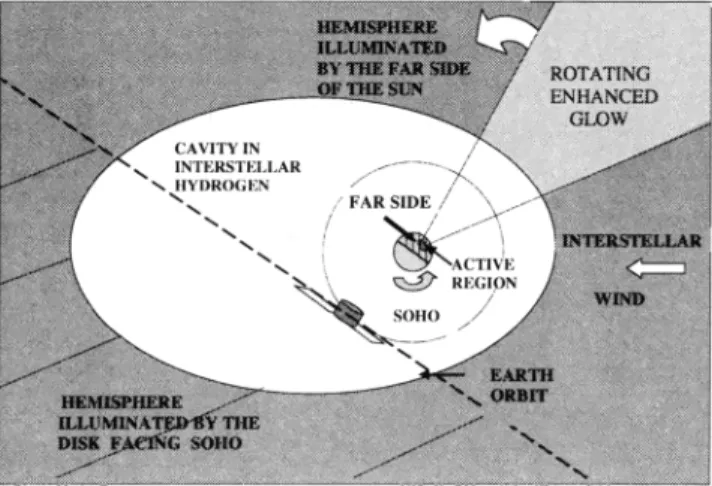
Figure 1. Geometry of observations. The sun illuminates in L o• the H atoms (of interstellar origin) in the solar system. An active region on the solar surface which emits more L o• will
illuminate more the H atoms which are in view of this active
region. This increased illumination (a few percent) of the sky L o• background may be detected by SWAN on board SOHO spacecraft, even if the active region is on the far side of the Sun: the H cloud in the solar system acts as a screen on which the rotating beam from the active region is projected. Ionization by the solar wind creates a cavity void of H atoms which encompasses the SOHO and Earth orbits. A diagonal dashed line separates the two sky hemispheres , illuminated respectively by the far side and the front side of the sun.
the extra beam of light is not strongly collimated as suggested by the sketch of figure 1, but illuminates in 2 x steradian, most likely with a Lambert's law. In the following, we report 1996
observations of such features from SWAN/SOHO.
Full Sky Lyman •z Observations
The SOHO spacecraft is poised at Lagrange point L1 , about
1.5
106
km
from
Earth
on
the
sun.
The
primary
objective
of
SWAN instrument [Bertaux et a/.,1997] on board SOHO is to
determine the latitude distribution of the solar wind from the
detailed shape of the sky Lo• intensity pattern. For this pur- pose, the mechanisms of SWAN periscopes are activated 2 or 3 times per week to collect a full-sky map (duration of data col- lection 24 hr per map). We have analyzed a series of such maps in order to detect the "footprint" of solar active regions on the sky.
On figure 2, the intensity recorded in a fixed celestial direction is plotted as a function of time over 370 days. In principle, there are 3 possible reasons for time variations. The changes of H distribution ( due to changes in the solar wind) are slow and are neglected here. The changing location of SOHO in the solar system is the major factor, giving the large sinusoidal trend with a I year period. This is because the L o• source glow in the solar system is non-evenly distributed, with a large maximum at 2 A.U. from the sun in the upwind direction. Therefore, the detailed sky pattern depends on the particular position of SOHO along the Earth orbit (parallax effect), and
gives an annual pattern of the time variation of the intensity
in all directions. The third factor is the non-isotropic solar Lc• illumination and 27 days rotation period, which is responsible
for the small wiggles around the mean curve of Figure 2. This mean curve was obtained by a sliding a,•erage of the individual points over 50 days (twice the solar rotation in inertial space).
Then, the mean curve is subtracted from the data points and the result of subtraction divided by the mean for normalization to
100 %. Doing so, the parallax effect is eliminated. Also, the
characteristic shape of a map is eliminated, since all the new
values obtained for all celestial directions are within 0-10% of
unity.
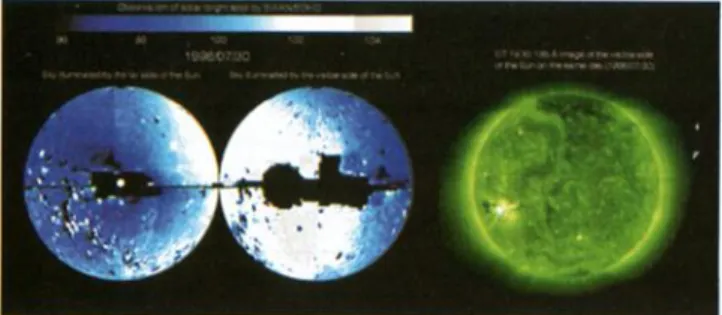
New maps of these normalized intensities can be constructed
from each original full sky maps recorded by SWAN, to obtain normalized maps. If the sun were an isotropic source of L• , these maps would be uniform at value 100. One typical exam- ple of a normalized map is shown on figure 3 (obtained from full sky map of July 30, 1996). The sky was divided in two hemispheres separated by the plane containing SOHO, perpen-
dicular to SOHO/sun line. The circle plotted on the right repre- sents the hemisphere opposite to the direction of the sun as seen from SOHO. Therefore, it is illuminated by the side of the
sun which is facing SOHO, seen from SOHO. The left circle re-
presents the hemisphere centered on the sun as seen from SOHO, and is therefore illuminated by the far side of the sun.
Except for small bright or dark spots which are due to stars, the
most conspicuous feature of this map is the presence of a large brighter area centered on the left half of the right hand circle,
extending somewhat on the right side of the left circle. We as-
sign this extended brighter area in the sky to the presence of a single active area on the surface of the sun, as shown by the
sun EIT image in extreme UV taken on the same day, displayed on the side of figure 3. The active region is slightly south and
on the east side 'of the sun, which comes into view during the
solar rotation.
On figure 4 are represented in a similar fashion the SWAN and
EIT data for July, 20, 1996, that is to say 10 days before figure 3 data. We note the complete absence of an active region on
EIT image, and correspondingly there is no brighter area in
the SWAN normalized map on the right, which is illuminated
by the sun as viewed from SOHO. However, the SWAN norma-
200 - '
120
DAYS AFTER JAN 1, 1995
lOO , , , , , , , , , ! ... i ... ! ... .500 800 700 800
SKY INTENSITY AND RUNNING AVERAGE ... i ... i ... • ...
Figure 2. Time variation of the Lo• intensity recorded by SWAN in a given direction in the sky (ecliptic longitude and latitude: 320 ø and -60 ø ) over 380 days in 1996 and 1997 (solid line). The intensity is in counts /s per 1 ø pixel. Day 1 is 1st January 1995. The dashed curve is the running average of the data points in a window of 50 days centered on each point. Small wiggles around the running average curve are due to ac- tive regions rotating with the sun, emitting more solar Lc• and illuminating more the sky in the given direction of sky.
BERTAUX ET AL.' SOLAR ACTIVITY ON THE FAR SIDE OF THE SUN 1333
Figure 3. This is a comparison of EIT images of the solar disc in EUV wavelength and SWAN normalized images of the
sky in Let taken on july 30, 1996. The full sky images of
SWAN are divided in two hemispheres : on the right, it is the anti-solar hemisphere, the one which is illuminated by the sun
as viewed from EIT and also seen from Earth. On the left, it is
the hemisphere which surrounds the sun (fiducial white circle at center), and therefore a part of the sky which is illuminated by the far side of the Sun. A bright active region is cons- picuous on EIT image, and correspondingly there is a brighter wide area in the SWAN image on the right , which is illumina- ted by the sun as viewed from EIT. The small dark spot at the !eft of the bright spot in E1T is an artefact. Regions with no SWAN data are black. Small bright or dark spots are artefacts due to stars. The scale of SWAN normalized images is in per- cent of the running average over 50 days. Longitude coordina- tes on SWAN maps are reversed w.r.t. the actual sky, for a bet- ter understanding of the match to EIT images.
lixed map shows a large brighter area on the left circle, repre- senting the hemisphere illuminated by the far side of the sun.
Obviously, this brighter area is the result of extra-illumination
from the same active region seen with EIT on July 30, but which was 10 days before on the far side of the sun and came into view at the east limb only a tEw days later (actually, this
specific active region was born on July 4, 1996, when it was
in view from the Earth).
We have also constructed movies from a succession of norma-
lized maps, on which can be lollowed easily the rotation of large brighter areas corresponding to solar active regions and
the rotation of the sun. Active regions can therefore be easily seen in reflected Lo•, even when they are on the far side of the
s u !1.
Improving Space Weather Forecast with Sky Let
mapping.
in the past, latitude distribution of solar Let illumination has
been considered [Cook eta!., 1981; Pryor et al., 1992; Pryor et al., 1996], averaging out the 27 days modulation. But here we are interested in the detailed longitude distribution at all times. We have shown that full-sky Let mapping provides a way to
detect the appearance of an active region on the far side of the
sun, before it comes in view at the East limb. This method
might be used in the future to improve the prediction of the
impact of solar activity on the Earth atmosphere and satellite systems (so-called Space Weather). This adds a new tool for Space Weather forecast, in which the solar activity is monito-
red in order to better predict (short term) what could be the im-
pact on Earth and orbiting spacecraft of an increase of solar ac-
tivity, in particular the heating of the atmosphere and the in-
creased orbital drag. It is worth noting that it was suggested in
the past to use the solar corona itself as a screen for the detec-
tion of solar features on the far side of the sun [Beckers and
Argo, 1983]. However, the coronal H experiences fast and strong variations, that would complicate the retrieval of the
solar surface source. The interplanetary distribution of H is much more stable, and provides therefore a more suitable
screen.
The ultimate goal is to determine the distribution of Let emis- sion as a tracer of active regions on the sun, even on the far side, from full-sky maps. The detailed chain of algorithm re- mains to be set up. In the present work we used a model-inde-
pendent method to retrieve the mapping of increased solar il-
lumination, by analyzing directly the data. For an operation- nal system of Space Weather forecast though, the 50 days win- dow centered on the day of the observation could not be used.
But a 50 days window ending at the day of the current observa-
tion should give also reasonable results for the production of a normalized map, which is an image of the distribution of acti- vity over the whole solar surface .This image is the convolu- tion of the solar surface pattern by the integration over the whole solar disc as seen by each point of the sky.
Alternately, a complete tbrward modelling of the sky Let brightness distribution may be used in a loop for data inver- sion. Starting from a given distribution of Let emission on the surface of the sun, one computes: 1. the solar Lc• flux experien- ced by all points in the solar system (convolution on the solar disc as seen from each direction), and the primary source func-
tion. 2. the final source function ( due to radiative transfer of
Lo• photons in the solar system: this is particularly important for downwind regions). One has to assume a given H distribu- tion in the solar system.3. the Let intensity as seen from SOHO. Then the computed map is compared to the observed
map, and adjustments are made to the solar surface Let distribu-
lion For a better match.
!1' this exercise had to be done separately and independently
for each daily recorded map, it would be difficult to disentangle
Ihe L o• distribution on the solar disc from the distribution of H
Figure 4. Same type of data as for figure 3, obtained ten
days before, on july 20, 1996. There is no bright spot on EIT image, and correspondingly there is no brighter area in the SWAN image on the right, which is illuminated by the sun as viewed from EIT. But in the SWAN image on the left side, which corresponds to the sky illuminated by the far side of the sun, there is a wide area which is brighter: it reveals the pre- sence of a bright spot on the far side of the sun This is the same bright spot that will come into view from EIT a few days later (figure 3).
1334 BERTAUX ET AL.: SOLAR ACTIVITY ON THE FAR SIDE OF THE SUN
density in the solar system. In fact, some attempts of forward modelling made in the course of this study failed to reproduce perfectly the sky maps. Systematic departures were found at 5- i0 % level, uncorrelated with solar active regions, but rather pointing to small deficiencies of the H model distribution. But analyzing a series of daily maps would be easier. From one map to the next, the La intensity change ( in each celestial direction) is the sum of three effects: -the geometrical paral- lax effect; -the solar rotation of a fixed pattern distribution of solar surface L a emission, both effects that are easy to com- pute with the forward model; and the changes in the non-iso- tropic solar illumination pattern. The changes of H in the so- lar system may be neglected because of their longer time scale. New bright areas could be identified, and located rather preci- sely on the surface of the sun, even on the far side. In this pro- cess, the data assimilation techniques that have been develo- ped for meteorological weather forecast could be of great help. Data assimilation is a standard technique used in weather fore- cast: the meteorological field analyzed for the present time is extrapolated into the future with a numerical model expressing the laws of physics; then, new measurements are mixed with the predictions of the model for an update of the metorological field (sequential assimilation). In our case, the laws of physics to be considered are mainly the rotation of the sun and the
transport of La radiation from the surface of the sun to the sky
mapper. In conclusion, it could be remarked that this
assimilation exercise would also benefit from the direct
observation of solar activity on the near side of the sun.
Acknowledgements. SOHO (Solar and Heliospheric Observatory) is a mission of international cooperation between ESA and NASA. The construction of the SWAN space instrument was financed by CNES and TEKES. We wish to acknowledge the support of Jean-Yves Prado at CNES for this particular study on Space Weather. We also wish to thank the ESA staff at GSFC for operations, and also Eliane Larduinat, Kim Tolbert and Laura Allen at the Flight Operation Team for their full dedi- cation to the operation of the SOHO instruments. Finally, we wish also to thank Cyril Pennanech and Asko Lehto for data and command mana- gement., and Jean-Pierre Delaboudini•re for providing the EIT images.
References
Bertaux, J.L., et al., First Results from SWAN Lyman ot Solar Wind Mapper on SOHO, Solar Physics, 175, 737-770 (1997)
Bertaux, J.L. and.Blamont, J.E., Evidence for an extra-terrestrial Ly- man ot emission: the Interstellar Wind, J.E, Astron. Astrophys., 11,
200-217 (1971)
Bertaux,J.L., Blamont, J.E., Festou, M., Interpretation of Hydrogen Ly- man ot observations of comets Bennett and Encke, Astron. Astrophys.,
25,415-430 (1973).
Cook, J.W.,. Meier, R.R, Brueckner, G.E., and VanHoosier , M.E., La-
titudinal Anisotropy of the Solar Far Ultraviolet Flux: Effect on the Lot Background Astron. Astrophys., 97, 394 (1981)
Floyd, L.E.,.et al., Solar Cycle 22 UV spectral irradiance variability: current measurements by SUSIM UARS, Solar Physics 177, 79-87
(1998)
Fontenla, J., Reichmann, E.J., and Tandberg-Hanssen, E., The Lyman- Alpha line in various solar features. I. Observations, Astrophys.
Journal, 329,464 (1988).
Lallement, R. and Bertin, P., Northern Hemisphere observations of the
LISM: Possible detection of the Local Interstellar Cloud, Astron. As-
trophys., 266, 479 (1992)
Lean J, The Sun's variable radiation and its relevance for Earth, Annu.
Rev. Astron. Astrophys. 35, p.33 (1997)
Pryor, W.R., et al., The Galileo and Pioneer Venus ultraviolet spec- trometer experiments : solar Lyman ot latitude variation at solar maximum from interplanetary Lyman-a observations, Astrophys. J.,
394, 363, (1992)
Pryor, W.R., et al., Latitude variations in interplanetary Lyman-ot data from the Galileo EUVS modeled with solar He 1083 nm images. Geophys. Res. Letters 23 (15), 1893, (1996)
Quemerais, E., et al, Interplanetary Lyman ot Line profiles derived from SWAN/SOHO H Cell measurements 1. The Full Sky Velocity Field, J. Geophys. Res.,104, 12585-12603 (1999).
Thomas, G.E.and Krassa, T., Ogo-5 measurements of the Lyman ot sky background, Astron. Astrophys., 11,218 (1971)
Vida!-Madjar, A., Blamont, J.E. and Phissamay, B., Solar
Lyman ot changes and related hydrogen densitiy distribution of the Earth's exobase (1969-1970), J. Geophys. Res., 77,115 (1973) Woods, T.N. and. Rottman, G.J, Solar Lyman ot iradiance measurements
during two solar cycles, J. Geophys. Res. 102, p.8769, (1997)
J.L. Bertaux, E. Quemerais, R.Lallement (e-mail: ber- taux@aerov.jussieu.fr, quemerais@ aerov.jussieu.fr, lallement@ aerov.jussieu.fr)
W.Schmidt, E. Kyr61fi (e-mail: walter.schmidt@fmi.fi, erkki.kyrola
@fmi.fi)
Beckers, J. M. and. Argo, H.V, A Solar Lyman Alpha Coronograph,