HAL Id: hal-00112693
https://hal.archives-ouvertes.fr/hal-00112693
Submitted on 31 Jan 2020
HAL is a multi-disciplinary open access
archive for the deposit and dissemination of
sci-entific research documents, whether they are
pub-lished or not. The documents may come from
teaching and research institutions in France or
abroad, or from public or private research centers.
L’archive ouverte pluridisciplinaire HAL, est
destinée au dépôt et à la diffusion de documents
scientifiques de niveau recherche, publiés ou non,
émanant des établissements d’enseignement et de
recherche français ou étrangers, des laboratoires
publics ou privés.
4-D comparison method to study the NOy partitioning
in summer polar stratosphere - Influence of aerosol
burden.
G. Dufour, Sébastien Payen, Franck Lefèvre, M. Eremenko, A. Butz, P.
Jeseck, Y. Té, K. Pfeilsticker, C. Camy-Peyret
To cite this version:
G. Dufour, Sébastien Payen, Franck Lefèvre, M. Eremenko, A. Butz, et al.. 4-D comparison method to
study the NOy partitioning in summer polar stratosphere - Influence of aerosol burden.. Atmospheric
Chemistry and Physics, European Geosciences Union, 2005, 5, pp.919-926. �10.5194/acp-5-919-2005�.
�hal-00112693�
SRef-ID: 1680-7324/acp/2005-5-919 European Geosciences Union
Chemistry
and Physics
4-D comparison method to study the NO
y
partitioning in summer
polar stratosphere – Influence of aerosol burden
G. Dufour1, S. Payan1, F. Lef`evre2, M. Eremenko1, A. Butz3, P. Jeseck1, Y. T´e1, K. Pfeilsticker3, and C. Camy-Peyret1
1Laboratoire de Physique Mol´eculaire et Applications, Universit´e P. et M. Curie, Paris, France 2Service d’A´eronomie, Institut Pierre-Simon Laplace, Paris, France
3Institut f¨ur Umweltphysik, University of Heidelberg, Germany
Received: 12 May 2004 – Published in Atmos. Chem. Phys. Discuss.: 10 December 2004 Revised: 23 February 2005 – Accepted: 9 March 2005 – Published: 21 March 2005
Abstract. On 21–22 August 2001, NO, NO2 and HNO3 mixing ratio profiles were measured at high latitudes during sunset and sunrise using the Limb Profile Monitor of the At-mosphere (LPMA) and the DOAS experiments under strato-spheric balloon. Photochemical simulations using the chem-istry module of the Reprobus Chemchem-istry Transport Model (CTM) that are constrained by ozone and total NOyballoon observations reproduce well the partitioning of NOxand NOy when model results are calculated at the exact time and loca-tion of the measurement for each tangent altitude. Taking the recently recommended reaction rate coefficients for the NOypartitioning (JPL-2003) and using realistic aerosol sur-face area in order to initialise the model leads to an agreement between calculations and measurements better than 10% all over the covered altitude range.
1 Introduction
Stratospheric ozone loss results mainly from catalytic cy-cles involving reactive nitrogen (NOx), hydrogen (HOx)and halogens (ClOxand BrOx)species. In the lower stratosphere, the nitrogen radicals (NOx=NO+NO2)play an important role by catalytically removing ozone and by moderating indi-rectly ozone loss through the coupling between the different radical families (Wennberg et al., 1994) and the formation of reservoir molecules. Many studies on nitrogen species, in particular addressing the polar winter stratosphere (Lary et al., 1997; Wetzel et al., 1997), demonstrated that for NOy the differences between model and measurement values are often larger than several ten percents. In particular the NO2 volume mixing ratio, the NO2/HNO3ratio and the NOx/NOy (NOy=NOx+ NO3+ HNO3+ 2×N2O5+ HNO2+ HNO4+ ClONO2 + BrONO2)ratio are found to largely disagree in
Correspondence to: G. Dufour
the lower stratosphere below 30 km. In order to improve the photochemical models, a better understanding of the parti-tioning of NOxand NOyis thus needed. The NO/NO2ratio is controlled by fast photochemistry which inter-converts NO and NO2, mainly through Reactions (R1) and (R2):
NO2+hν → NO + O (R1)
NO + O3→NO2+O2 (R2)
The partitioning between NO2and HNO3, and consequently between NOx and NOy, is dominated by slower reactions. In the lower stratosphere, the dominant sink of NOx is a two-step process involving the formation of N2O5during the night, followed by the heterogeneous hydrolysis of N2O5on sulphate aerosols, which converts N2O5 to the more stable species HNO3. In summer at high latitudes, the extended daylight duration is implying efficient photolysis which in-hibits the formation of the precursor molecule NO3and thus of N2O5. In effect, these conditions provide an opportunity to test our understanding of the NOypartitioning when gas-phase chemistry dominates the exchange between NOxand HNO3. Reactions (R3–R5) are the 3 main reactions that gov-ern the NO2/HNO3ratio:
HNO3+hν → NO2+OH (R3)
HNO3+OH → NO3+H2O (R4)
NO2+OH + M → HNO3+M (R5)
Several field studies performed during the 1997 Photochem-istry of Ozone Loss in the Arctic Region In Summer (PO-LARIS) mission investigated the partitioning of NOyspecies (Osterman et al., 1999; Gao et al., 1999; Perkins et al., 2001). These studies showed that a significant disagreement between observed and modelled NOy is observed when us-ing the reaction rates recommended by DeMore et al. (1997).
920 G. Dufour et al.: Modelling of NOypartitioning
Table 1. Time, latitude and longitude of LPMA sunset
measure-ments for selected tangent altitudes Ht.
Time (UT) Latitude Longitude Ht(km)
18:45 68.07 21.01 38.68 18:50 68.32 20.21 38.29 18:55 68.59 19.44 37.69 19:00 68.86 18.71 36.77 19:05 69.14 18.01 35.51 19:10 69.43 17.34 33.96 19:15 69.73 16.71 32.25 19:20 70.03 16.12 30.34 19:25 70.33 15.57 28.10 19:30 70.61 15.13 26.11 19:35 70.91 14.70 23.79 19:40 71.20 14.38 21.60 19:45 71.48 14.11 19.30 19:50 71.75 13.91 17.16 19:55 72.04 13.70 14.75 19:59 72.26 13.58 13.06
In particular, Osterman et al. (1999) recommended a reduc-tion in the rate coefficient of Reacreduc-tion (R5) by about 35% to achieve a reasonable agreement (better than 10% for al-titudes higher than 15 km and than 30% at lower alal-titudes) between the modelled and the measured NOx/NOy ratio in lower stratosphere. In fact laboratory studies then under-taken by Brown et al. (1999a, b) showed that k4is 20–30% slower than the value recommended by DeMore et al. (1997), whereas k5 is up to 50% faster. Using these updated rate coefficients Gao et al. (1999) found a significant improve-ment between modelled and observed NOx/NOy ratios for the analysed ER-2 flight.
In the present study, the partitioning of NOy species is studied using balloon-borne LPMA measurements (Camy-Peyret, 1995) which were performed at high latitude summer and the most recently recommended reaction rates for atmo-spheric studies (Sander et al., 2002). A robust initialisation scheme is used to inter-compare observed and simulated pro-files of NO, NO2and HNO3for sunrise and sunset. We fo-cus on the ability of the photochemical model to reproduce the observed NO/NO2and NOx/NOyratios, taking into ac-count different methods of initialisation of chemical species and stratospheric aerosol load.
2 LPMA observations
The balloon flight reported here took place from Kiruna (Sweden) on 21–22 August 2001. The measurements were performed during three flight phases: balloon ascent from 15:55 UT to 18:42 UT, sunset from 18:43 UT to 20:05 UT and sunrise from 1:11 UT to 2:29 UT. Infrared spectra have
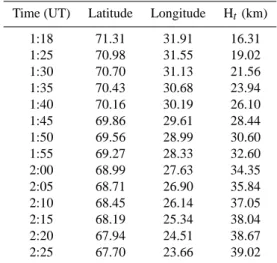
Table 2. Time, latitude and longitude of LPMA sunrise
measure-ments for selected tangent altitudes Ht.
Time (UT) Latitude Longitude Ht (km)
1:18 71.31 31.91 16.31 1:25 70.98 31.55 19.02 1:30 70.70 31.13 21.56 1:35 70.43 30.68 23.94 1:40 70.16 30.19 26.10 1:45 69.86 29.61 28.44 1:50 69.56 28.99 30.60 1:55 69.27 28.33 32.60 2:00 68.99 27.63 34.35 2:05 68.71 26.90 35.84 2:10 68.45 26.14 37.05 2:15 68.19 25.34 38.04 2:20 67.94 24.51 38.67 2:25 67.70 23.66 39.02
been recorded by the LPMA instrument, which is a remote sensing infrared Fourier transform interferometer operating in solar occultation (Camy-Peyret, 1995). The high spectral resolution and sensitivity of the LPMA instrument permits to retrieve vertical profiles of species with stratospheric mixing ratios of the order of a few tenths of ppbv, such as ClONO2. On the same gondola, a UV-visible DOAS (Differential Op-tical Absorption Spectroscopy) instrument (Ferlemann et al., 2000) analysed the same sun light for O3and NO2profiles. Both instruments LPMA and DOAS use the same suntracker to lock onto the sun. Thus, their line of sight (LOS) is identi-cal and the retrieved vertiidenti-cal profiles are directly comparable. The consistency of O3and NO2retrieved vertical profiles has been studied in detail (Butz et al., 20051). The LPMA instru-ment tracked the sun between 10 km up to the float altitude during balloon ascent and until loss of Sun, with a lowest tan-gent altitude of 12 km, during sunset. Spectra were recorded at sunrise from a tangent altitude of 15 km up to the float al-titude of 39 km. Profiles at sunset were retrieved down to 12 km. Tables 1 and 2 summarize the time (UT), the loca-tion and the altitude of the tangent points considered in the present study at sunset and sunrise, respectively.
The spectral retrieval of the target species relies on a mul-tifit algorithm that uses an efficient minimization algorithm based on the Levenberg-Marquardt algorithm (Press et al., 1992). It allows the simultaneous detection and retrieval of vertical profiles of CH4, N2O, NO, NO2, HCl, ClONO2 and O3 in 7 micro-windows. HNO3 profiles are retrieved using the same algorithm but on a larger spectral window 1Butz, A., Boesch, H., Camy-Peyret, C., et al.:
Intercompar-ison of stratospheric O3 and NO2 profiles by balloon-borne Uv,
vis and near-IR solar occultation spectroscopy, 2nd SCIAMACHY ACP Special issue, Atmos. Chem. Phys. Discuss., in preparation, 2005.
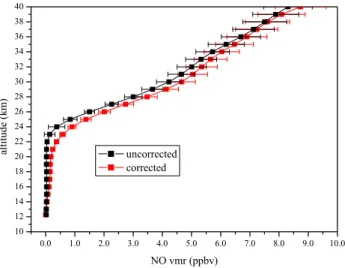
Fig. 1. Comparison between NO vertical profiles retrieved with or
without accounting for the photochemical variations along the line of sight.
(25 cm−1). All the molecular parameters are extracted from the HITRAN2000 database (Rothmann et al., 2000), except for ClONO2, for which we use the absorption cross-sections measured by Wagner and Birk (2003). The error bars of re-trieved NO, NO2, HNO3and ClONO2volume mixing ratio correspond to 2σ fitting error: they do not include, how-ever, the uncertainties on spectroscopic parameters. These are later added to fitting errors in order to estimate the sys-tematic errors: the total error bars are estimated to 10% for NO and NO2, to 15% for HNO3 and to 20% for ClONO2. For tangent heights below 19 km, the spectral micro-window used for the retrieval of ozone is saturated and thus it is diffi-cult to fit correctly the spectrum base line. As a result, the O3 mixing ratio retrieved from LPMA is underestimated. Con-sequently, below 19 km, we have used the ozone vertical pro-files (for sunset and sunrise) retrieved from the DOAS UV-visible measurements (Butz et al., 20051).
3 Comparison method between measurements and model results
The photochemical model used here is a one-dimensional version of the Reprobus chemical-transport model (CTM) (Lef`evre et al., 1994, 1998). The model provides a compre-hensive description of the stratospheric chemistry by inclu-sion of 147 photolytic, gas-phase, and heterogeneous reac-tions. Most of the used absorption cross-sections, gas-phase reactions, and heterogeneous reaction probabilities are those recommended by the latest JPL compilation (Sander et al., 2002). The aerosol surface area used in the model is inferred from the SAGE-II satellite observations (Thomason et al., 1997). The model extends from the ground up to 0.1 hPa (about 65 km), on 42 vertical levels. We used a short
chemi-Fig. 2. Sensitivity to location (latitude, longitude) of O3and NO2
mixing ratio profiles during sunset. Vertical profiles are inferred from the three-dimensional photochemical model, Reprobus. They are calculated at the same solar zenith angle (88.28◦) and at the two model grid points (74◦N, 12◦E) and (66◦N, 22◦E) nearest to the two extreme sunset locations of the tangent point measured.
cal time step of 15 s in order to describe accurately the rapid variations of NOxspecies at sunrise and sunset.
Along the line of sight strong spatial variations of the rad-ical species must be taken into account in the retrieval of ver-tical profiles. The NO volume mixing ratio (vmr) decreases rapidly during sunset and increases rapidly during sunrise. For example, the NO vmr varies by about 20% between 89◦ and 91◦of solar zenith angle (SZA). In this case the assump-tion of a uniform mixing ratio along the line of sight would lead to significant errors. We use the Reprobus 1-D model to calculate the altitude-dependent diurnal variation of NO rela-tive to a SZA reference value of 90◦. Derived correcting fac-tors are then used in the retrieval algorithm to correct the NO vmr on each side of the tangent point along the line of sight. The corrected NO profile is compared to the uncorrected one
922 G. Dufour et al.: Modelling of NOypartitioning
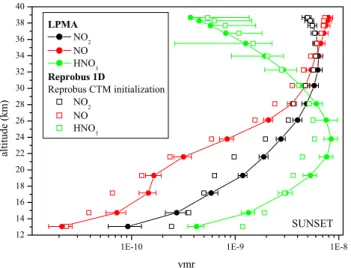
Fig. 3. Comparison between measured NO, NO2and HNO3
pro-files during sunset and corresponding calculated propro-files with the Reprobus 1-D model initialised with Reprobus CTM.
on Fig. 1. The maximum percentage difference reaches more than 85% around 20 km.
For NO2, the differences between the daytime and night-time concentrations are smaller. Payan et al. (1999) showed that the NO2 mixing ratio differences between photochem-ically corrected and uncorrected profiles are less than 6% at any altitude, primarily since the photolysis frequency of NO2 (JNO2)does not change much in the sunlit part of the stratosphere during sunset/sunrise (B¨osch et al., 2001). From a similar measurement technique in absorption (JPL MkIV spectrometer), Sen et al. (1998) deduced that photochemical corrections of NO2profiles are not a significant source of un-certainty. Thus, we did not account for possible variations of the NO2abundance along the line of sight.
During the LPMA and DOAS occultation measurements, the location of the tangent point varies by several degrees in latitude and longitude. Vertical profiles of stratospheric species may thus show substantial variations within the area sampled by the instruments. This is illustrated by the output of a three-dimensional simulation of the Reprobus chemical-transport model on 21 August 2001. Figure 2 plots the ozone and NO2vertical profiles computed near the two extreme lo-cations of the sunset measurements, for the same solar zenith angle. A large spatial variability is observed, with differences of 1.4 ppmv around the maximum of ozone and 0.7 ppbv for NO2(Fig. 2). In order not to introduce additional errors, it is very important to compare measurements and model results at the same time, altitude, longitude and latitude: one must perform a 4-D comparison.
Fig. 4. (a) Comparison between measured NOx/NOyprofile during
sunset and the corresponding calculated profile with the Reprobus 1-D model initialised with Reprobus CTM. (b) Comparison be-tween measured NO/NO2profile during sunset and the
correspond-ing calculated profile with the Reprobus 1-D model initialised with Reprobus CTM.
4 Results and discussion
In this study, the Reprobus 1-D model is initialised shortly before the LPMA measurements at 16:00 UT on 21 August 2001 (sunset) and at 1:00 UT on 22 August 2001 (sunrise). In a first analysis, all species are initialised from the result of a three-dimensional simulation of the Reprobus CTM. The 3-D simulation is initialised on 15 October 2000 and is driven by 6-hourly ECMWF analysis until 21–22 August 2001. The results of the three-dimensional calculations have been inter-polated in latitude and longitude to match the actual location of each sounded tangent altitude and introduced as initial val-ues in the box model. The model evolves then until the actual measurement time (different for each tangent point) through the chemical time step of 15 s. The comparisons between the
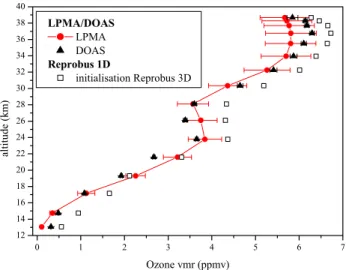
Fig. 5. Ozone vertical profile measured by LPMA is compared to
profiles measured by DOAS and calculated by the Reprobus 1-D model initialised with Reprobus CTM.
measured and simulated profiles of NO, NO2and HNO3are summarized on Fig. 3. Calculated volume mixing ratio of NO, NO2and HNO3are underestimated by the Reprobus 1-D model. The disagreement for HNO3 is explained by the underestimation of the total amount of NOy in the model. The partitioning between NOxand NOyand between NO and NO2are shown on Fig. 4. For the NOx/NOyratio (Fig. 4a), the model is simulating well the ratio for the full altitude range. Thus, relative values of NOy species are well re-produced but not their absolute values. The NO/NO2 ratio is correctly modelled by Reprobus 1-D for all the altitude range, except for altitudes lower than 19 km. Since during high latitude summer the partitioning between NO and NO2 is mainly governed by Reactions (R1) and (R2) the NO/NO2 ratio can be approximated by:
[NO] [NO2]
≈ JNO2
k1[O3]
(1)
Accordingly if the ozone concentration is overestimated, this ratio becomes smaller and the NO and NO2 concentra-tions calculated with a photochemical steady state model are both underestimated. Measured vertical profiles of ozone by LPMA and DOAS experiments are compared to the calcu-lated one on Fig. 5. Ozone volume mixing ratios are overes-timated by the model for all the altitude range, in particular below 19 km where the relative difference between modelled and observed ozone is increasing. This overestimation could explain the underestimation of NO/NO2values for altitudes lower than 19 km (Fig. 4).
The first analysis shows that the NOygas-phase chemistry and the temporal evolution of NOx are well represented in the model. The disagreements observed for individual pro-files are mainly due to the model initialisation. Thus a better initialisation, in particular for ozone and total NOyamounts,
Fig. 6. (a) Comparison between measured NO, NO2and HNO3
profiles during sunset and corresponding calculated profiles with the Reprobus 1-D model constrained by measured O3 and NOy
amounts. (b) Comparison between measured NO, NO2and HNO3 profiles during sunrise and corresponding calculated profiles with the Reprobus 1-D model constrained by measured O3 and NOy
amounts.
is necessary. One way to initialise NOyin the model would be to use the N2O profile measured by LPMA and the ob-served correlation between N2O and NOyin the stratosphere. However, LPMA measurements of N2O are not sufficiently accurate for a firm inter-comparison. Therefore in a second model run, we chose to constrain the model initialisation by the LPMA measurements of total NOyand ozone. For NOy, the three dominant species (NO, NO2 and HNO3)are in-ferred from LPMA retrievals, and they represent between 90 and 95% of total NOydepending on the considered altitude. The other NOyspecies (N2O5, ClONO2. . . ) are derived from the output of the 3-D simulation. The time (hh mm UT), the latitude λ and the longitude µ corresponding to each sounded tangent altitude during sunset and sunrise are reported in Ta-bles 1 and 2. The simplified notation (λ, µ) hh mm is used in the following. As no measurement was performed exactly
924 G. Dufour et al.: Modelling of NOypartitioning
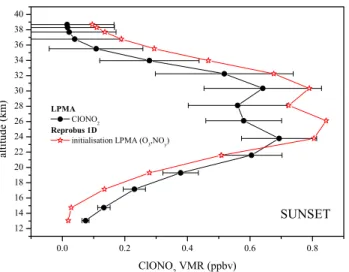
Fig. 7. Comparison between measured ClONO2profile during sun-set and corresponding calculated profiles with the Reprobus 1-D model constrained by measured O3and NOyamounts.
at initialisation time, hhimmiUT, (16:00 UT for sunset and 1:00 UT for sunrise) in the different locations (λ, µ), the O3 and NOy profiles retrieved from LPMA during sunset and sunrise have to be used to initialise the model. They are scaled to their estimated value at 16:00 UT and 1:00 UT. This value is computed from the actual measurements, scaled by the variation predicted by the CTM between the initialisa-tion time and the measurement time. We apply Eq. (2) to the volume mixing ratio of species X for each relevant tangent altitude reported in Tables 1 and 2, i.e. for each correspond-ing time (hh mm UT) and location (λ, µ).
X(λ,µ)hhLP MAimmi = X
(λ,µ)hhimmi
Reprobus X(λ,µ)hh mmReprobus
X(λ,µ)hh mmLP MA (2)
Note that constraining the model with LPMA measurements somewhat disturbs the balance within the NOyfamily, as mi-nor NOy species are not measured. Thus, before analysing the results, the 1-D model is run for about 4 to 50 days (de-pending of the considered altitude) until a satisfactory bal-ance is reached.
Using this model initialisation, a very good agreement be-tween measured and modelled vertical profiles of NO, NO2 and HNO3is observed at sunset and sunrise (cf. Fig. 6). Ex-cept for a slight overestimation of NO between 20 and 24 km, the volume mixing ratio values of NO, NO2and HNO3are well reproduced by the model. A reasonably good agree-ment is also obtained for ClONO2, as shown on Fig. 7. The measured NOx/NOy profile is then well reproduced by the model, as for the first model initialisation with the CTM Reprobus (Fig. 8a). The percentage difference between mea-sured NOx/NOyprofiles and corresponding calculated values for sunset and sunrise is lower than 5% for altitudes higher than 30 km and of the order of 15% for altitudes lower than
Fig. 8. (a) Comparison between measured NOx/NOy profiles
during sunset and the corresponding calculated profile with the Reprobus 1-D model constrained by measured O3 and NOy
amounts. (b) Comparison between measured NO/NO2 profiles
during sunset and the corresponding calculated profile with the Reprobus 1-D model constrained by measured O3 and NOy
amounts.
30 km and the difference never exceeds 25%. The model re-produces very well the partitioning between NO and NO2. In particular, this second model run shows a better agree-ment with LPMA below 19 km, as a result of the more real-istic ozone initialisation in this altitude range (Fig. 8b). Be-tween 25 and 40 km the NO/NO2 percentage difference is smaller than 10% and 5% for sunset and sunrise, respectively. For altitudes lower than 25 km, this difference changes more with the observed conditions and it is of the order of 30% at sunrise. For sunset the discrepancy is around 20% for the three lowest altitudes, whereas the simulated ratios do not fall within the range given by the error bars at 22 km. We believe that this discrepancy can be explained to a large extent by an incomplete coincidence of measurement and model times
12 14 16 18 20 22 24 26 28 0.0 1.0x10⁻⁸ 2.0x10⁻⁸ 3.0x10⁻⁸ 4.0x10⁻⁸
aerosol surface density (cm2/cm3)
altitude (km)
aerosol surface density
deduced from Reprobus CTM deduced from measurements
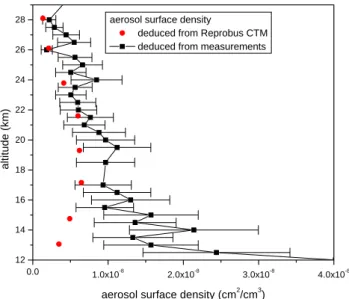
Fig. 9. Comparison between the surface area profile deduced from
the Reprobus CTM seasonal calculations and the same profile de-duced from aerosol concentration measurements (Deshler et al., 2003).
since the instrument assigns two consecutive spectra to the same line of sight and in consequence to the same tangent al-titude. These two spectra correspond to a forward (when the moving mirror of the Michelson interferometer moves away from zero path difference or ZPD, Zero Path Difference) and a reverse (fly back of the mirror to ZPD) interferograms. The duration of this round-trip is around 100 s. A given LOS (Line Of Sight) and time are assigned to a reverse and for-ward scan sharing almost the same ZPD in the middle of this 100 s interval. The tangent altitude varies of several hun-dred meters and of the order of 0.1◦in latitude and longitude during the recording time. Times and locations indicated in Table 1 and 2 are consequently mean times and locations and this is true for the tangent altitude of two consecutive spec-tra. The uncertainty on the time and location of the tangent point could explain a part of the discrepancy observed be-tween calculated and measured values of NO/NO2.
We further test the influence of the aerosol burden on sim-ulated NOy. The previous results were obtained with the aerosol burden usually chosen in the Reprobus CTM sea-sonal calculations. Fig. 9 shows the comparison between the aerosol surface area profile assumed in the Reprobus cal-culations and the same profile deduced from balloon-borne aerosol measurements performed in 2002 (Deshler, 2003). The accuracy of the measured aerosol surface area is only 40% and the variability of aerosol surface area values be-tween two consecutive years is quite large for altitudes lower than 18 km. However, the difference between modelled and measured surface area below 20 km is larger than the uncer-tainties on the measured surface aera. The calculated aerosol distribution is then not completely realistic in particular for
Fig. 10. Comparison between measured NOx/NOyprofiles during
sunset and the corresponding calculated profile with the Reprobus 1-D model constrained by measured O3and NOyamounts and
ini-tialised with aerosol burden derived from CTM calculations or from surface area measurements.
altitudes lower than 20 km. In another model sensitivity test, we thus use the aerosol surface area profile (below 30 km) de-duced from balloon-borne measurements. The comparison of calculated and measured NOx/NOy profiles is presented on Fig. 10. The partitioning of NOx and NOy is governed by both gas-phase and heterogeneous chemistry. Although heterogeneous reactions involving N2O5 are not important in the polar summer stratosphere, the impact of aerosol bur-den initialisation is not negligible for NO, NO2 and HNO3 (from 10% to 25% on average, not shown). Taking into ac-count a more realistic measured stratospheric aerosol bur-den is largely improving the agreement between calculated and measured NOx/NOy profiles (cf. Fig. 10). This is es-pecially true below 20 km, where CTM strongly underesti-mates aerosol. With the new surface area profile, model-observation percentage differences are then smaller than 10% over the covered altitude range, except for the lowest altitude, where it reaches 13%. Very similar results are observed for the sunrise comparison (not shown).
5 Conclusions
The LPMA/DOAS balloon-borne solar occultation measure-ments performed over Kiruna (Sweden) on 21–22 August 2001 allowed us to check our understanding of the NOy and NOxpartitioning during polar summer. In order to test the measured versus simulated NOypartitioning, we used a state-of-art chemical transport model that includes the most recent gas-phase rate coefficients, absorption cross-sections and heterogeneous reactions as recommended by the NASA JPL2003 compilations. Vertical profiles of NO, NO2,
926 G. Dufour et al.: Modelling of NOypartitioning
HNO3, NO/NO2 and NOx/NOy, deduced from LPMA measurements are compared to the corresponding profiles calculated with the Reprobus 1-D model. Different model initialisations are tested and we show that measurements and calculations are in good agreement (both absolute concentrations and mixing ratios) when the photochemical model is constrained by measured ozone and total NOy. This confirms earlier results obtained by Osterman et al. (1999) and Gao et al. (1999) that using the 2003 updated JPL reaction rate coefficients for the partitioning of NOy, much of the earlier disagreement between measured and modelled stratospheric NOxand NOydisappears for the polar summer stratosphere. Moreover, taking realistic stratospheric aerosol burdens, cf. from the Deshler 2002 measurements, leads to a significantly better agreement.
Edited by: J. P. Burrows
References
B¨osch, H., Camy-Peyret, C., Chipperfield, M., Fitzenberger, R., Harder, H., Schiller, C., Schneider, M., Trautmann, T., and Pfeil-sticker, K.: Inter comparison of measured and modeled strato-spheric UV/vis actinic fluxes at large solar zenith angles, Geo-phys. Res. Lett., 28, 1179–1182, 2001.
Brown, S. S., Talukdar, R. K., and Ravishankara, A. R.: Rate con-stants for the reaction OH + NO2+ M → HNO3+ M under
at-mospheric conditions, Chem. Phys. Lett., 229, 277–284, 1999a. Brown S. S., Talukdar, R. K., and Ravishankara, A. R.:
Reconsid-eration of the rate constant for the reaction of hydroxyl radicals with nitric acid, J. Phys. Chem. A, 103, 3031–3037, 1999b. Camy-Peyret, C., Jeseck, P., Hawat, T., Durry, G., Payan, S.,
Berub´e, G., Rochette, L., and Huguenin, D.: The LPMA balloon-borne FTIR spectrometer for remote sensing of atmospheric con-stituents, ESA Publications SP-370, 323–328, 1995.
DeMore, W. B., Sander, S. P., Golden, D. M., et al.: Chemical kinet-ics and photochemical data for use in stratosphere odeling, JPL Publ. 97-4, Jet Propul. Lab., Pasadena, Calif., 1997.
Deshler, T., Hervig, M. E., Hofmann, D. J., Rosen, J. M., and Liley, J. B.: Thirty years of in situ stratospheric aerosol size distribution measurements from Laramie, Wyoming (41◦N), using balloon-borne instruments, J. Geophys. Res., 108, 4167–4179, 2003. Ferlemann, F., Bauer, N., Fizenberger, R., Harder, H., Osterkamp,
H., Perner, D., Platt, U., Scheider, M., Vradelis, P., and Pfeil-sticker, K.: A new DOAS-instrument for stratospheric balloon-borne trace gas studies, Appl. Opt., 39, 2377–2386, 2000. Gao, R. S., Fahey, D. W., Del Negro, L. A., Donnelly, S. G., Keim,
E. R., Neuma, J. A., Teverovskaia, E., Wennberg, P. O., Hanisco, T. F., Lanzendorf, E. J., Proffitt, M. H., Margitan, J. J., Wilson, J. C., Elkins, J. W., Stimpfle, R. M., Cohen, R. C., McElroy, C. T., Bui, T. P., Salawitch, R. J., Brown, S. S., Ravishankara, A. R., Portmann, R. W., Ko, M. K. W., Weisenstein, D. K., and New-man, P. A.: A comparison of observations and model simulations of NOx/NOyin the lower stratosphere, Geophys. Res. Lett., 26,
1153–1156, 1999.
Lary, D. J., Toumi, R., Lee, A. M., Newchurch, M., Pirre, M., and Renard, J.-B.: Carbon aerosols and atmospheric photo-chemistry, J. Geophys. Res., 102, 3671–3682, 1997.
Lef`evre, F., Brasseur, G., Folkins, I., Smith, A. K., and Simon, P.: Chemistry of the 1991–1992 stratospheric winter: Three di-mensional model simulations, J. Geophys. Res., 99, 8183–8195, 1994.
Lef`evre, F., Figarol, F., Carslaw, K. S., and Peter, T.: The 1997 Arctic ozone depletion quantified from three-dimensional model simulations, Geophys. Res. Lett., 25, 2425–2428, 1998. Osterman, G. B., Sen, B., Toon, G. C., Salawitch, R. J., Margitan, J.
J., and Blavier, J. F.: Partitioning of NOyspecies in the summer
Arctic stratosphere, Geophys. Res. Lett., 26, 1157–1160, 1999. Payan, S., Camy-Peyret, C., Jeseck, P., Hawat, T., Pirre, M.,
Re-nard, J. B., Robert, C., Lef`evre, F., Kanzawa, H., and Sasano, Y.: Diurnal and nocturnal distribution of stratospheric NO2from
solar and stellar occultation measurements in the Arctic vortex: Comparison with models and ILAS satellite measurements, J. Geophys. Res., 104, 21 585–21 593, 1999.
Perkins, K. K., Hanisco, T. F., Cohen, R. C., Koch, L. C., Stimpfle, R. M., Voss, P. B., Bonne, G. P., Lanzendorf, E. J., Anderson, J. G., Wennberg, P. O., Gao, R. S., Del Negro, L. A., Salawitch, R. J., McElroy, C. T., Hintsa, E. J., Loewenstein, M., and Bui, T. P.: The NOx-HNO3system in the lower stratosphere: Insights
from in situ measurements and implications of the JHNO3-[OH)
relationship, J. Phys. Chem. A, 105, 1521–1534, 2001.
Rothman, L. S., Rinsland, C. P., Goldman, A., et al.: The HITRAN molecular database: edition of 2000 including updates through 2001, JQSRT, 82, 5–44, 2003.
Sander, S. P., Friedl, R. R., Golden, D. M., et al.: Chemical ki-netics and photochemical data for Use in atmospheric studies, NASA/JPL Evaluation, JPL Publication 02-25, 2002. Only on-line: http://jpldataeval.jpl.nasa.gov.
Sen, B., Toon, G. C., Osterman, G. B., Blavier, J.-F., Margitan, J. J., Salawitch, R. J., and Yue, G. K.: Measurements of reactive nitrogen in the stratosphere, J. Geophys. Res., 103, 3571–3585, 1998.
Thomason, L. W., Poole, L. R., and Deshler, T. R.: A Global Cli-matology Of Stratospheric Aerosol Surface Area Density As De-duced From SAGE II: 1984–1994, J. Geophys. Res., 102, 8967– 8976, 1997.
Wagner, G. and Birk, A.: New infrared spectroscopic database for chlorine nitrate, JQSRT, 82, 443–460, 2003.
Wennberg, P. O., Cohen, R. C., Stimpfle, R. M., Koplow, J. P., An-derson, J. G., Salawitch, R. J., Fahey, D. W., Woodbridge, E. L., Keim, E. R., Gao, R. S., Webster, C. R., May, R. D., Toohey, D. W., Avallone, L. M., Proffitt, M. H., Loewenstein, M., Podolske, J. R., Chan, K. R., and Wofsy, S. C.: Removal of stratospheric O3by radicals: In situ measurements of OH, HO2, NO2, ClO
and BrO, Science, 266, 398–404, 1994.
Wetzel, G., Oelhaf, H., von Clarmann, T., Fischer, H., Friedl-Vallon, F., Maucher, G., Seefeldner, M., and Trieschmann, O.: Vertical profiles of N2O5, HO2NO2and NO2inside the Arctic vortex retrieved from nocturnal MIPAS-B2 infrared limb emis-sion measurements in February 1995, J. Geophys. Res., 102, 19 177–19 186, 1997.